The same plot in 14 other libraries — JavaScript: Chart.js, D3.js, Highcharts, MUI X Charts; Python: Altair, Bokeh, lets-plot, Matplotlib, Plotly, plotnine, Pygal, Seaborn; R: ggplot2; Julia: Makie.jl. Compare all 15 side by side: Contour Lines on Geographic Map in Python, R, Julia and JavaScript.
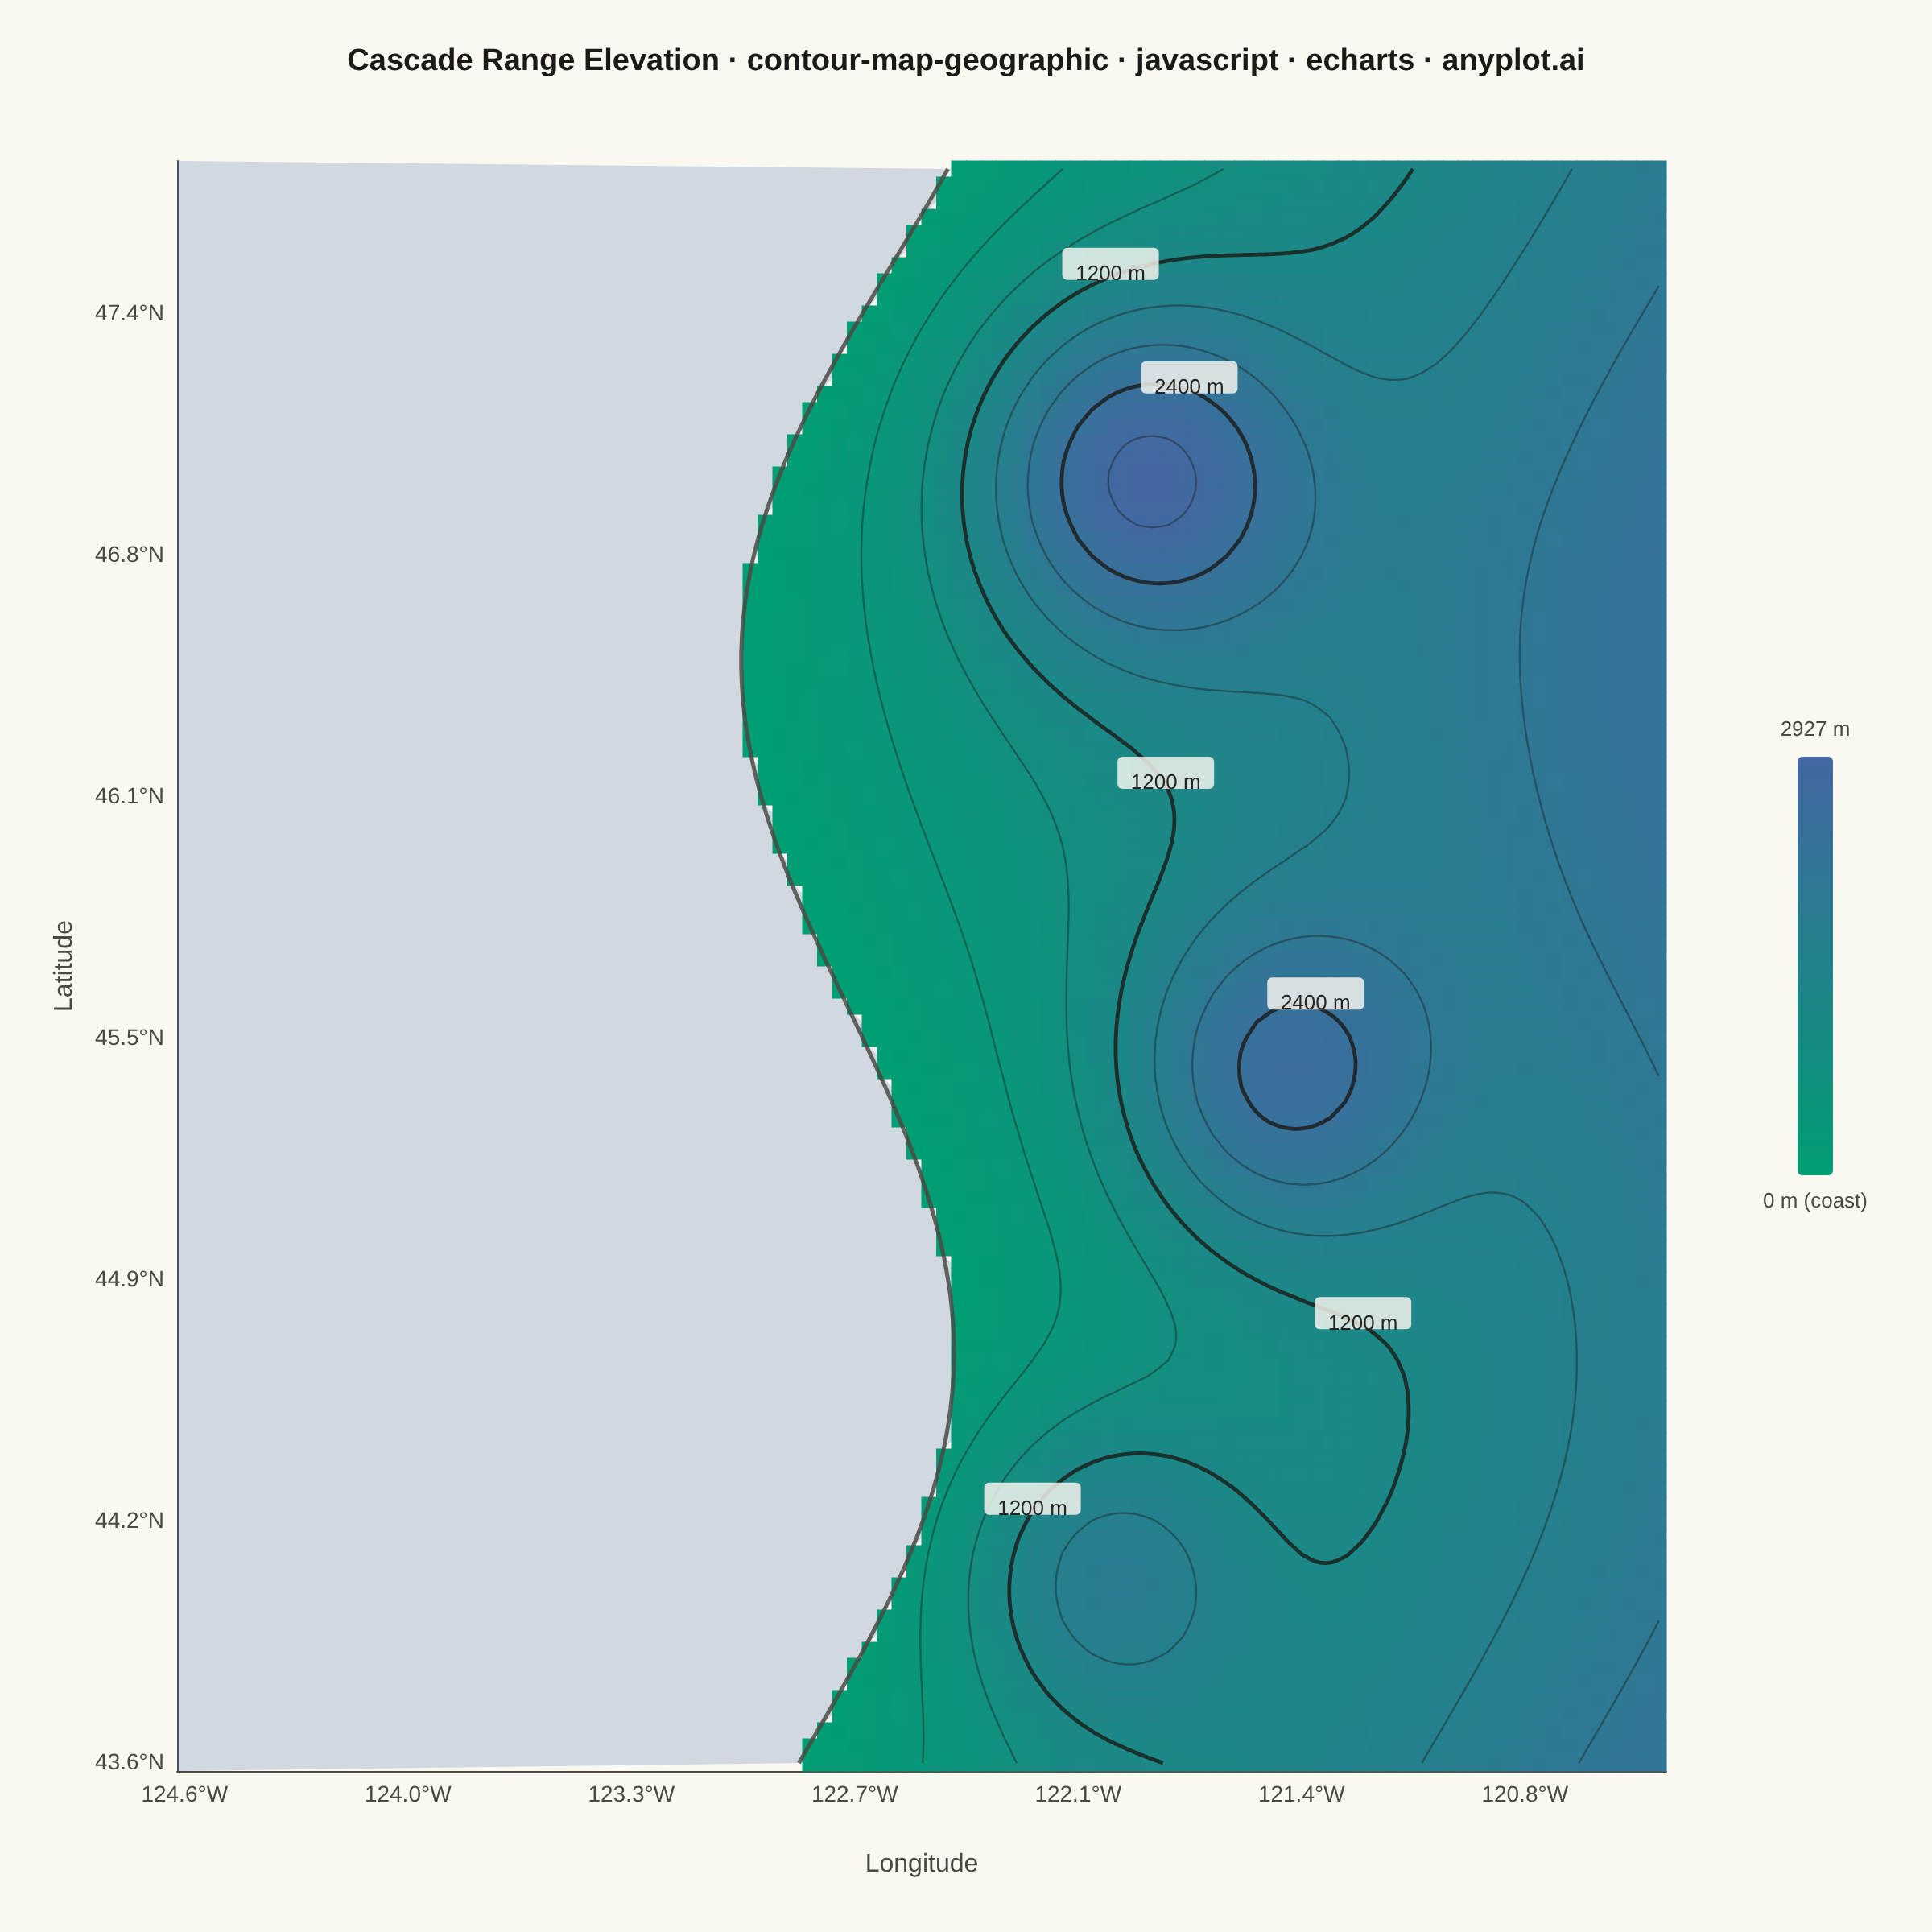
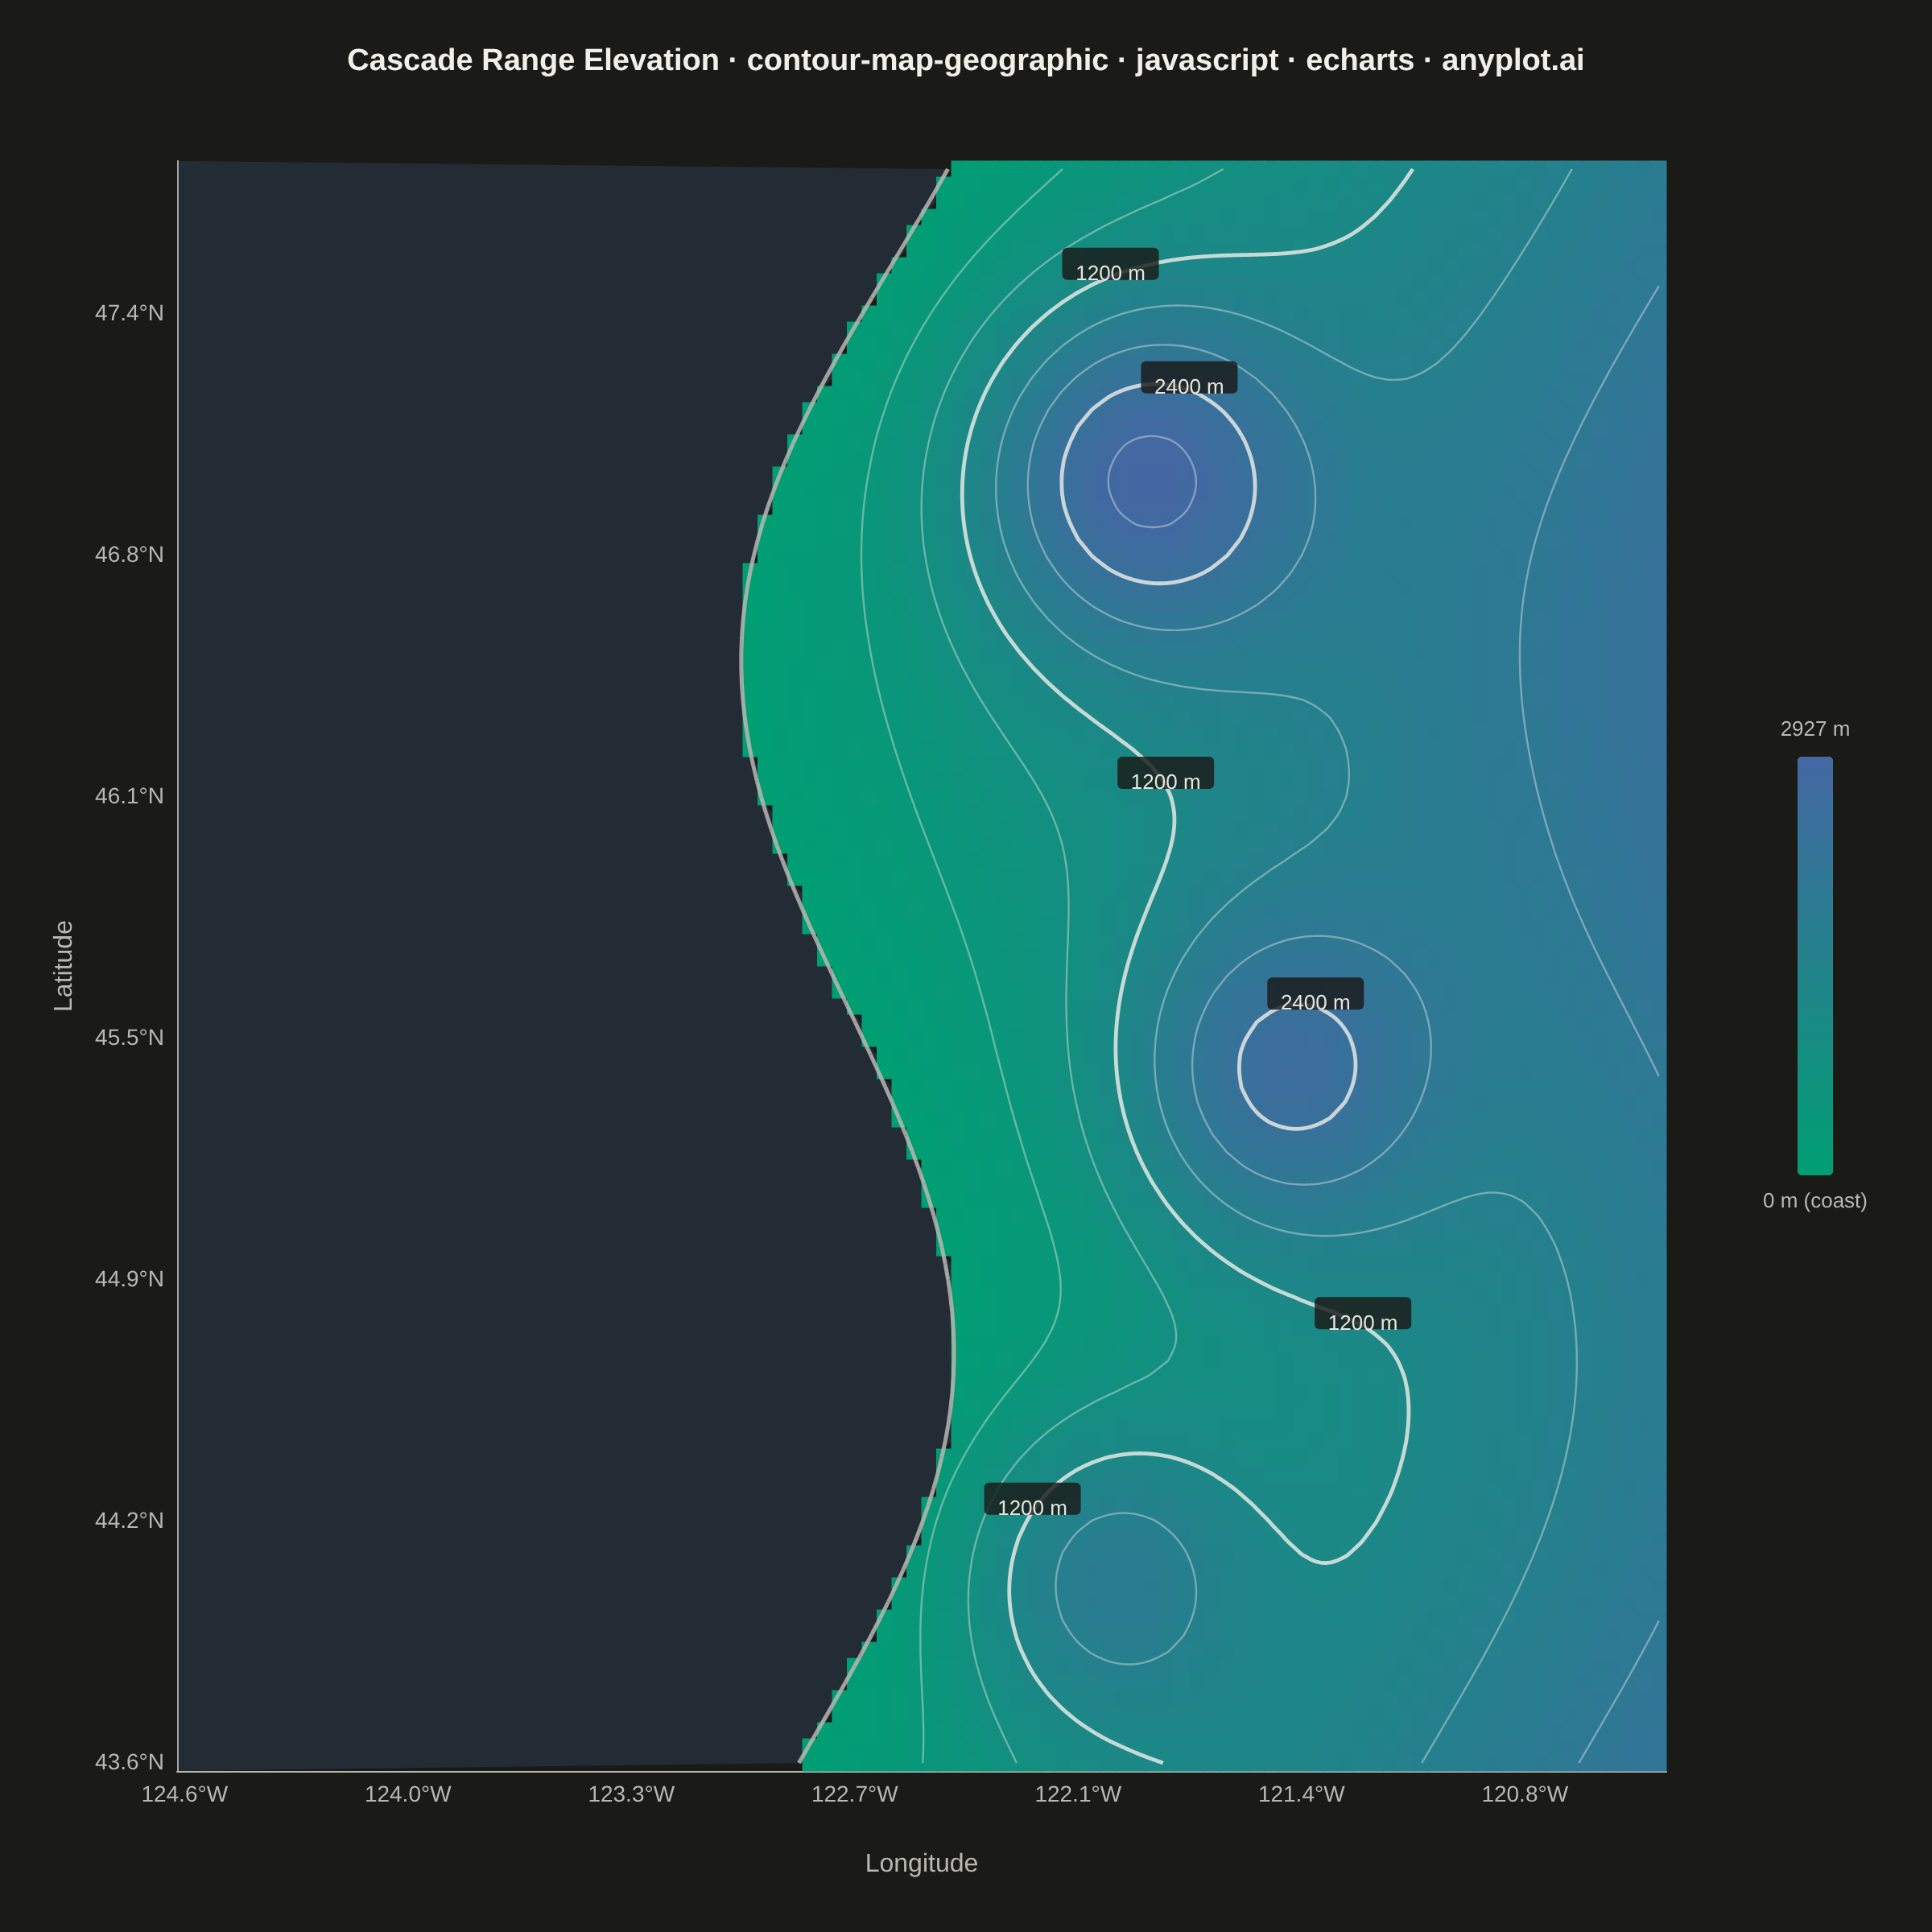
A contour map overlays isolines (lines of equal value) onto a geographic basemap, visualizing continuous spatial data such as elevation, temperature, or atmospheric pressure across real-world coordinates. Unlike basic contour plots that use abstract x/y coordinates, this plot anchors contours to latitude/longitude positions with geographic context like coastlines, borders, or terrain. It combines the precision of isoline visualization with spatial awareness, making it ideal for meteorological, topographic, and environmental applications.
// anyplot.ai
// contour-map-geographic: Contour Lines on Geographic Map
// Library: echarts 6.1.0 | JavaScript 22.23.2
// Quality: 93/100 | Updated: 2026-09-02
//# anyplot-orientation: square

const t = window.ANYPLOT_TOKENS;

// --- Data (in-memory, deterministic) ----------------------------------------
// Synthetic elevation model of a coastal mountain range (Cascade-like terrain):
// a wavy coastline, an inland rise, and three peaks. Grid: 100 x 100 points
// over a 4.2° x 4.2° lon/lat box (fine enough that marching-squares isolines
// read as smooth curves rather than faceted polygons).
const LON_MIN = -124.6, LON_MAX = -120.4;
const LAT_MIN = 43.6, LAT_MAX = 47.8;
const NX = 100, NY = 100;
const TICK_INTERVAL = Math.max(1, Math.floor(NX / 7));

const lonVals = Array.from({ length: NX }, (_, i) => LON_MIN + (i * (LON_MAX - LON_MIN)) / (NX - 1));
const latVals = Array.from({ length: NY }, (_, j) => LAT_MIN + (j * (LAT_MAX - LAT_MIN)) / (NY - 1));

function coastLon(lat) {
  const p = (lat - LAT_MIN) / (LAT_MAX - LAT_MIN);
  return -122.7 + 0.4 * Math.sin(p * 6.6) - 0.15 * Math.cos(p * 3.1);
}

const PEAKS = [
  { lon: -121.9, lat: 47.0, h: 2000, s: 0.34 }, // northern range crest
  { lon: -121.5, lat: 45.4, h: 1550, s: 0.32 }, // central summit
  { lon: -122.0, lat: 44.1, h: 1300, s: 0.3 },  // southern summit
];

function elevationAt(lon, lat) {
  const coast = coastLon(lat);
  if (lon < coast) return 0; // ocean
  let z = (lon - coast) * 900; // inland rise toward the crest
  for (const peak of PEAKS) {
    const d2 = (lon - peak.lon) ** 2 + (lat - peak.lat) ** 2;
    z += peak.h * Math.exp(-d2 / (2 * peak.s * peak.s));
  }
  return Math.min(3400, z);
}

// Flat grid of elevations (index space) + land-only heatmap tiles.
const gridZ = new Array(NX * NY);
const gridData = [];
let maxVal = 0;
for (let j = 0; j < NY; j++) {
  for (let i = 0; i < NX; i++) {
    const z = elevationAt(lonVals[i], latVals[j]);
    gridZ[j * NX + i] = z;
    if (z > 0) {
      gridData.push([i, j, z]);
      if (z > maxVal) maxVal = z;
    }
  }
}

const lonLabels = lonVals.map((v) => `${Math.abs(v).toFixed(1)}°W`);
const latLabels = latVals.map((v) => `${v.toFixed(1)}°N`);

// --- Coastline overlay (index-space polyline) -------------------------------
function lonToIndex(lon) {
  return ((lon - LON_MIN) / (LON_MAX - LON_MIN)) * (NX - 1);
}
const coastSegments = [];
for (let j = 0; j < NY - 1; j++) {
  const x1 = lonToIndex(coastLon(latVals[j]));
  const x2 = lonToIndex(coastLon(latVals[j + 1]));
  coastSegments.push([[x1, j], [x2, j + 1]]);
}

// Single ocean polygon that shares its right edge with the land heatmap
// tiles' left edge on every row: heatmap tiles are grid-snapped (they exist
// from the first whole index where elevationAt > 0, spanning index±0.5), so
// the fill boundary must be grid-snapped too, not the continuous fractional
// coastline — otherwise up to half a cell of page background bleeds through
// between the two fills at every staircase step.
function firstLandIndex(j) {
  const ci = lonToIndex(coastLon(latVals[j]));
  return Math.ceil(ci - 1e-9);
}
const oceanPolygon = [[-0.5, -0.5]];
for (let j = 0; j < NY; j++) oceanPolygon.push([firstLandIndex(j) - 0.5, j]);
oceanPolygon.push([-0.5, NY - 0.5]);

// --- Marching squares: isoline segments for one elevation threshold ---------
function contourSegments(threshold) {
  const segs = [];
  for (let j = 0; j < NY - 1; j++) {
    for (let i = 0; i < NX - 1; i++) {
      const vbl = gridZ[j * NX + i];
      const vbr = gridZ[j * NX + (i + 1)];
      const vtr = gridZ[(j + 1) * NX + (i + 1)];
      const vtl = gridZ[(j + 1) * NX + i];

      const abl = vbl >= threshold;
      const abr = vbr >= threshold;
      const atr = vtr >= threshold;
      const atl = vtl >= threshold;
      if (abl === abr && abr === atr && atr === atl) continue;

      const lerp = (a, b, va, vb) => a + ((b - a) * (threshold - va)) / (vb - va);
      const pts = [];
      if (abl !== abr) pts.push([lerp(i, i + 1, vbl, vbr), j]);
      if (abr !== atr) pts.push([i + 1, lerp(j, j + 1, vbr, vtr)]);
      if (atr !== atl) pts.push([lerp(i, i + 1, vtl, vtr), j + 1]);
      if (atl !== abl) pts.push([i, lerp(j, j + 1, vbl, vtl)]);

      if (pts.length === 2) {
        segs.push([pts[0], pts[1]]);
      } else if (pts.length === 4) {
        const center = (vbl + vbr + vtr + vtl) / 4;
        const code5 = abl && atr && !abr && !atl;
        const swapped = code5 ? center < threshold : center >= threshold;
        if (swapped) {
          segs.push([pts[0], pts[3]]);
          segs.push([pts[1], pts[2]]);
        } else {
          segs.push([pts[0], pts[1]]);
          segs.push([pts[2], pts[3]]);
        }
      }
    }
  }
  return segs;
}

// --- Chain raw marching-squares segments into connected paths --------------
// Adjacent cells produce segments that share an exact interpolated endpoint
// (same grid-edge crossing), so a simple point-key walk reconnects them into
// closed loops (rings around a peak) or open chains (cut off by the map
// edge). Chaining first is what lets us smooth the *path*, not each tiny
// facet independently, and label once per loop instead of once per segment.
function chainSegments(segs) {
  const key = (p) => `${p[0].toFixed(5)},${p[1].toFixed(5)}`;
  const pointMap = new Map();
  segs.forEach((seg, idx) => {
    [0, 1].forEach((end) => {
      const k = key(seg[end]);
      if (!pointMap.has(k)) pointMap.set(k, []);
      pointMap.get(k).push({ idx, end });
    });
  });

  const used = new Array(segs.length).fill(false);
  const chains = [];
  const takeNeighbor = (pointKey, currentIdx) => {
    const candidates = pointMap.get(pointKey) || [];
    for (const c of candidates) {
      if (c.idx !== currentIdx && !used[c.idx]) return c;
    }
    return null;
  };

  for (let start = 0; start < segs.length; start++) {
    if (used[start]) continue;
    used[start] = true;
    const chain = [segs[start][0], segs[start][1]];

    let next = takeNeighbor(key(chain[chain.length - 1]), start);
    while (next) {
      const seg = segs[next.idx];
      chain.push(seg[next.end === 0 ? 1 : 0]);
      used[next.idx] = true;
      next = takeNeighbor(key(chain[chain.length - 1]), next.idx);
    }
    let prev = takeNeighbor(key(chain[0]), -1);
    while (prev) {
      const seg = segs[prev.idx];
      chain.unshift(seg[prev.end === 0 ? 1 : 0]);
      used[prev.idx] = true;
      prev = takeNeighbor(key(chain[0]), prev.idx);
    }
    chains.push(chain);
  }
  return chains;
}

// Chaikin corner-cutting: replaces each edge with two points 1/4 and 3/4
// along it, rounding the polygonal marching-squares output into a smooth
// curve without changing the underlying topology. `points` must be the
// distinct ring vertices with NO repeated closing point — chainSegments
// represents a closed loop as [...ring, ring[0]] (first === last, so the
// shape renders closed), and feeding that duplicate straight into the
// modulo-wrapped closed-loop math below creates one degenerate zero-length
// edge exactly at the seam, which survives every iteration as an unsmoothed
// sharp corner (the notch/spike artifacts on the peak rings). Callers must
// strip the duplicate before calling and re-append it after.
function chaikinSmooth(points, iterations, closed) {
  let pts = points;
  for (let it = 0; it < iterations; it++) {
    const next = [];
    const n = pts.length;
    const edgeCount = closed ? n : n - 1;
    if (!closed) next.push(pts[0]);
    for (let i = 0; i < edgeCount; i++) {
      const p0 = pts[i];
      const p1 = pts[(i + 1) % n];
      next.push([p0[0] * 0.75 + p1[0] * 0.25, p0[1] * 0.75 + p1[1] * 0.25]);
      next.push([p0[0] * 0.25 + p1[0] * 0.75, p0[1] * 0.25 + p1[1] * 0.75]);
    }
    if (!closed) next.push(pts[pts.length - 1]);
    pts = next;
  }
  return pts;
}

// Elevation isolines every 400 m; every third line (1200 m) is a bold, labeled
// "index contour" — the cartographic convention for topographic maps.
const CONTOUR_INTERVAL = 400;
const INDEX_EVERY = 1200;
const levels = [];
for (let lvl = CONTOUR_INTERVAL; lvl <= maxVal; lvl += CONTOUR_INTERVAL) levels.push(lvl);

// One entry per smoothed contour loop/chain: { points, labels, bold }. A
// single elevation level often forms one long connected boundary that
// snakes past several peaks (the inland-rise term keeps the ridge between
// peaks above the threshold too) rather than one separate ring per peak —
// so index (bold) chains get a label every ~55 points of *raw* (pre-smooth)
// path, spacing labels out along the line instead of stamping just one per
// chain. Basing the count on the raw chain — not the Chaikin-smoothed one —
// keeps label density independent of the smoothing-iteration count.
const CHAIKIN_ITERATIONS = 4;
const RAW_LABEL_SPACING = 55;
const contourPaths = [];
levels.forEach((threshold) => {
  const bold = threshold % INDEX_EVERY === 0;
  const rawChains = chainSegments(contourSegments(threshold));
  rawChains.forEach((chain) => {
    if (chain.length < 2) return;
    const closed =
      chain.length > 2 &&
      Math.abs(chain[0][0] - chain[chain.length - 1][0]) < 1e-4 &&
      Math.abs(chain[0][1] - chain[chain.length - 1][1]) < 1e-4;
    // Drop the duplicate closing vertex before smoothing (see chaikinSmooth
    // comment above), then re-append it so the rendered path still closes.
    const ringPoints = closed ? chain.slice(0, -1) : chain;
    const smoothed = chaikinSmooth(ringPoints, CHAIKIN_ITERATIONS, closed);
    if (closed) smoothed.push(smoothed[0]);

    const labels = [];
    if (bold) {
      const count = Math.max(1, Math.round(chain.length / RAW_LABEL_SPACING));
      for (let k = 0; k < count; k++) {
        const at = Math.min(smoothed.length - 1, Math.floor(((k + 0.5) * smoothed.length) / count));
        labels.push({ text: `${threshold} m`, at });
      }
    }
    contourPaths.push({ points: smoothed, labels, bold });
  });
});

// api.coord() on a *category* axis runs every value through ECharts'
// OrdinalScale.parse, which does `Math.round()` on numeric input before
// mapping to pixels — silently snapping every fractional marching-squares /
// Chaikin coordinate to the nearest whole grid line. That's what was making
// the "smoothed" contours render as raw staircases. Fix: read the pixel
// position of only the two exact-integer axis ends (never rounded, since
// they're already integers) once per renderItem call, then interpolate
// fractional coordinates ourselves — bypassing the axis's rounding entirely.
function projectPoint(api, pt) {
  const origin = api.coord([0, 0]);
  const xEnd = api.coord([NX - 1, 0]);
  const yEnd = api.coord([0, NY - 1]);
  const pxPerX = (xEnd[0] - origin[0]) / (NX - 1);
  const pxPerY = (yEnd[1] - origin[1]) / (NY - 1);
  return [origin[0] + pt[0] * pxPerX, origin[1] + pt[1] * pxPerY];
}

// --- Init --------------------------------------------------------------------
const chart = echarts.init(document.getElementById('container'));

const TITLE = 'Cascade Range Elevation · contour-map-geographic · javascript · echarts · anyplot.ai';

chart.setOption({
  animation: false,
  backgroundColor: 'transparent',
  title: {
    text: TITLE,
    left: 'center',
    top: 24,
    textStyle: { color: t.ink, fontSize: Math.round(24 * Math.min(1, 67 / TITLE.length)), fontWeight: 'bold' },
  },
  grid: { left: 110, right: 165, top: 100, bottom: 100 },
  xAxis: {
    type: 'category',
    data: lonLabels,
    name: 'Longitude',
    nameLocation: 'middle',
    nameGap: 50,
    nameTextStyle: { color: t.inkSoft, fontSize: 16 },
    axisLabel: { color: t.inkSoft, fontSize: 14, interval: TICK_INTERVAL },
    axisLine: { lineStyle: { color: t.inkSoft } },
    axisTick: { show: false },
    splitLine: { show: false },
  },
  yAxis: {
    type: 'category',
    data: latLabels,
    name: 'Latitude',
    nameLocation: 'middle',
    nameGap: 60,
    nameTextStyle: { color: t.inkSoft, fontSize: 16 },
    axisLabel: { color: t.inkSoft, fontSize: 14, interval: TICK_INTERVAL },
    axisLine: { lineStyle: { color: t.inkSoft } },
    axisTick: { show: false },
    splitLine: { show: false },
  },
  visualMap: {
    min: 0,
    max: maxVal,
    seriesIndex: [1],
    calculable: false,
    orient: 'vertical',
    right: 25,
    top: 'center',
    itemHeight: 260,
    itemWidth: 22,
    inRange: { color: t.seq },
    textStyle: { color: t.inkSoft, fontSize: 13 },
    text: [`${Math.round(maxVal)} m`, '0 m (coast)'],
    formatter: (v) => `${Math.round(v)} m`,
  },
  series: [
    {
      // Subtle basemap tint for the ocean — the "water → blue" semantic
      // exception from the Imprint palette, at low opacity so it reads as a
      // faint fill rather than competing with the imprint_seq land gradient.
      type: 'custom',
      coordinateSystem: 'cartesian2d',
      renderItem(params, api) {
        const coords = oceanPolygon.map((p) => projectPoint(api, p));
        return {
          type: 'polygon',
          shape: { points: coords },
          style: { fill: t.palette[2], opacity: 0.22 },
        };
      },
      data: [[0, 0]],
      encode: { x: 0, y: 1 },
      z: 1,
      silent: true,
    },
    {
      // Filled elevation surface — land tiles only.
      type: 'heatmap',
      data: gridData,
      emphasis: { disabled: true },
      z: 2,
    },
    {
      // Coastline overlay marking land/ocean boundary.
      type: 'custom',
      coordinateSystem: 'cartesian2d',
      renderItem(params, api) {
        const seg = coastSegments[params.dataIndex];
        const p1 = projectPoint(api, seg[0]);
        const p2 = projectPoint(api, seg[1]);
        return {
          type: 'line',
          shape: { x1: p1[0], y1: p1[1], x2: p2[0], y2: p2[1] },
          style: { stroke: t.inkSoft, lineWidth: 2.5, opacity: 0.85 },
        };
      },
      data: coastSegments.map((_, idx) => [idx, 0]),
      encode: { x: 0, y: 1 },
      z: 5,
      silent: true,
    },
    {
      // Elevation isolines via marching squares, chained into paths and
      // Chaikin-smoothed — bold + labeled (once per loop) every 1200 m.
      type: 'custom',
      coordinateSystem: 'cartesian2d',
      renderItem(params, api) {
        const path = contourPaths[params.dataIndex];
        const coords = path.points.map((p) => projectPoint(api, p));
        const lineEl = {
          type: 'polyline',
          shape: { points: coords },
          style: { stroke: t.ink, lineWidth: path.bold ? 2.4 : 1.2, opacity: path.bold ? 0.8 : 0.4, fill: 'none' },
        };

        if (!path.labels.length) return lineEl;

        const labelEls = path.labels.flatMap((lbl) => {
          const [mx, my] = coords[lbl.at];
          return [
            {
              type: 'rect',
              shape: { x: mx - 30, y: my - 18, width: 60, height: 20, r: 3 },
              style: { fill: t.pageBg, opacity: 0.82 },
            },
            {
              type: 'text',
              x: mx,
              y: my - 8,
              style: {
                text: lbl.text,
                fill: t.ink,
                fontSize: 13,
                fontFamily: 'sans-serif',
                textAlign: 'center',
                opacity: 0.95,
              },
            },
          ];
        });

        return { type: 'group', children: [lineEl, ...labelEls] };
      },
      data: contourPaths.map((_, idx) => [idx, 0]),
      encode: { x: 0, y: 1 },
      z: 10,
      silent: true,
    },
  ],
});
Runnable source as JSON, for any HTTP client: https://api.anyplot.ai/specs/contour-map-geographic/echarts/code. Any spec id and library id listed in llms-full.txt fit the same URL shape; every URL below is complete and callable.
{
  "spec_id": "contour-map-geographic",
  "language": "javascript",
  "library": "echarts",
  "page": "https://anyplot.ai/contour-map-geographic/javascript/echarts",
  "hub": "https://anyplot.ai/contour-map-geographic",
  "code_json": "https://api.anyplot.ai/specs/contour-map-geographic/echarts/code",
  "spec_json": "https://api.anyplot.ai/specs/contour-map-geographic",
  "render_light_png": "https://storage.googleapis.com/anyplot-images/plots/contour-map-geographic/javascript/echarts/plot-light.png",
  "render_dark_png": "https://storage.googleapis.com/anyplot-images/plots/contour-map-geographic/javascript/echarts/plot-dark.png",
  "interactive_light_html": "https://storage.googleapis.com/anyplot-images/plots/contour-map-geographic/javascript/echarts/plot-light.html",
  "interactive_dark_html": "https://storage.googleapis.com/anyplot-images/plots/contour-map-geographic/javascript/echarts/plot-dark.html",
  "quality_score": 93.0,
  "license": "MIT",
  "guide": "https://anyplot.ai/llms.txt"
}
Part of Contour Lines on Geographic Map on anyplot.ai.