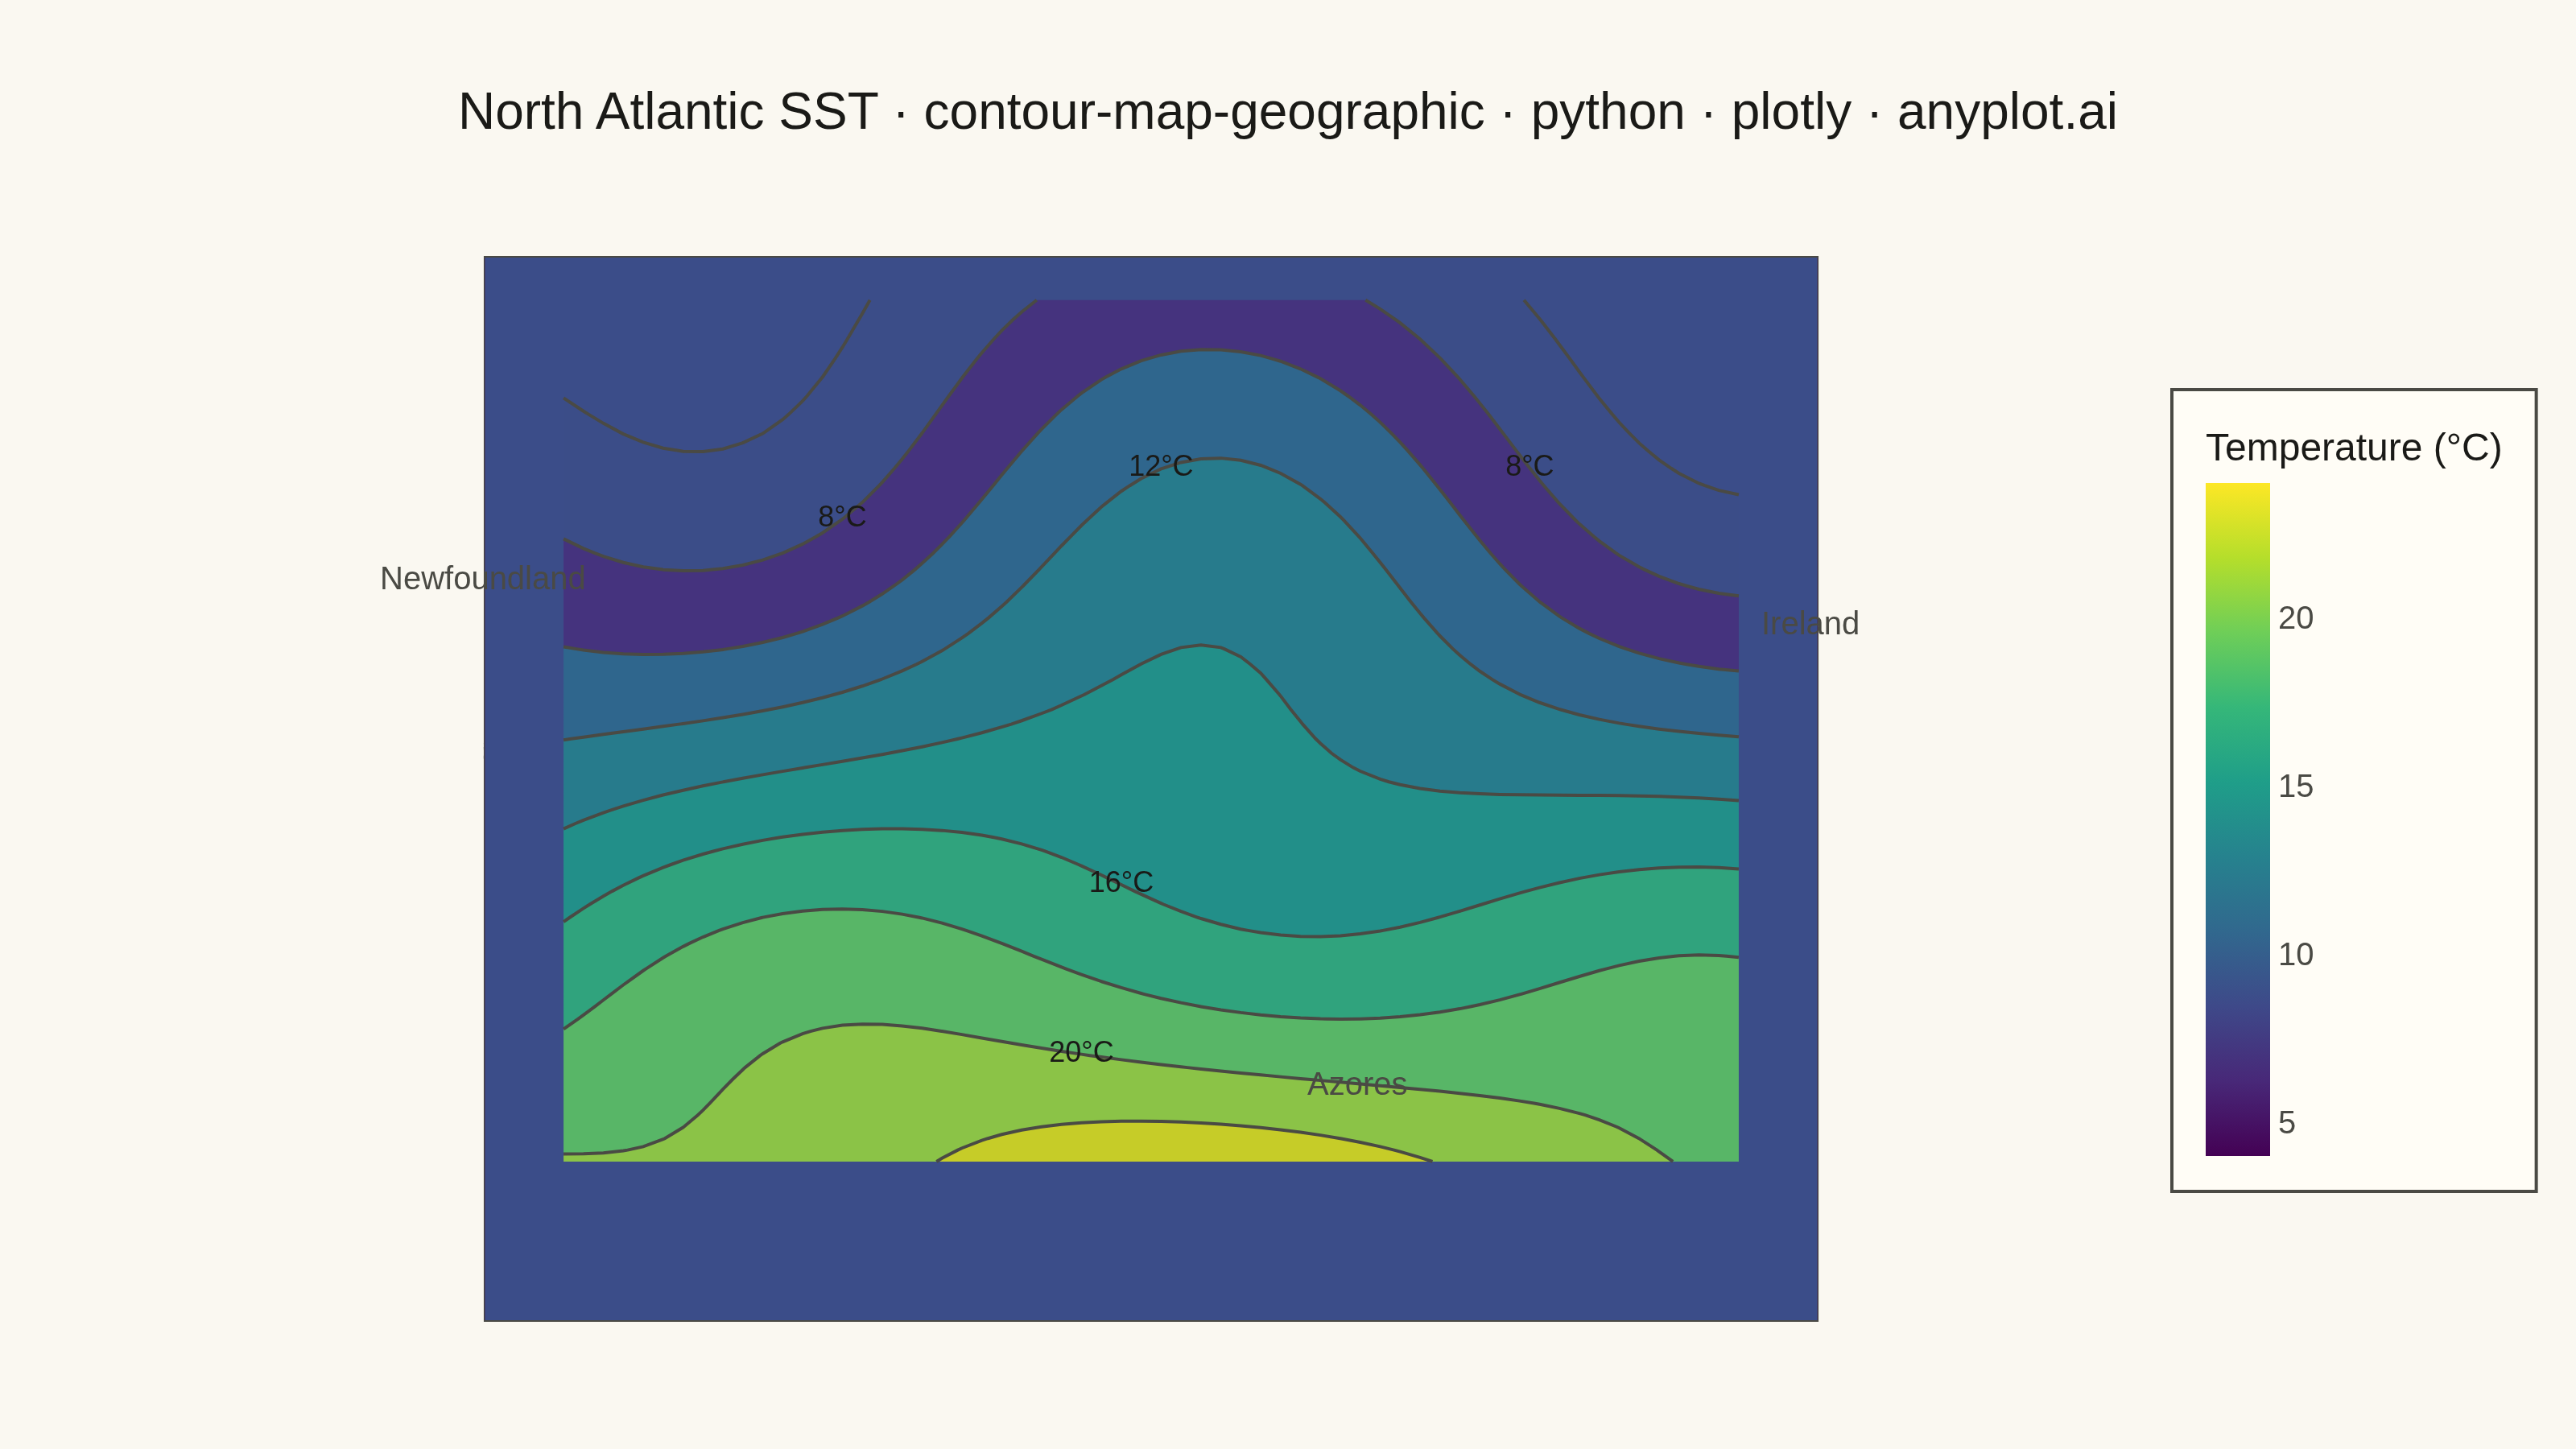
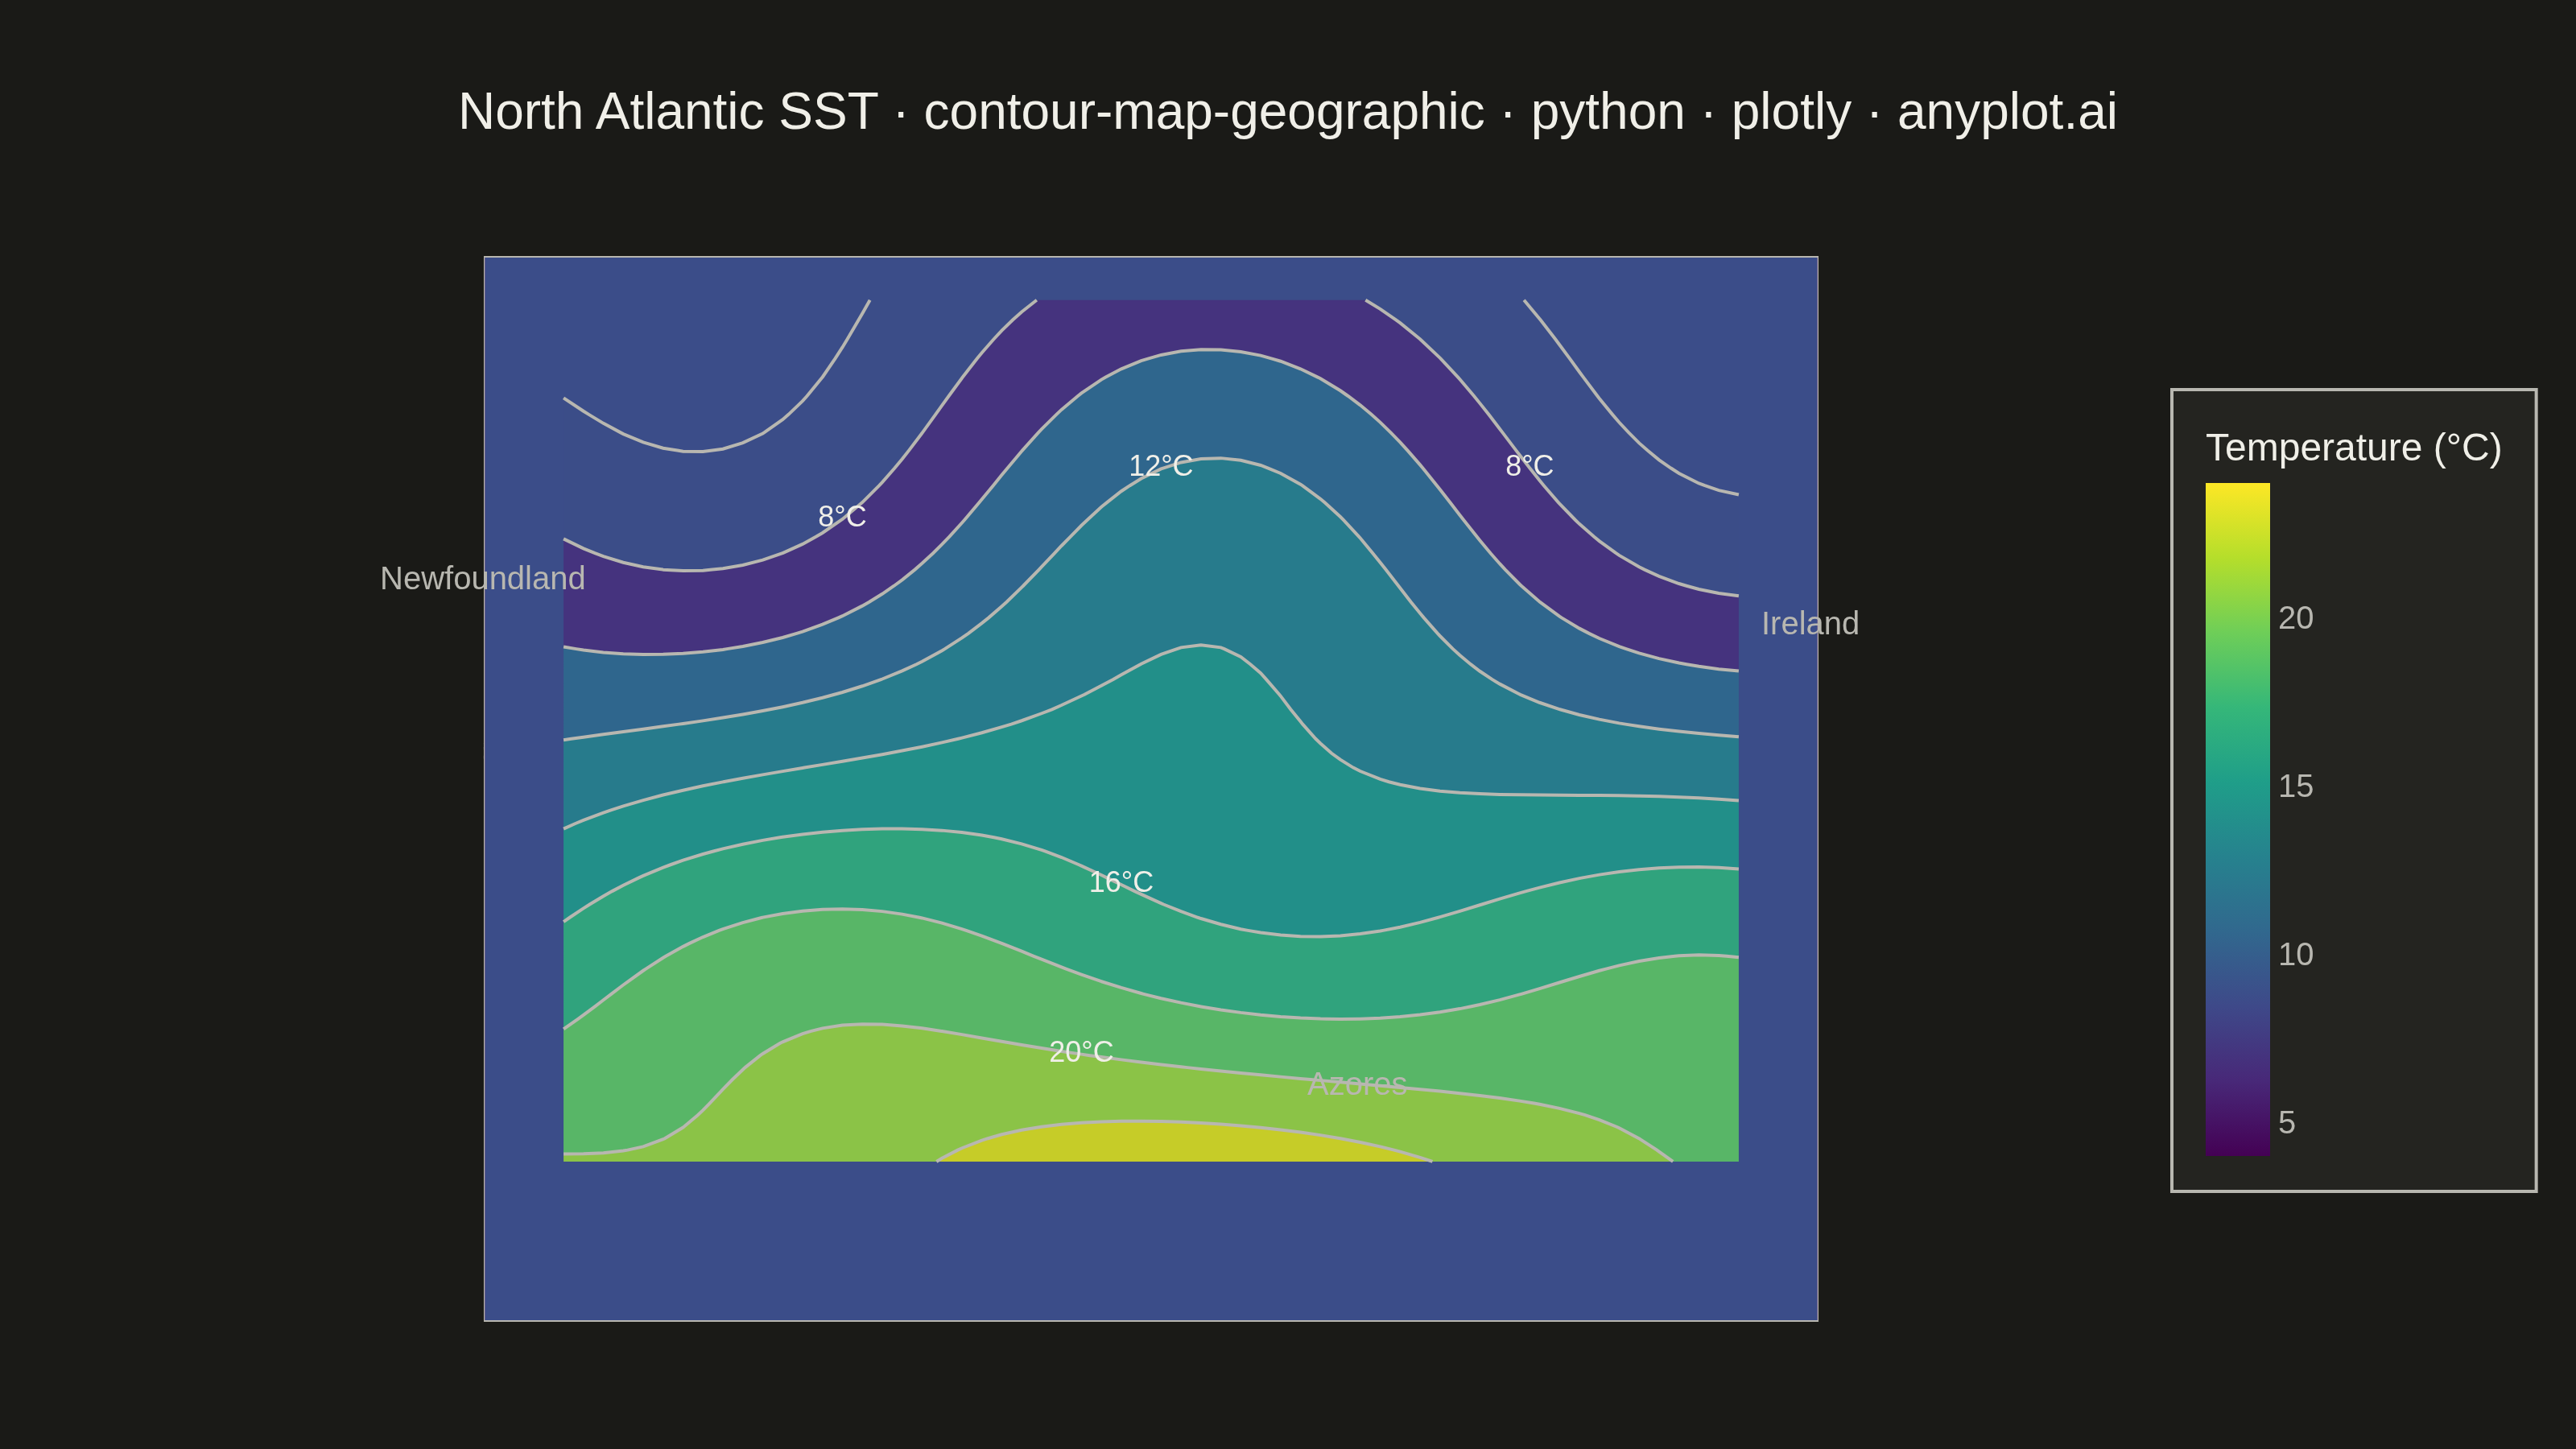
A contour map overlays isolines (lines of equal value) onto a geographic basemap, visualizing continuous spatial data such as elevation, temperature, or atmospheric pressure across real-world coordinates. Unlike basic contour plots that use abstract x/y coordinates, this plot anchors contours to latitude/longitude positions with geographic context like coastlines, borders, or terrain. It combines the precision of isoline visualization with spatial awareness, making it ideal for meteorological, topographic, and environmental applications.
""" anyplot.ai
contour-map-geographic: Contour Lines on Geographic Map
Library: plotly 6.7.0 | Python 3.13.13
Quality: 84/100 | Updated: 2026-05-20
"""

import os
import sys


# Remove the script's own directory from sys.path so the sibling matplotlib.py
# implementation file does not shadow the system matplotlib package.
_here = os.path.dirname(os.path.abspath(__file__))
sys.path = [p for p in sys.path if p and os.path.abspath(p) != _here]

import matplotlib


matplotlib.use("Agg")
import matplotlib.colors as mcolors
import matplotlib.pyplot as plt
import numpy as np
import plotly.graph_objects as go


# Theme tokens
THEME = os.getenv("ANYPLOT_THEME", "light")
PAGE_BG = "#FAF8F1" if THEME == "light" else "#1A1A17"
ELEVATED_BG = "#FFFDF6" if THEME == "light" else "#242420"
INK = "#1A1A17" if THEME == "light" else "#F0EFE8"
INK_SOFT = "#4A4A44" if THEME == "light" else "#B8B7B0"
LAND_COLOR = "#D8D3BB" if THEME == "light" else "#2A2A25"
OCEAN_BG = "#C5D8E8" if THEME == "light" else "#19242E"
COAST_COLOR = "#888880" if THEME == "light" else "#666660"

# Data - Simulated North Atlantic SST
np.random.seed(42)
lat_range = np.linspace(30, 60, 60)
lon_range = np.linspace(-60, 0, 60)
lon_grid, lat_grid = np.meshgrid(lon_range, lat_range)

base_temp = 20 - 0.5 * (lat_grid - 30)
gulf_stream = 3 * np.exp(-((lon_grid + 30) ** 2) / 400)
variation = 2 * np.sin(lat_grid / 5) * np.cos(lon_grid / 8)
temperature = base_temp + gulf_stream + variation

T_MIN, T_MAX = 4, 24
levels = np.arange(T_MIN, T_MAX + 1, 2)

# Viridis colormap — perceptually-uniform, spec-compliant for sequential temperature data
norm = mcolors.Normalize(vmin=T_MIN, vmax=T_MAX)
cmap = plt.get_cmap("viridis")

# Compute contour paths using matplotlib off-screen (allsegs API, matplotlib 3.8+)
_fig, _ax = plt.subplots()
cs_fill = _ax.contourf(lon_range, lat_range, temperature, levels=levels, cmap=cmap, norm=norm)
cs_line = _ax.contour(lon_range, lat_range, temperature, levels=levels)
plt.close("all")

fig = go.Figure()

# Filled contour patches on the geographic map.
# Plotly's fill='toself' fills the interior for polygons whose top edge touches
# lat=60 (the data domain top), but fills the exterior for all other polygons.
# Reversing the vertex order for non-top-touching polygons corrects the winding.
for i, segs in enumerate(cs_fill.allsegs):
    mid_val = (levels[i] + levels[i + 1]) / 2
    r, g, b, _ = cmap(norm(mid_val))
    fill_color = f"rgba({int(r * 255)},{int(g * 255)},{int(b * 255)},0.85)"
    for seg in segs:
        if len(seg) < 3:
            continue
        seg = seg[::-1] if seg[:, 1].max() < 59.9 else seg
        fig.add_trace(
            go.Scattergeo(
                lon=seg[:, 0].tolist(),
                lat=seg[:, 1].tolist(),
                mode="lines",
                fill="toself",
                fillcolor=fill_color,
                line=dict(width=0),
                showlegend=False,
                hoverinfo="skip",
            )
        )

# Contour isolines as Scattergeo line traces
for i, segs in enumerate(cs_line.allsegs):
    level_val = float(cs_line.levels[i])
    for seg in segs:
        if len(seg) < 2:
            continue
        fig.add_trace(
            go.Scattergeo(
                lon=seg[:, 0].tolist(),
                lat=seg[:, 1].tolist(),
                mode="lines",
                line=dict(width=1, color=INK_SOFT),
                showlegend=False,
                hovertemplate=f"{level_val:.0f}°C<extra></extra>",
            )
        )

# Isoline value labels at midpoints of selected levels (every 4°C)
label_levels = {8.0, 12.0, 16.0, 20.0}
for i, segs in enumerate(cs_line.allsegs):
    level_val = float(cs_line.levels[i])
    if level_val not in label_levels:
        continue
    for seg in segs:
        if len(seg) < 10:
            continue
        mid = len(seg) // 2
        fig.add_trace(
            go.Scattergeo(
                lon=[float(seg[mid, 0])],
                lat=[float(seg[mid, 1])],
                mode="text",
                text=[f"{level_val:.0f}°C"],
                textfont=dict(size=9, color=INK),
                showlegend=False,
                hoverinfo="skip",
            )
        )

# Dummy trace for standalone colorbar
fig.add_trace(
    go.Scattergeo(
        lon=[None],
        lat=[None],
        mode="markers",
        marker=dict(
            color=[0],
            colorscale="viridis",
            cmin=T_MIN,
            cmax=T_MAX,
            showscale=True,
            colorbar=dict(
                title=dict(text="Temperature (°C)", font=dict(size=12, color=INK)),
                tickfont=dict(size=10, color=INK_SOFT),
                len=0.75,
                thickness=20,
                bgcolor=ELEVATED_BG,
                bordercolor=INK_SOFT,
                borderwidth=1,
                x=1.0,
            ),
        ),
        showlegend=False,
    )
)

# Native Plotly geographic basemap with Natural Earth coastlines and borders
fig.update_geos(
    projection_type="mercator",
    lataxis_range=[27, 63],
    lonaxis_range=[-64, 4],
    showcoastlines=True,
    coastlinecolor=COAST_COLOR,
    coastlinewidth=1.5,
    showland=True,
    landcolor=LAND_COLOR,
    showocean=True,
    oceancolor=OCEAN_BG,
    showlakes=True,
    lakecolor=OCEAN_BG,
    showcountries=True,
    countrycolor=COAST_COLOR,
    countrywidth=0.5,
    bgcolor=OCEAN_BG,
    showframe=True,
    framecolor=INK_SOFT,
    framewidth=1,
)

fig.update_layout(
    autosize=False,
    paper_bgcolor=PAGE_BG,
    title=dict(
        text="North Atlantic SST · contour-map-geographic · python · plotly · anyplot.ai",
        font=dict(size=16, color=INK),
        x=0.5,
        xanchor="center",
    ),
    font=dict(color=INK),
    margin=dict(l=40, r=120, t=80, b=40),
    annotations=[
        dict(
            x=0.12,
            y=0.72,
            text="Newfoundland",
            showarrow=False,
            font=dict(size=10, color=INK_SOFT),
            xref="paper",
            yref="paper",
        ),
        dict(
            x=0.85,
            y=0.68,
            text="Ireland",
            showarrow=False,
            font=dict(size=10, color=INK_SOFT),
            xref="paper",
            yref="paper",
        ),
        dict(
            x=0.60,
            y=0.20,
            text="Azores",
            showarrow=False,
            font=dict(size=10, color=INK_SOFT),
            xref="paper",
            yref="paper",
        ),
    ],
)

fig.write_image(f"plot-{THEME}.png", width=800, height=450, scale=4)
fig.write_html(f"plot-{THEME}.html", include_plotlyjs="cdn")
Runnable source as JSON, for any HTTP client: https://api.anyplot.ai/specs/contour-map-geographic/plotly/code. Any spec id and library id listed in llms-full.txt fit the same URL shape; every URL below is complete and callable.
{
  "spec_id": "contour-map-geographic",
  "language": "python",
  "library": "plotly",
  "page": "https://anyplot.ai/contour-map-geographic/python/plotly",
  "hub": "https://anyplot.ai/contour-map-geographic",
  "code_json": "https://api.anyplot.ai/specs/contour-map-geographic/plotly/code",
  "spec_json": "https://api.anyplot.ai/specs/contour-map-geographic",
  "render_light_png": "https://storage.googleapis.com/anyplot-images/plots/contour-map-geographic/python/plotly/plot-light.png",
  "render_dark_png": "https://storage.googleapis.com/anyplot-images/plots/contour-map-geographic/python/plotly/plot-dark.png",
  "interactive_light_html": "https://storage.googleapis.com/anyplot-images/plots/contour-map-geographic/python/plotly/plot-light.html",
  "interactive_dark_html": "https://storage.googleapis.com/anyplot-images/plots/contour-map-geographic/python/plotly/plot-dark.html",
  "quality_score": 84.0,
  "license": "MIT",
  "guide": "https://anyplot.ai/llms.txt"
}
Part of Contour Lines on Geographic Map on anyplot.ai.