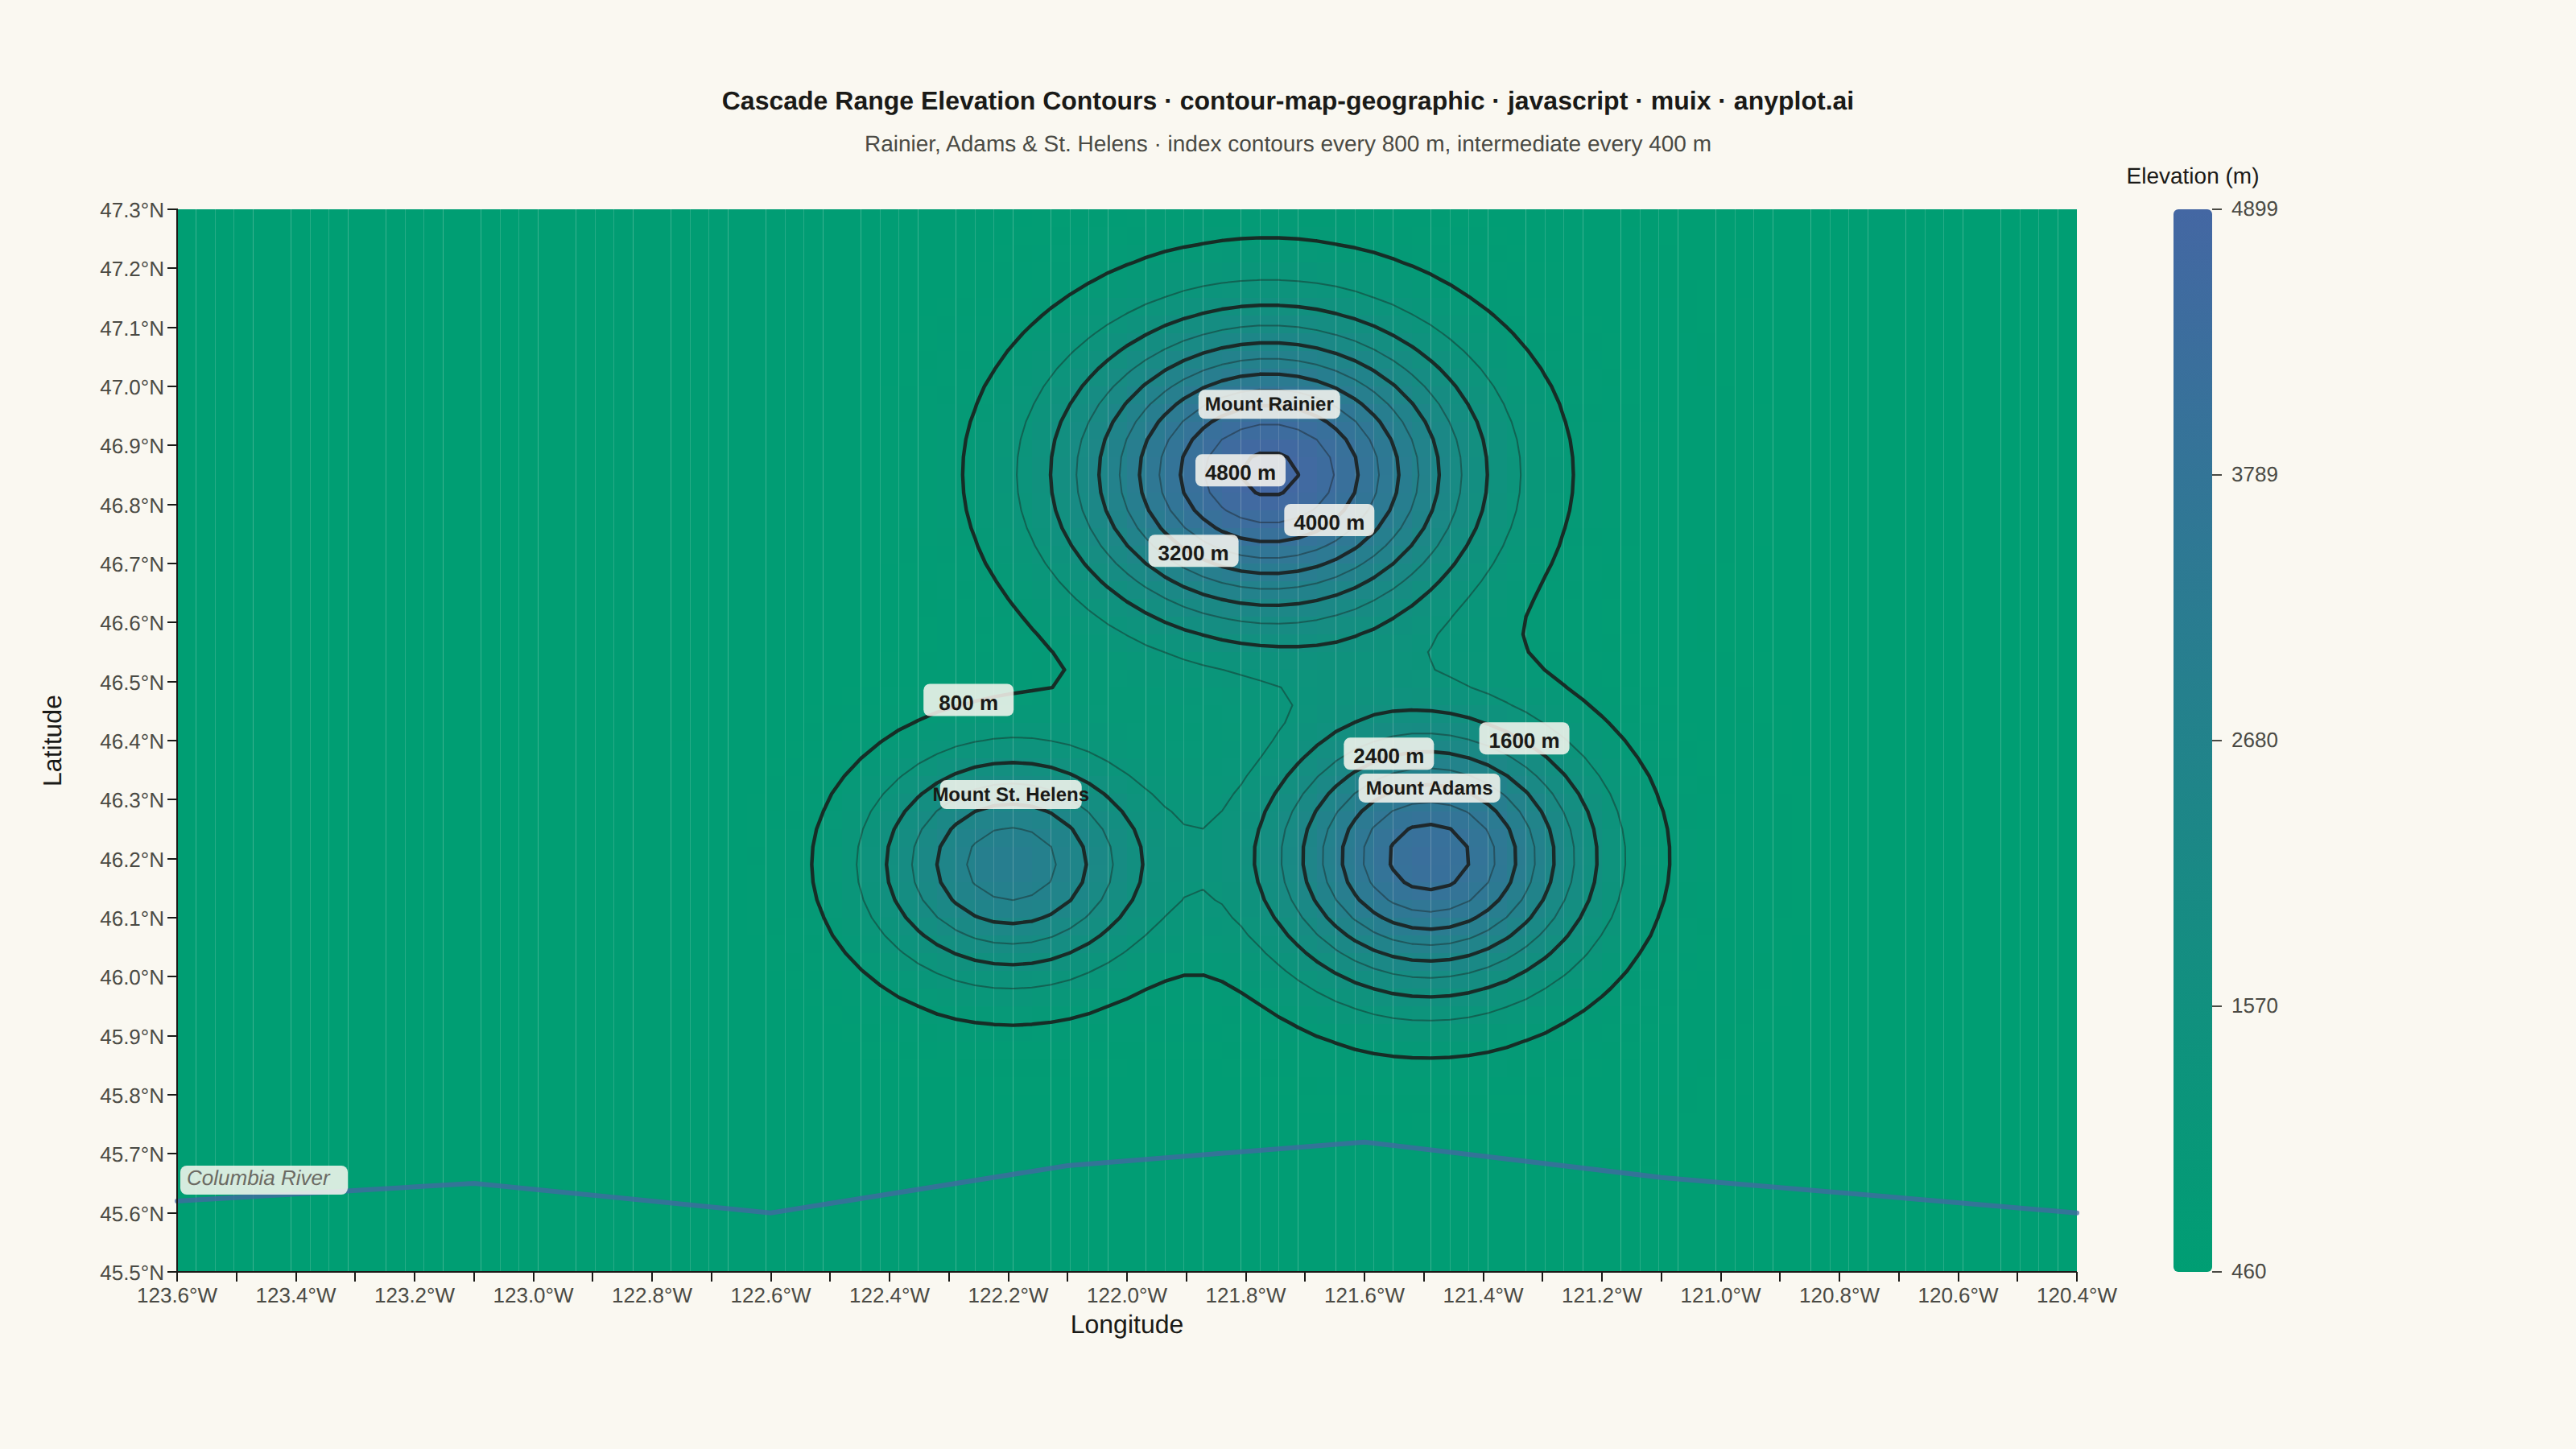
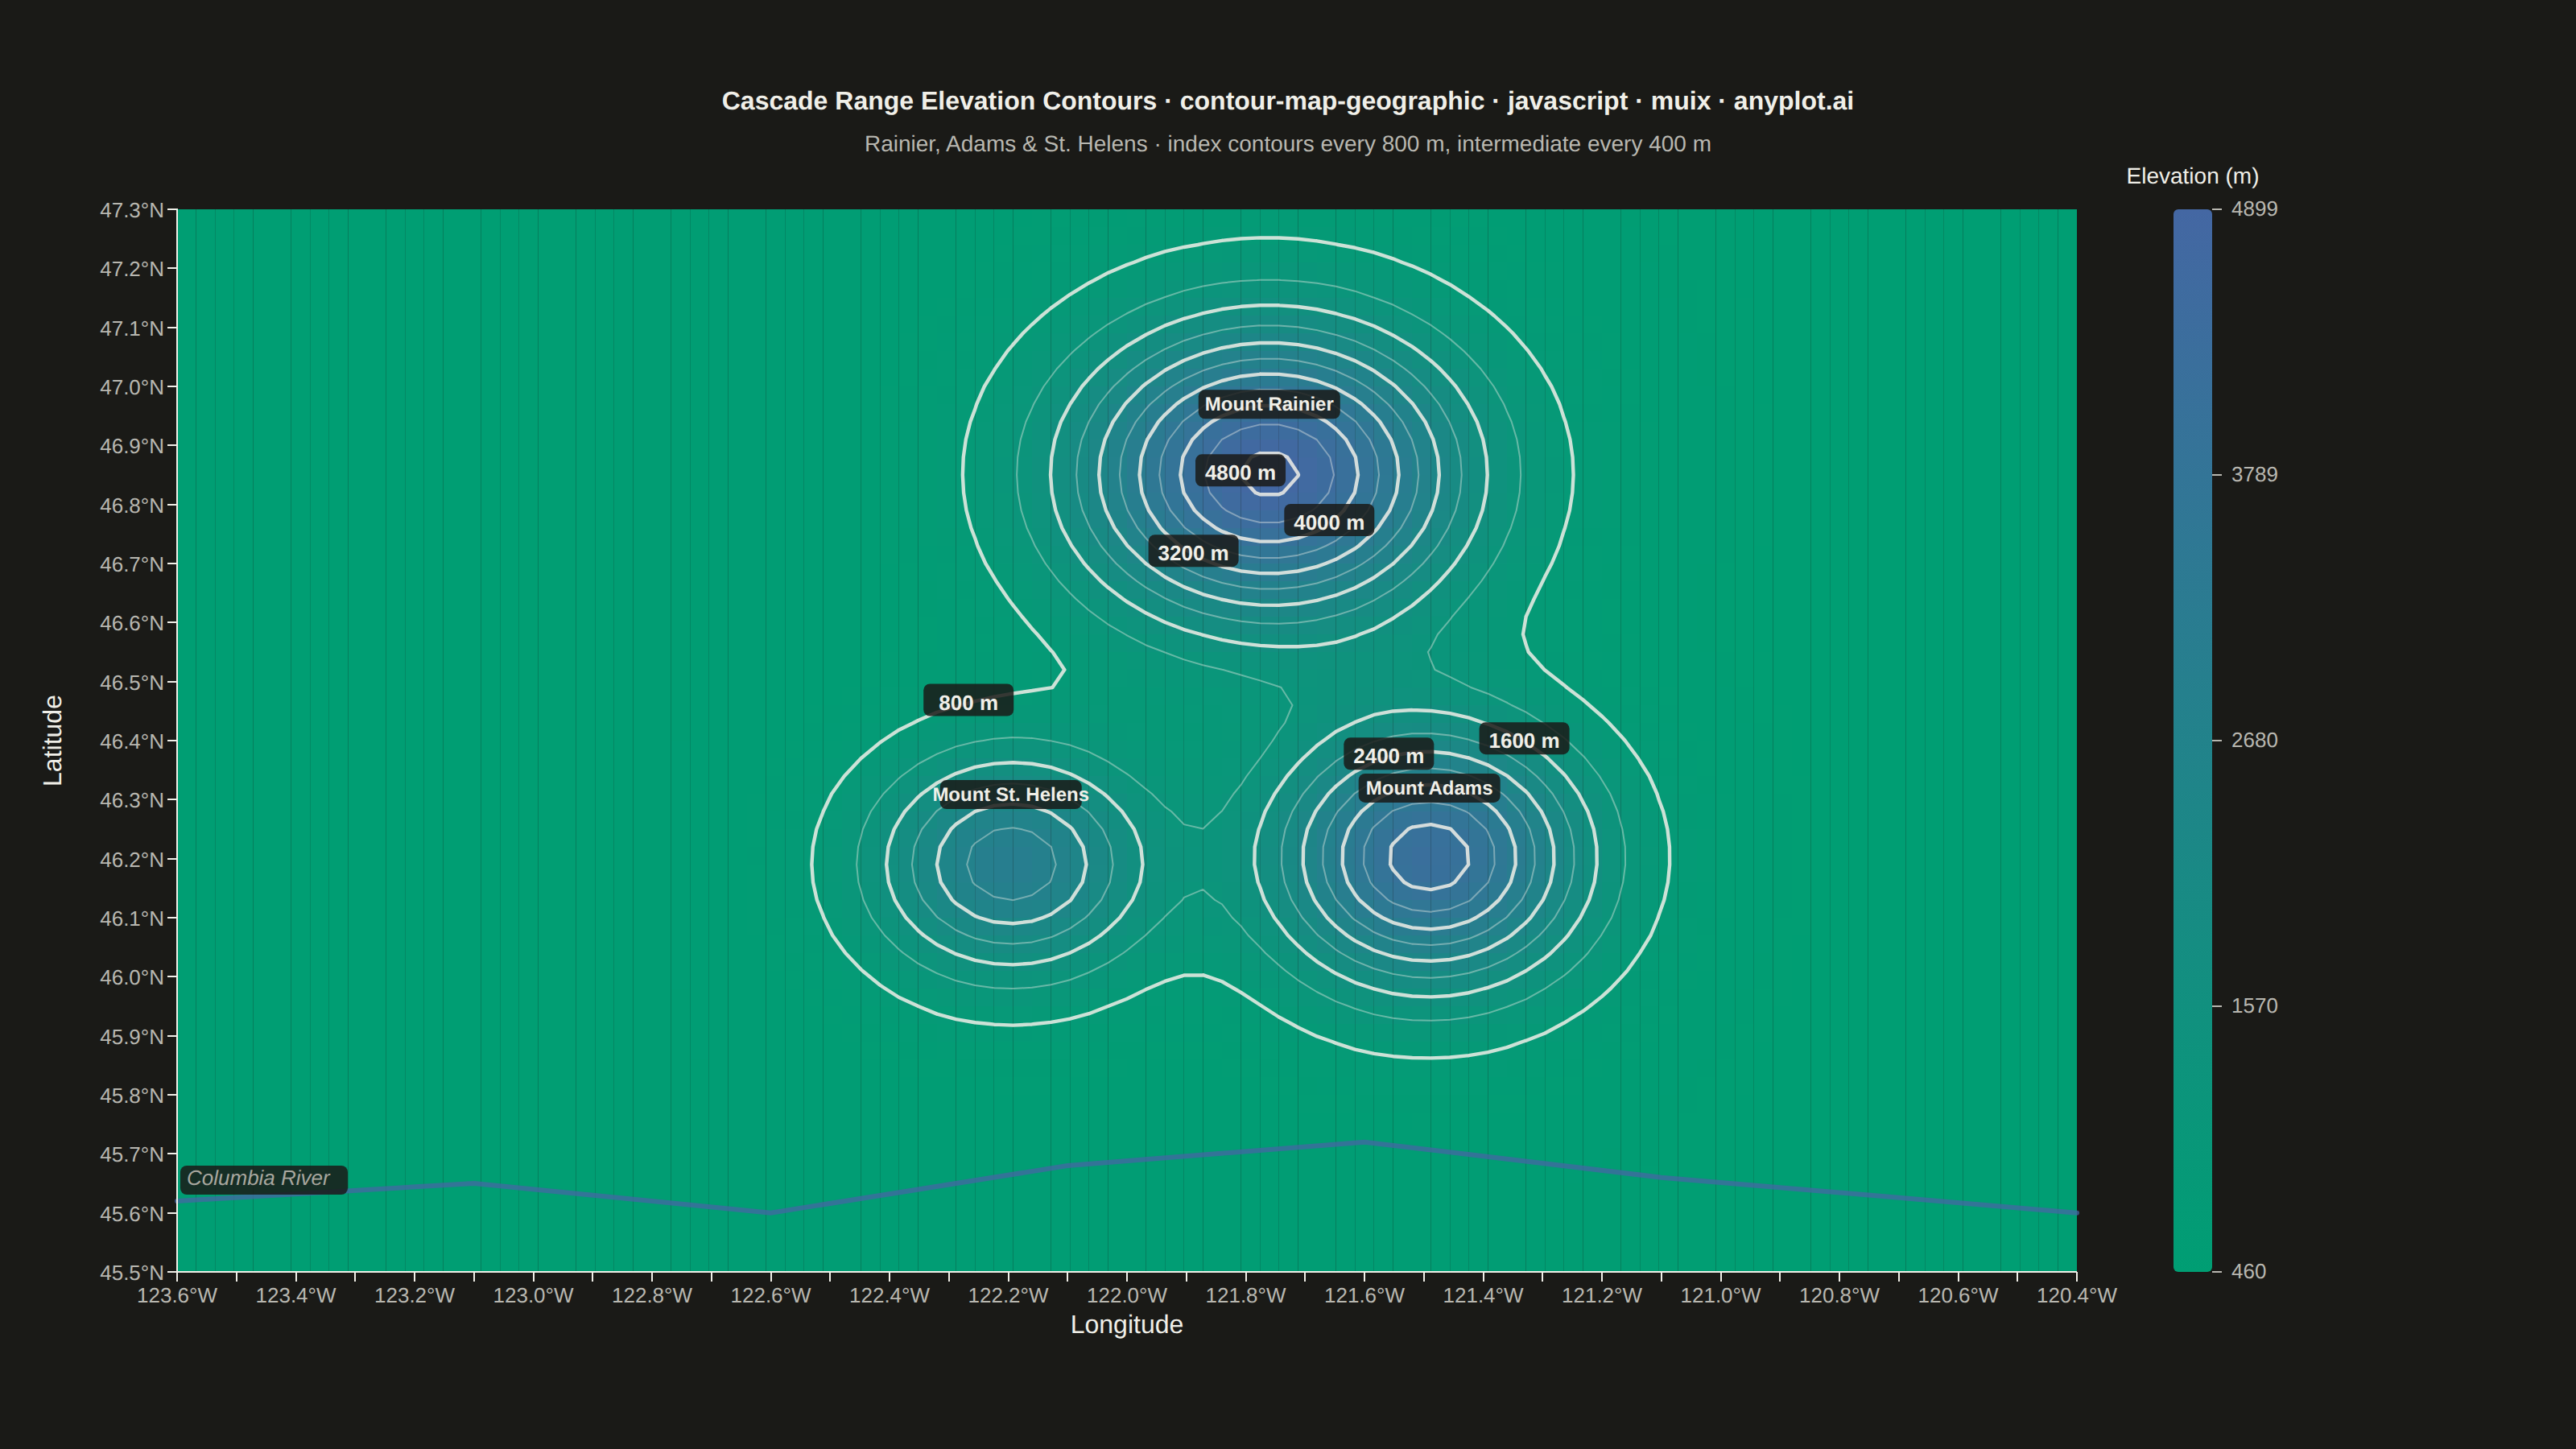
The same plot in 14 other libraries — JavaScript: Chart.js, D3.js, Apache ECharts, Highcharts; Python: Altair, Bokeh, lets-plot, Matplotlib, Plotly, plotnine, Pygal, Seaborn; R: ggplot2; Julia: Makie.jl. Compare all 15 side by side: Contour Lines on Geographic Map in Python, R, Julia and JavaScript.
A contour map overlays isolines (lines of equal value) onto a geographic basemap, visualizing continuous spatial data such as elevation, temperature, or atmospheric pressure across real-world coordinates. Unlike basic contour plots that use abstract x/y coordinates, this plot anchors contours to latitude/longitude positions with geographic context like coastlines, borders, or terrain. It combines the precision of isoline visualization with spatial awareness, making it ideal for meteorological, topographic, and environmental applications.
// anyplot.ai
// contour-map-geographic: Contour Lines on Geographic Map
// Library: muix 7.29.1 | JavaScript 22.23.2
// Quality: 89/100 | Updated: 2026-09-02
import { ChartContainer } from "@mui/x-charts/ChartContainer";
import { ChartsXAxis } from "@mui/x-charts/ChartsXAxis";
import { ChartsYAxis } from "@mui/x-charts/ChartsYAxis";
import { useDrawingArea } from "@mui/x-charts/hooks";
const t = window.ANYPLOT_TOKENS;
const { width, height } = window.ANYPLOT_SIZE;
const THEME = window.ANYPLOT_THEME || "light";
const INK_MUTED = THEME === "light" ? "#6B6A63" : "#A8A79F";
// --- Geographic domain: south-central Washington Cascades, home to three
// well-known stratovolcanoes (lon/lat grid, WGS84 degrees) --------------------
const LON_MIN = -123.6;
const LON_MAX = -120.4;
const LAT_MIN = 45.5;
const LAT_MAX = 47.3;
// Grid resolution: fine enough that marching-squares rounds out the tight
// peak sigmas (~0.13-0.22 deg) into smooth isolines instead of faceting into
// visible hexagons near the summits, and dense enough that adjacent raster
// cells blend without visible seams.
const NLON = 101;
const NLAT = 61;
const LONS = Array.from(
{ length: NLON },
(_, i) => LON_MIN + (i * (LON_MAX - LON_MIN)) / (NLON - 1),
);
const LATS = Array.from(
{ length: NLAT },
(_, j) => LAT_MIN + (j * (LAT_MAX - LAT_MIN)) / (NLAT - 1),
);
// Synthetic elevation field: a gently rising foothill baseline plus three
// Gaussian peaks anchored at the real summit coordinates. Deterministic —
// no RNG needed for a smooth terrain surface.
const PEAKS = [
{ lon: -121.7603, lat: 46.8523, height: 4392, sigmaLon: 0.22, sigmaLat: 0.17, name: "Mount Rainier" },
{ lon: -121.4906, lat: 46.2024, height: 3743, sigmaLon: 0.18, sigmaLat: 0.15, name: "Mount Adams" },
{ lon: -122.1956, lat: 46.1912, height: 2549, sigmaLon: 0.16, sigmaLat: 0.13, name: "Mount St. Helens" },
];
function elevationAt(lon: number, lat: number): number {
// Baseline stays above the lowest contour level (see CONTOUR_STEP below) so
// the flat lowlands render as unbroken fill instead of a stray low-value
// isoline running the full width of the map.
const baseline = 460 + 60 * Math.sin(((lon - LON_MIN) / (LON_MAX - LON_MIN)) * Math.PI);
let elevation = baseline;
for (const p of PEAKS) {
const dLon = lon - p.lon;
const dLat = lat - p.lat;
elevation +=
p.height *
Math.exp(-((dLon * dLon) / (2 * p.sigmaLon * p.sigmaLon) + (dLat * dLat) / (2 * p.sigmaLat * p.sigmaLat)));
}
return elevation;
}
const GRID: number[][] = LATS.map((lat) => LONS.map((lon) => elevationAt(lon, lat)));
let MIN_ELEV = Infinity;
let MAX_ELEV = -Infinity;
for (const row of GRID) {
for (const v of row) {
if (v < MIN_ELEV) MIN_ELEV = v;
if (v > MAX_ELEV) MAX_ELEV = v;
}
}
// Meaningful contour interval for this elevation range: 400 m intermediate
// contours, with every other one (800 m) drawn heavier and labeled — the
// classic topographic-map "index contour" convention.
const CONTOUR_STEP = 400;
const INDEX_STEP = 800;
const LEVELS: number[] = [];
for (let lvl = Math.ceil(MIN_ELEV / CONTOUR_STEP) * CONTOUR_STEP; lvl <= MAX_ELEV; lvl += CONTOUR_STEP) {
LEVELS.push(lvl);
}
// --- Marching squares: extract isoline segments (in lon/lat space) for one
// contour level. Ambiguous 4-crossing (saddle) cells are resolved by
// comparing the cell's mean value against the level. -------------------------
type Point = [number, number];
type Segment = [Point, Point];
function marchingSquares(grid: number[][], lons: number[], lats: number[], level: number): Segment[] {
const segments: Segment[] = [];
const nLat = grid.length;
const nLon = grid[0].length;
for (let j = 0; j < nLat - 1; j++) {
for (let i = 0; i < nLon - 1; i++) {
const tl = grid[j][i];
const tr = grid[j][i + 1];
const bl = grid[j + 1][i];
const br = grid[j + 1][i + 1];
const x0 = lons[i];
const x1 = lons[i + 1];
const y0 = lats[j];
const y1 = lats[j + 1];
const edges: { v0: number; v1: number; p0: Point; p1: Point }[] = [
{ v0: tl, v1: tr, p0: [x0, y0], p1: [x1, y0] }, // top
{ v0: tr, v1: br, p0: [x1, y0], p1: [x1, y1] }, // right
{ v0: bl, v1: br, p0: [x0, y1], p1: [x1, y1] }, // bottom
{ v0: tl, v1: bl, p0: [x0, y0], p1: [x0, y1] }, // left
];
const crossings: Point[] = [];
for (const e of edges) {
if ((e.v0 - level) * (e.v1 - level) < 0) {
const frac = (level - e.v0) / (e.v1 - e.v0);
crossings.push([e.p0[0] + frac * (e.p1[0] - e.p0[0]), e.p0[1] + frac * (e.p1[1] - e.p0[1])]);
}
}
if (crossings.length === 2) {
segments.push([crossings[0], crossings[1]]);
} else if (crossings.length === 4) {
const meanValue = (tl + tr + bl + br) / 4;
// crossings order here is [top, right, bottom, left]
if (meanValue >= level) {
segments.push([crossings[0], crossings[3]]);
segments.push([crossings[1], crossings[2]]);
} else {
segments.push([crossings[0], crossings[1]]);
segments.push([crossings[2], crossings[3]]);
}
}
}
}
return segments;
}
const CONTOURS = LEVELS.map((level) => ({
level,
segments: marchingSquares(GRID, LONS, LATS, level),
}));
// --- Imprint sequential colormap for the filled raster (single-polarity data:
// elevation only rises above the baseline) ------------------------------------
function hexRgb(hex: string): [number, number, number] {
return [parseInt(hex.slice(1, 3), 16), parseInt(hex.slice(3, 5), 16), parseInt(hex.slice(5, 7), 16)];
}
const SEQ_LOW = hexRgb(t.seq[0]);
const SEQ_HIGH = hexRgb(t.seq[1]);
function elevationColor(value: number): string {
const frac = Math.max(0, Math.min(1, (value - MIN_ELEV) / (MAX_ELEV - MIN_ELEV)));
const r = Math.round(SEQ_LOW[0] + (SEQ_HIGH[0] - SEQ_LOW[0]) * frac);
const g = Math.round(SEQ_LOW[1] + (SEQ_HIGH[1] - SEQ_LOW[1]) * frac);
const b = Math.round(SEQ_LOW[2] + (SEQ_HIGH[2] - SEQ_LOW[2]) * frac);
return `rgb(${r},${g},${b})`;
}
const CELLS = [];
for (let j = 0; j < NLAT - 1; j++) {
for (let i = 0; i < NLON - 1; i++) {
const mean = (GRID[j][i] + GRID[j][i + 1] + GRID[j + 1][i] + GRID[j + 1][i + 1]) / 4;
CELLS.push({
lonMin: LONS[i],
lonMax: LONS[i + 1],
latMin: LATS[j],
latMax: LATS[j + 1],
color: elevationColor(mean),
});
}
}
// The Columbia River forms the domain's southern geographic anchor — a real
// hydrological feature, hand-traced as a gently meandering polyline.
const RIVER: Point[] = [
[-123.6, 45.62],
[-123.1, 45.65],
[-122.6, 45.6],
[-122.1, 45.68],
[-121.6, 45.72],
[-121.1, 45.66],
[-120.4, 45.6],
];
const TITLE_STR = "Cascade Range Elevation Contours · contour-map-geographic · javascript · muix · anyplot.ai";
const TITLE_FONT_SIZE = Math.max(15, Math.round(22 * Math.min(1, 67 / TITLE_STR.length)));
const MARGIN = { top: 130, right: 310, bottom: 110, left: 110 };
// --- Filled elevation raster + isolines, positioned via the drawing area's
// own pixel rectangle so lon/lat map exactly onto the axes below. ------------
function ContourLayer() {
const { left, top, width: areaW, height: areaH } = useDrawingArea();
const xOf = (lon: number) => left + ((lon - LON_MIN) / (LON_MAX - LON_MIN)) * areaW;
const yOf = (lat: number) => top + (1 - (lat - LAT_MIN) / (LAT_MAX - LAT_MIN)) * areaH;
// Peak-name pills sit in a fixed box directly above each summit. Index-
// contour labels default to the ring's middle segment (as before), but if
// that spot falls inside a peak-name pill, we scan outward along the ring
// for the nearest segment that clears every pill instead.
const peakLabelBoxes = PEAKS.map((p) => {
const cx = xOf(p.lon);
const cy = yOf(p.lat);
return { x0: cx - 44, x1: cx + 44, y0: cy - 52, y1: cy - 34 };
});
const clearsPeakLabels = (mx: number, my: number) =>
peakLabelBoxes.every((b) => mx + 28 < b.x0 || mx - 28 > b.x1 || my + 10 < b.y0 || my - 10 > b.y1);
const pickLabelSegment = (segments: Segment[]): Segment => {
const mid = Math.floor(segments.length / 2);
for (let d = 0; d < segments.length; d++) {
for (const idx of d === 0 ? [mid] : [mid + d, mid - d]) {
if (idx < 0 || idx >= segments.length) continue;
const seg = segments[idx];
const mx = (xOf(seg[0][0]) + xOf(seg[1][0])) / 2;
const my = (yOf(seg[0][1]) + yOf(seg[1][1])) / 2;
if (clearsPeakLabels(mx, my)) return seg;
}
}
return segments[mid];
};
return (
<g>
{CELLS.map((cell, idx) => (
<rect
key={idx}
x={xOf(cell.lonMin)}
y={yOf(cell.latMax)}
width={xOf(cell.lonMax) - xOf(cell.lonMin)}
height={yOf(cell.latMin) - yOf(cell.latMax)}
fill={cell.color}
stroke="none"
/>
))}
{CONTOURS.map(({ level, segments }) => {
const isIndex = level % INDEX_STEP === 0;
const d = segments
.map(([[lon0, lat0], [lon1, lat1]]) => `M${xOf(lon0)},${yOf(lat0)} L${xOf(lon1)},${yOf(lat1)}`)
.join(" ");
return (
<path
key={level}
d={d}
fill="none"
stroke={t.ink}
strokeWidth={isIndex ? 2.2 : 1}
strokeOpacity={isIndex ? 0.85 : 0.4}
strokeLinecap="round"
/>
);
})}
{CONTOURS.filter(({ level }) => level % INDEX_STEP === 0 && level > MIN_ELEV).map(({ level, segments }) => {
if (segments.length === 0) return null;
const [[lon0, lat0], [lon1, lat1]] = pickLabelSegment(segments);
const cx = (xOf(lon0) + xOf(lon1)) / 2;
const cy = (yOf(lat0) + yOf(lat1)) / 2;
return (
<g key={`label-${level}`}>
<rect x={cx - 28} y={cy - 12} width={56} height={20} rx={4} fill={t.pageBg} opacity={0.85} />
<text x={cx} y={cy + 4} textAnchor="middle" fontSize={13} fontWeight={600} fill={t.ink}>
{level} m
</text>
</g>
);
})}
<polyline
points={RIVER.map(([lon, lat]) => `${xOf(lon)},${yOf(lat)}`).join(" ")}
fill="none"
stroke={t.palette[2]}
strokeWidth={3}
strokeLinecap="round"
strokeOpacity={0.75}
/>
<g>
<rect x={xOf(RIVER[0][0]) + 2} y={yOf(RIVER[0][1]) - 22} width={104} height={18} rx={4} fill={t.pageBg} opacity={0.85} />
<text
x={xOf(RIVER[0][0]) + 6}
y={yOf(RIVER[0][1]) - 10}
fontSize={13}
fontStyle="italic"
fill={INK_MUTED}
>
Columbia River
</text>
</g>
{PEAKS.map((p) => {
const cx = xOf(p.lon);
const cy = yOf(p.lat);
// Peak names sit well above the summit, clear of the tight innermost
// contour ring and its numeric label (which land right at the
// summit point for the tallest peaks) — no separate summit dot, to
// avoid colliding with that ring label.
return (
<g key={p.name}>
<rect x={cx - 44} y={cy - 52} width={88} height={18} rx={4} fill={t.pageBg} opacity={0.85} />
<text x={cx} y={cy - 39} textAnchor="middle" fontSize={12} fontWeight={600} fill={t.ink}>
{p.name}
</text>
</g>
);
})}
</g>
);
}
// --- Vertical colorbar legend for the continuous elevation field ------------
function Colorbar() {
const { left, top, width: areaW, height: areaH } = useDrawingArea();
const barX = left + areaW + 60;
const barW = 24;
const barTop = top;
const barBottom = top + areaH;
const ticks = [0, 0.25, 0.5, 0.75, 1];
return (
<g>
<defs>
<linearGradient id="elevationRamp" x1="0" y1="0" x2="0" y2="1">
<stop offset="0%" stopColor={t.seq[1]} />
<stop offset="100%" stopColor={t.seq[0]} />
</linearGradient>
</defs>
<text x={barX + barW / 2} y={barTop - 16} textAnchor="middle" fontSize={14} fill={t.ink}>
Elevation (m)
</text>
<rect x={barX} y={barTop} width={barW} height={barBottom - barTop} fill="url(#elevationRamp)" rx={3} />
{ticks.map((f) => {
const value = Math.round(MIN_ELEV + f * (MAX_ELEV - MIN_ELEV));
const y = barBottom - f * (barBottom - barTop);
return (
<g key={f}>
<line x1={barX + barW} y1={y} x2={barX + barW + 6} y2={y} stroke={t.inkSoft} strokeWidth={1} />
<text x={barX + barW + 12} y={y + 4} fontSize={13} fill={t.inkSoft}>
{value}
</text>
</g>
);
})}
</g>
);
}
function ChartTitle() {
const { top } = useDrawingArea();
return (
<>
<text x={width / 2} y={top - 62} textAnchor="middle" fontSize={TITLE_FONT_SIZE} fontWeight={600} fill={t.ink}>
{TITLE_STR}
</text>
<text x={width / 2} y={top - 36} textAnchor="middle" fontSize={14} fill={t.inkSoft}>
Rainier, Adams & St. Helens · index contours every {INDEX_STEP} m, intermediate every {CONTOUR_STEP} m
</text>
</>
);
}
export default function Chart() {
return (
<ChartContainer
width={width}
height={height}
series={[]}
skipAnimation
margin={MARGIN}
xAxis={[
{
scaleType: "linear",
min: LON_MIN,
max: LON_MAX,
label: "Longitude",
valueFormatter: (v: number) => `${Math.abs(v).toFixed(1)}°W`,
tickLabelStyle: { fontSize: 13, fill: t.inkSoft },
labelStyle: { fontSize: 16, fill: t.ink },
},
]}
yAxis={[
{
scaleType: "linear",
min: LAT_MIN,
max: LAT_MAX,
label: "Latitude",
valueFormatter: (v: number) => `${v.toFixed(1)}°N`,
// ChartsYAxis offsets the rotated axis label using this deprecated
// spacing prop (tickFontSize + tickSize + 10), not the actual
// rendered tick text width — bump it well past the true tick font
// size (set via tickLabelStyle below) so "46.4°N"-width labels
// don't collide with the axis title.
tickFontSize: 56,
tickLabelStyle: { fontSize: 13, fill: t.inkSoft },
labelStyle: { fontSize: 16, fill: t.ink },
},
]}
sx={{
"& .MuiChartsAxis-line": { stroke: t.inkSoft },
"& .MuiChartsAxis-tick": { stroke: t.inkSoft },
}}
>
<ChartTitle />
<ContourLayer />
<ChartsXAxis />
<ChartsYAxis />
<Colorbar />
</ChartContainer>
);
}
Runnable source as JSON, for any HTTP client: https://api.anyplot.ai/specs/contour-map-geographic/muix/code. Any spec id and library id listed in llms-full.txt fit the same URL shape; every URL below is complete and callable.
{
  "spec_id": "contour-map-geographic",
  "language": "javascript",
  "library": "muix",
  "page": "https://anyplot.ai/contour-map-geographic/javascript/muix",
  "hub": "https://anyplot.ai/contour-map-geographic",
  "code_json": "https://api.anyplot.ai/specs/contour-map-geographic/muix/code",
  "spec_json": "https://api.anyplot.ai/specs/contour-map-geographic",
  "render_light_png": "https://storage.googleapis.com/anyplot-images/plots/contour-map-geographic/javascript/muix/plot-light.png",
  "render_dark_png": "https://storage.googleapis.com/anyplot-images/plots/contour-map-geographic/javascript/muix/plot-dark.png",
  "interactive_light_html": "https://storage.googleapis.com/anyplot-images/plots/contour-map-geographic/javascript/muix/plot-light.html",
  "interactive_dark_html": "https://storage.googleapis.com/anyplot-images/plots/contour-map-geographic/javascript/muix/plot-dark.html",
  "quality_score": 89.0,
  "license": "MIT",
  "guide": "https://anyplot.ai/llms.txt"
}
Part of Contour Lines on Geographic Map on anyplot.ai.