The same plot in 14 other libraries — Python: Altair, Bokeh, lets-plot, Matplotlib, Plotly, Pygal, Seaborn; R: ggplot2; Julia: Makie.jl; JavaScript: Chart.js, D3.js, Apache ECharts, Highcharts, MUI X Charts. Compare all 15 side by side: Contour Lines on Geographic Map in Python, R, Julia and JavaScript.
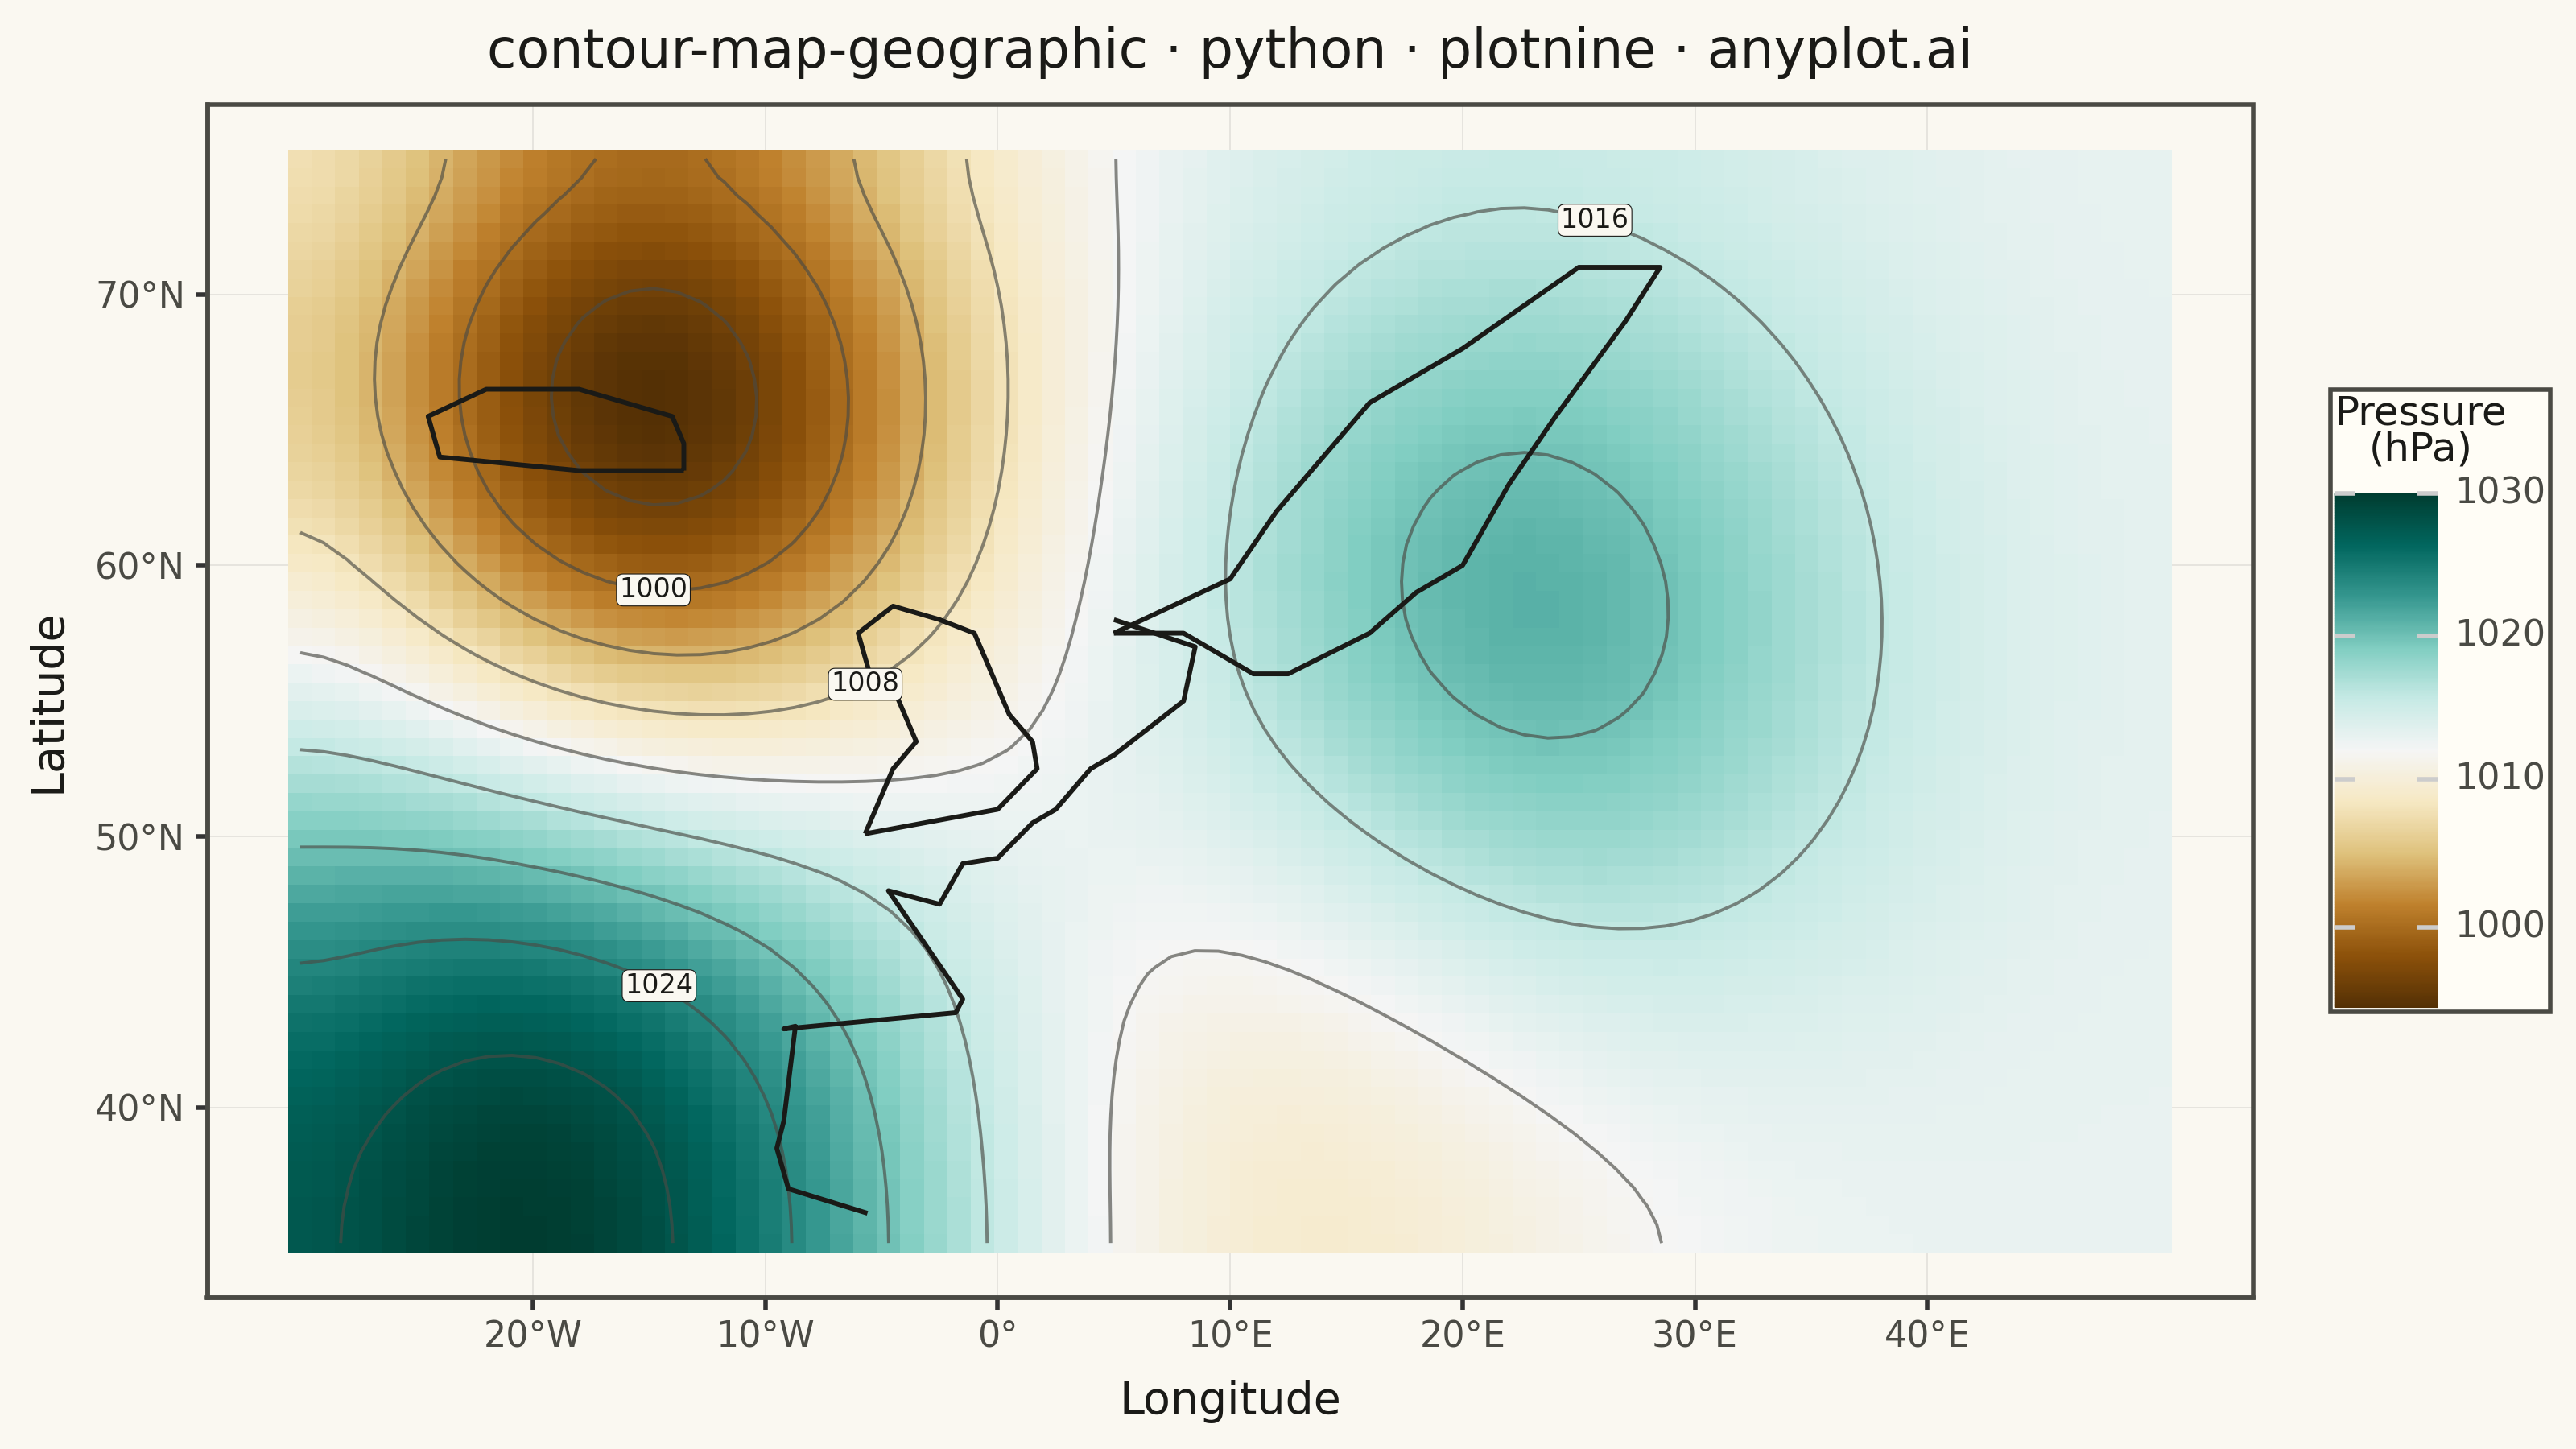
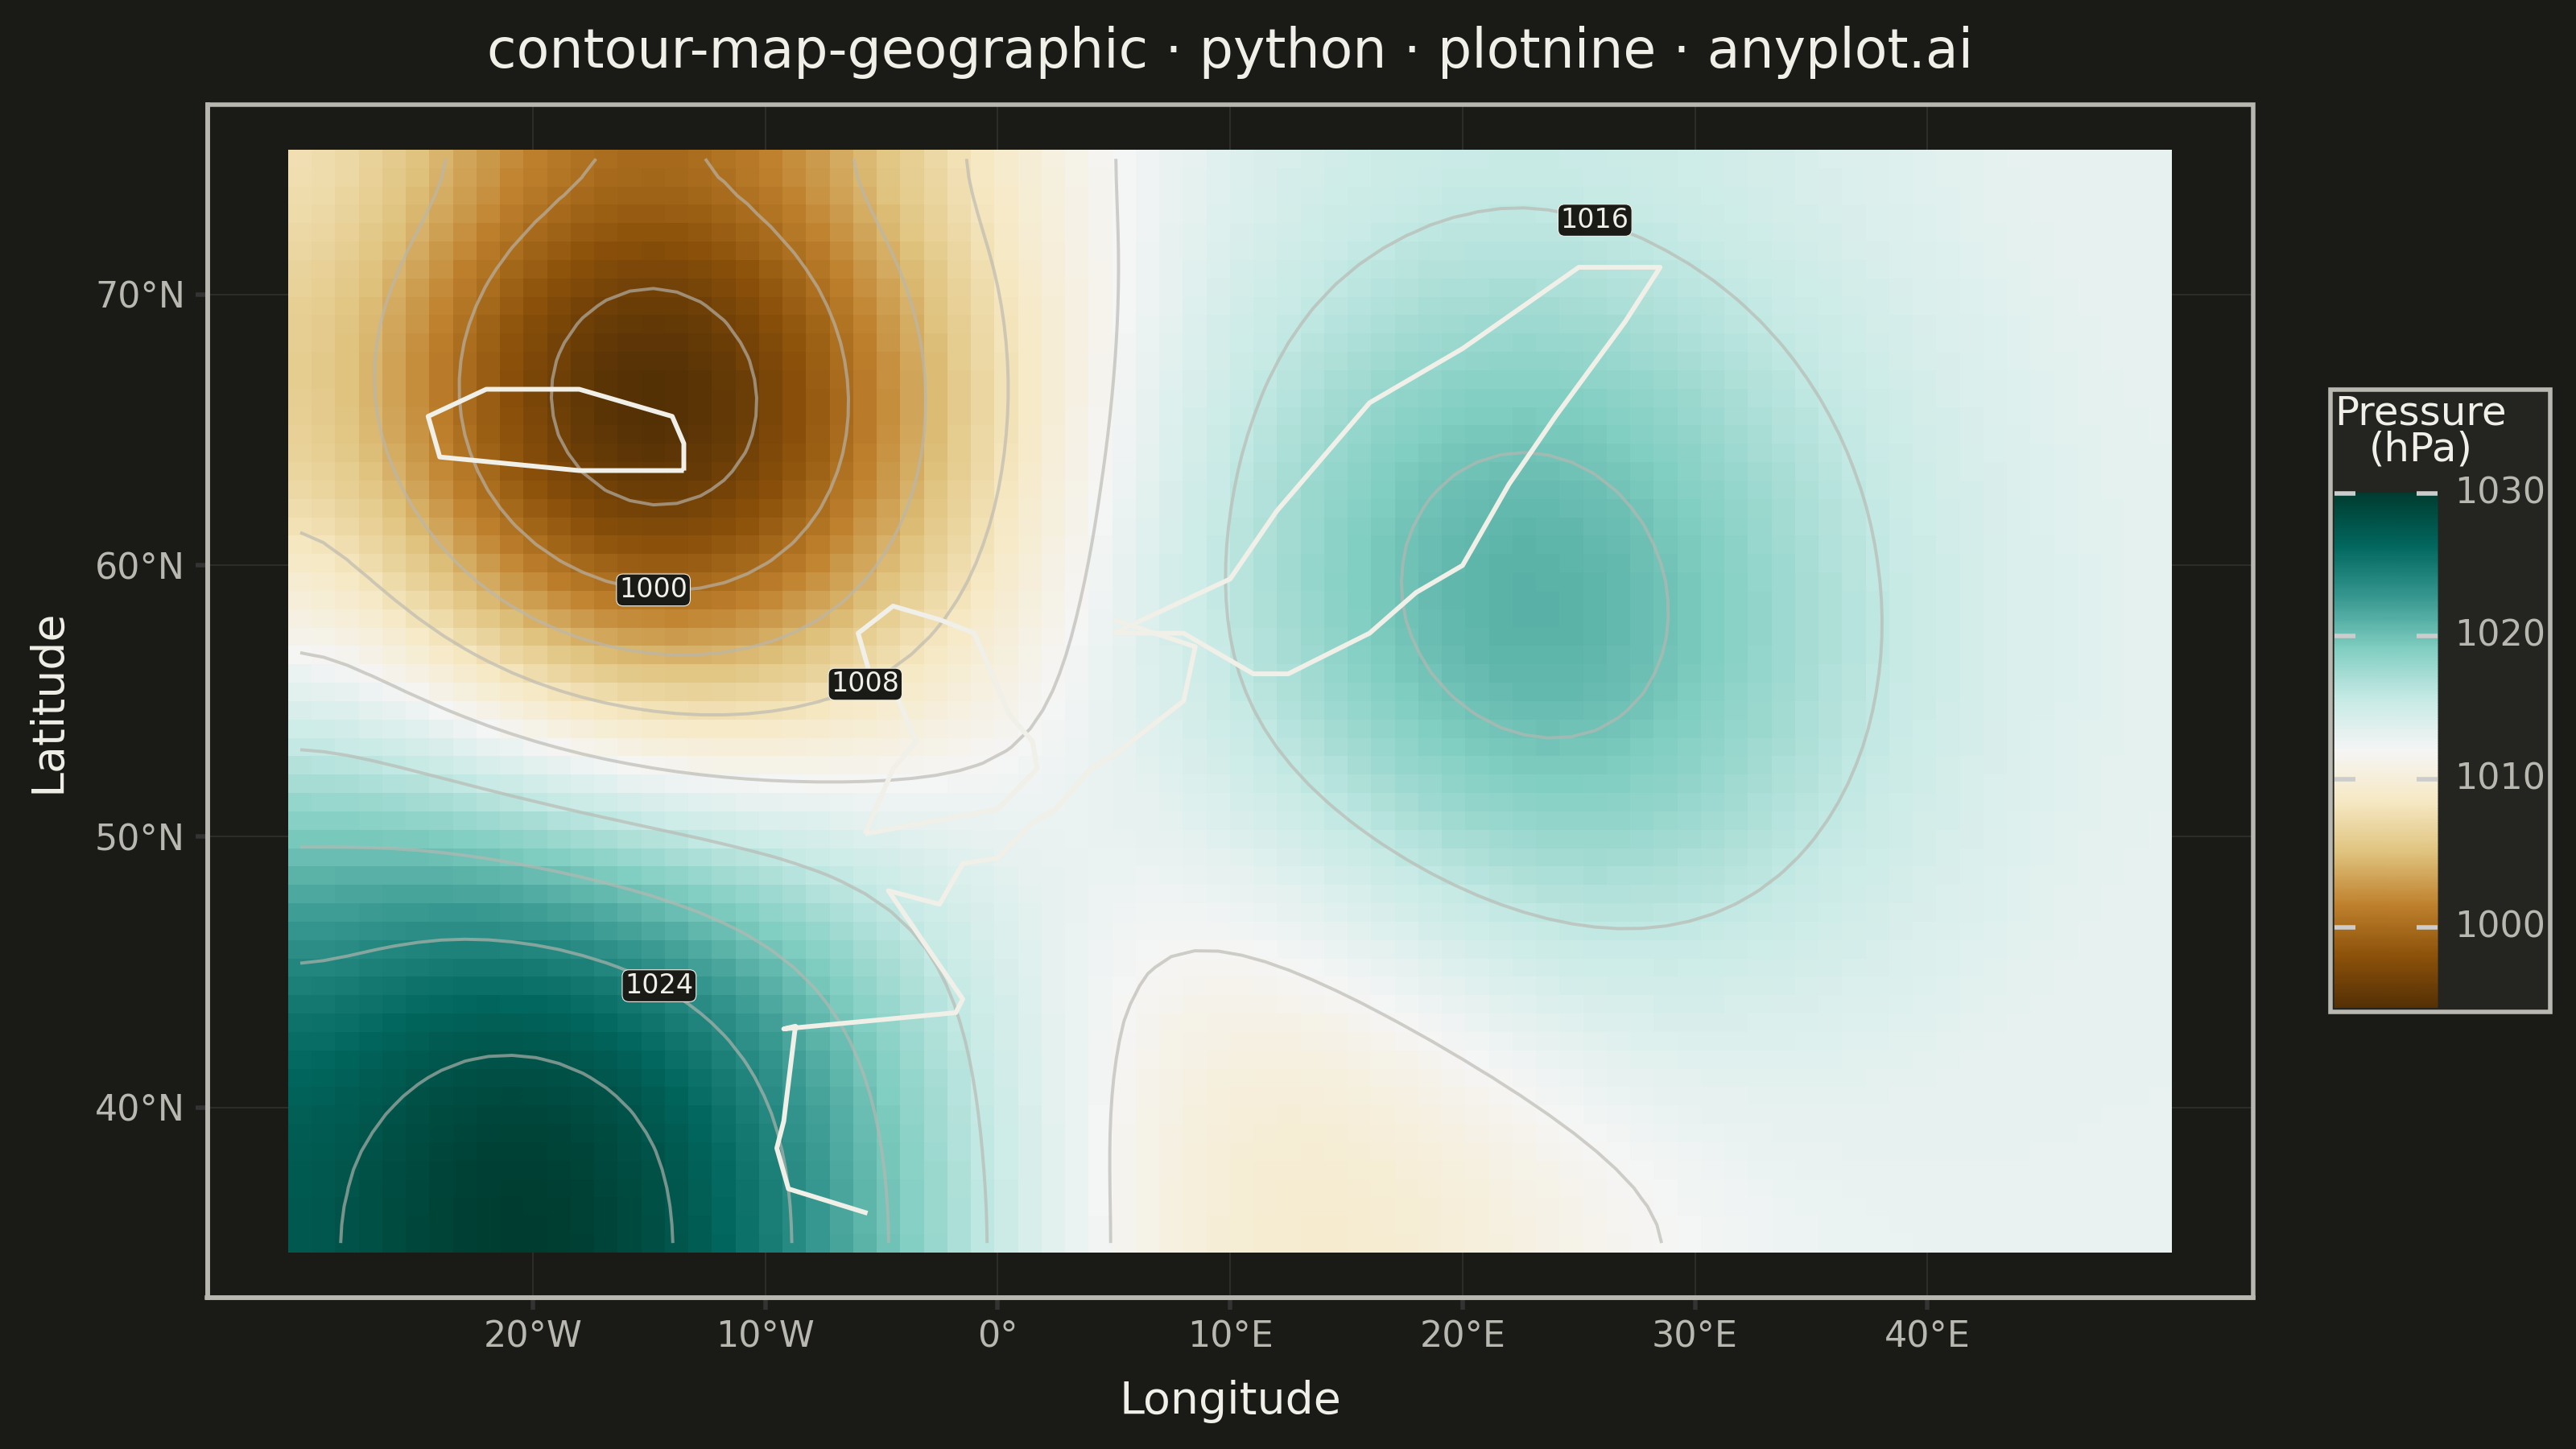
A contour map overlays isolines (lines of equal value) onto a geographic basemap, visualizing continuous spatial data such as elevation, temperature, or atmospheric pressure across real-world coordinates. Unlike basic contour plots that use abstract x/y coordinates, this plot anchors contours to latitude/longitude positions with geographic context like coastlines, borders, or terrain. It combines the precision of isoline visualization with spatial awareness, making it ideal for meteorological, topographic, and environmental applications.
""" anyplot.ai
contour-map-geographic: Contour Lines on Geographic Map
Library: plotnine 0.15.4 | Python 3.13.13
Quality: 88/100 | Created: 2026-05-20
"""

import os
import sys


# Remove script directory so "import plotnine" resolves to the library, not this file
_sd = os.path.abspath(os.path.dirname(__file__))
sys.path = [p for p in sys.path if os.path.abspath(p) != _sd]

import matplotlib


matplotlib.use("Agg")

import numpy as np
import pandas as pd
from contourpy import contour_generator
from plotnine import (
    aes,
    coord_cartesian,
    element_blank,
    element_line,
    element_rect,
    element_text,
    geom_label,
    geom_path,
    geom_raster,
    ggplot,
    labs,
    scale_fill_cmap,
    scale_x_continuous,
    scale_y_continuous,
    theme,
)
from scipy.ndimage import gaussian_filter


THEME = os.getenv("ANYPLOT_THEME", "light")
PAGE_BG = "#FAF8F1" if THEME == "light" else "#1A1A17"
ELEVATED_BG = "#FFFDF6" if THEME == "light" else "#242420"
INK = "#1A1A17" if THEME == "light" else "#F0EFE8"
INK_SOFT = "#4A4A44" if THEME == "light" else "#B8B7B0"

# Synthetic atmospheric pressure (hPa) over North Atlantic / Europe
np.random.seed(42)
lon_vec = np.linspace(-30, 50, 80)
lat_vec = np.linspace(35, 75, 60)
lon_grid, lat_grid = np.meshgrid(lon_vec, lat_vec)

base = 1013.0
# Azores High — subtropical anticyclone
pressure = base + 18 * np.exp(-((lon_grid + 20) ** 2 + (lat_grid - 37) ** 2) / 350)
# Icelandic Low — subpolar cyclone
pressure -= 22 * np.exp(-((lon_grid + 15) ** 2 + (lat_grid - 65) ** 2) / 180)
# Baltic / Scandinavian High
pressure += 10 * np.exp(-((lon_grid - 22) ** 2 + (lat_grid - 57) ** 2) / 220)
# Gentle Mediterranean trough
pressure -= 6 * np.exp(-((lon_grid - 12) ** 2 + (lat_grid - 40) ** 2) / 280)
pressure = gaussian_filter(pressure, sigma=3)

df_raster = pd.DataFrame({"lon": lon_grid.ravel(), "lat": lat_grid.ravel(), "pressure": pressure.ravel()})

# Compute isobar paths using contourpy (pure path-computation library, no pyplot)
p_lo = int(np.floor(pressure.min() / 4) * 4)
p_hi = int(np.ceil(pressure.max() / 4) * 4)
contour_levels = list(range(p_lo, p_hi + 4, 4))

gen = contour_generator(x=lon_vec, y=lat_vec, z=pressure)

isobar_rows: list = []
label_rows: list = []
for i, level in enumerate(contour_levels):
    segs = gen.lines(level)
    if not segs:
        continue
    # Label every 2nd contour level using midpoint of the longest segment
    if i % 2 == 0:
        longest = max(segs, key=len)
        mid = len(longest) // 2
        label_rows.append({"lon": float(longest[mid, 0]), "lat": float(longest[mid, 1]), "label": str(int(level))})
    for seg_idx, seg in enumerate(segs):
        if len(seg) < 2:
            continue
        group = f"iso_{level:.0f}_{seg_idx}"
        for lon_c, lat_c in seg:
            isobar_rows.append({"lon": lon_c, "lat": lat_c, "group": group})

df_isobars = pd.DataFrame(isobar_rows)
df_labels = pd.DataFrame(label_rows)

# Simplified European geographic outlines (hardcoded, no geopandas required)
# Western European continental coast (south → north)
euro_coast = {
    "lons": [-5.6, -9.0, -9.5, -9.2, -8.7, -9.2, -1.8, -1.5, -4.7, -2.5, -1.5, 0.0, 1.5, 2.5, 4.0, 5.0, 8.0, 8.5, 5.0],
    "lats": [
        36.1,
        37.0,
        38.5,
        39.5,
        43.0,
        42.9,
        43.5,
        44.0,
        48.0,
        47.5,
        49.0,
        49.2,
        50.5,
        51.0,
        52.5,
        53.0,
        55.0,
        57.0,
        58.0,
    ],
    "group": "euro",
}
# British Isles (closed polygon)
uk_coast = {
    "lons": [-5.7, 0.0, 1.7, 1.5, 0.5, -1.0, -2.5, -4.5, -6.0, -5.5, -4.5, -4.0, -3.5, -4.5, -5.0, -5.7],
    "lats": [50.1, 51.0, 52.5, 53.5, 54.5, 57.5, 58.0, 58.5, 57.5, 56.0, 55.5, 54.5, 53.5, 52.5, 51.5, 50.1],
    "group": "uk",
}
# Scandinavian Peninsula (closed polygon)
scand_coast = {
    "lons": [5.0, 8.0, 11.0, 12.5, 16.0, 18.0, 20.0, 22.0, 24.0, 27.0, 28.5, 25.0, 20.0, 16.0, 14.0, 12.0, 10.0, 5.0],
    "lats": [
        57.5,
        57.5,
        56.0,
        56.0,
        57.5,
        59.0,
        60.0,
        63.0,
        65.5,
        69.0,
        71.0,
        71.0,
        68.0,
        66.0,
        64.0,
        62.0,
        59.5,
        57.5,
    ],
    "group": "scand",
}
# Iceland
iceland_coast = {
    "lons": [-13.5, -18.0, -24.0, -24.5, -22.0, -18.0, -14.0, -13.5, -13.5],
    "lats": [63.5, 63.5, 64.0, 65.5, 66.5, 66.5, 65.5, 64.5, 63.5],
    "group": "iceland",
}

outline_rows = []
for feature in [euro_coast, uk_coast, scand_coast, iceland_coast]:
    for lon_c, lat_c in zip(feature["lons"], feature["lats"], strict=True):
        outline_rows.append({"lon": lon_c, "lat": lat_c, "group": feature["group"]})

df_outlines = pd.DataFrame(outline_rows)

anyplot_theme = theme(
    figure_size=(8, 4.5),
    plot_background=element_rect(fill=PAGE_BG, color=PAGE_BG),
    panel_background=element_rect(fill=PAGE_BG),
    panel_grid_major=element_line(color=INK, size=0.3, alpha=0.10),
    panel_grid_minor=element_blank(),
    panel_border=element_rect(color=INK_SOFT, fill=None),
    axis_title=element_text(color=INK, size=10),
    axis_text=element_text(color=INK_SOFT, size=8),
    axis_line=element_line(color=INK_SOFT),
    plot_title=element_text(color=INK, size=12),
    legend_background=element_rect(fill=ELEVATED_BG, color=INK_SOFT),
    legend_text=element_text(color=INK_SOFT, size=8),
    legend_title=element_text(color=INK, size=9),
)

lon_breaks = [-20, -10, 0, 10, 20, 30, 40]
lon_labels = [f"{abs(x)}°W" if x < 0 else ("0°" if x == 0 else f"{x}°E") for x in lon_breaks]
lat_breaks = [40, 50, 60, 70]
lat_labels = [f"{y}°N" for y in lat_breaks]

title = "contour-map-geographic · python · plotnine · anyplot.ai"

plot = (
    ggplot(df_raster, aes("lon", "lat"))
    + geom_raster(aes(fill="pressure"))
    + geom_path(
        data=df_isobars,
        mapping=aes(x="lon", y="lat", group="group"),
        color=INK_SOFT,
        size=0.4,
        alpha=0.65,
        inherit_aes=False,
    )
    + geom_path(data=df_outlines, mapping=aes(x="lon", y="lat", group="group"), color=INK, size=0.6, inherit_aes=False)
    + geom_label(
        data=df_labels,
        mapping=aes(x="lon", y="lat", label="label"),
        color=INK,
        fill=PAGE_BG,
        size=6,
        label_padding=0.1,
        label_size=0.2,
        inherit_aes=False,
    )
    + scale_fill_cmap(cmap_name="BrBG", name="Pressure\n(hPa)")
    + scale_x_continuous(breaks=lon_breaks, labels=lon_labels)
    + scale_y_continuous(breaks=lat_breaks, labels=lat_labels)
    + coord_cartesian(xlim=(-30, 50), ylim=(35, 75))
    + labs(x="Longitude", y="Latitude", title=title)
    + anyplot_theme
)

plot.save(f"plot-{THEME}.png", dpi=400, width=8, height=4.5, units="in", verbose=False)
Runnable source as JSON, for any HTTP client: https://api.anyplot.ai/specs/contour-map-geographic/plotnine/code. Any spec id and library id listed in llms-full.txt fit the same URL shape; every URL below is complete and callable.
{
  "spec_id": "contour-map-geographic",
  "language": "python",
  "library": "plotnine",
  "page": "https://anyplot.ai/contour-map-geographic/python/plotnine",
  "hub": "https://anyplot.ai/contour-map-geographic",
  "code_json": "https://api.anyplot.ai/specs/contour-map-geographic/plotnine/code",
  "spec_json": "https://api.anyplot.ai/specs/contour-map-geographic",
  "render_light_png": "https://storage.googleapis.com/anyplot-images/plots/contour-map-geographic/python/plotnine/plot-light.png",
  "render_dark_png": "https://storage.googleapis.com/anyplot-images/plots/contour-map-geographic/python/plotnine/plot-dark.png",
  "quality_score": 88.0,
  "license": "MIT",
  "guide": "https://anyplot.ai/llms.txt"
}
Part of Contour Lines on Geographic Map on anyplot.ai.