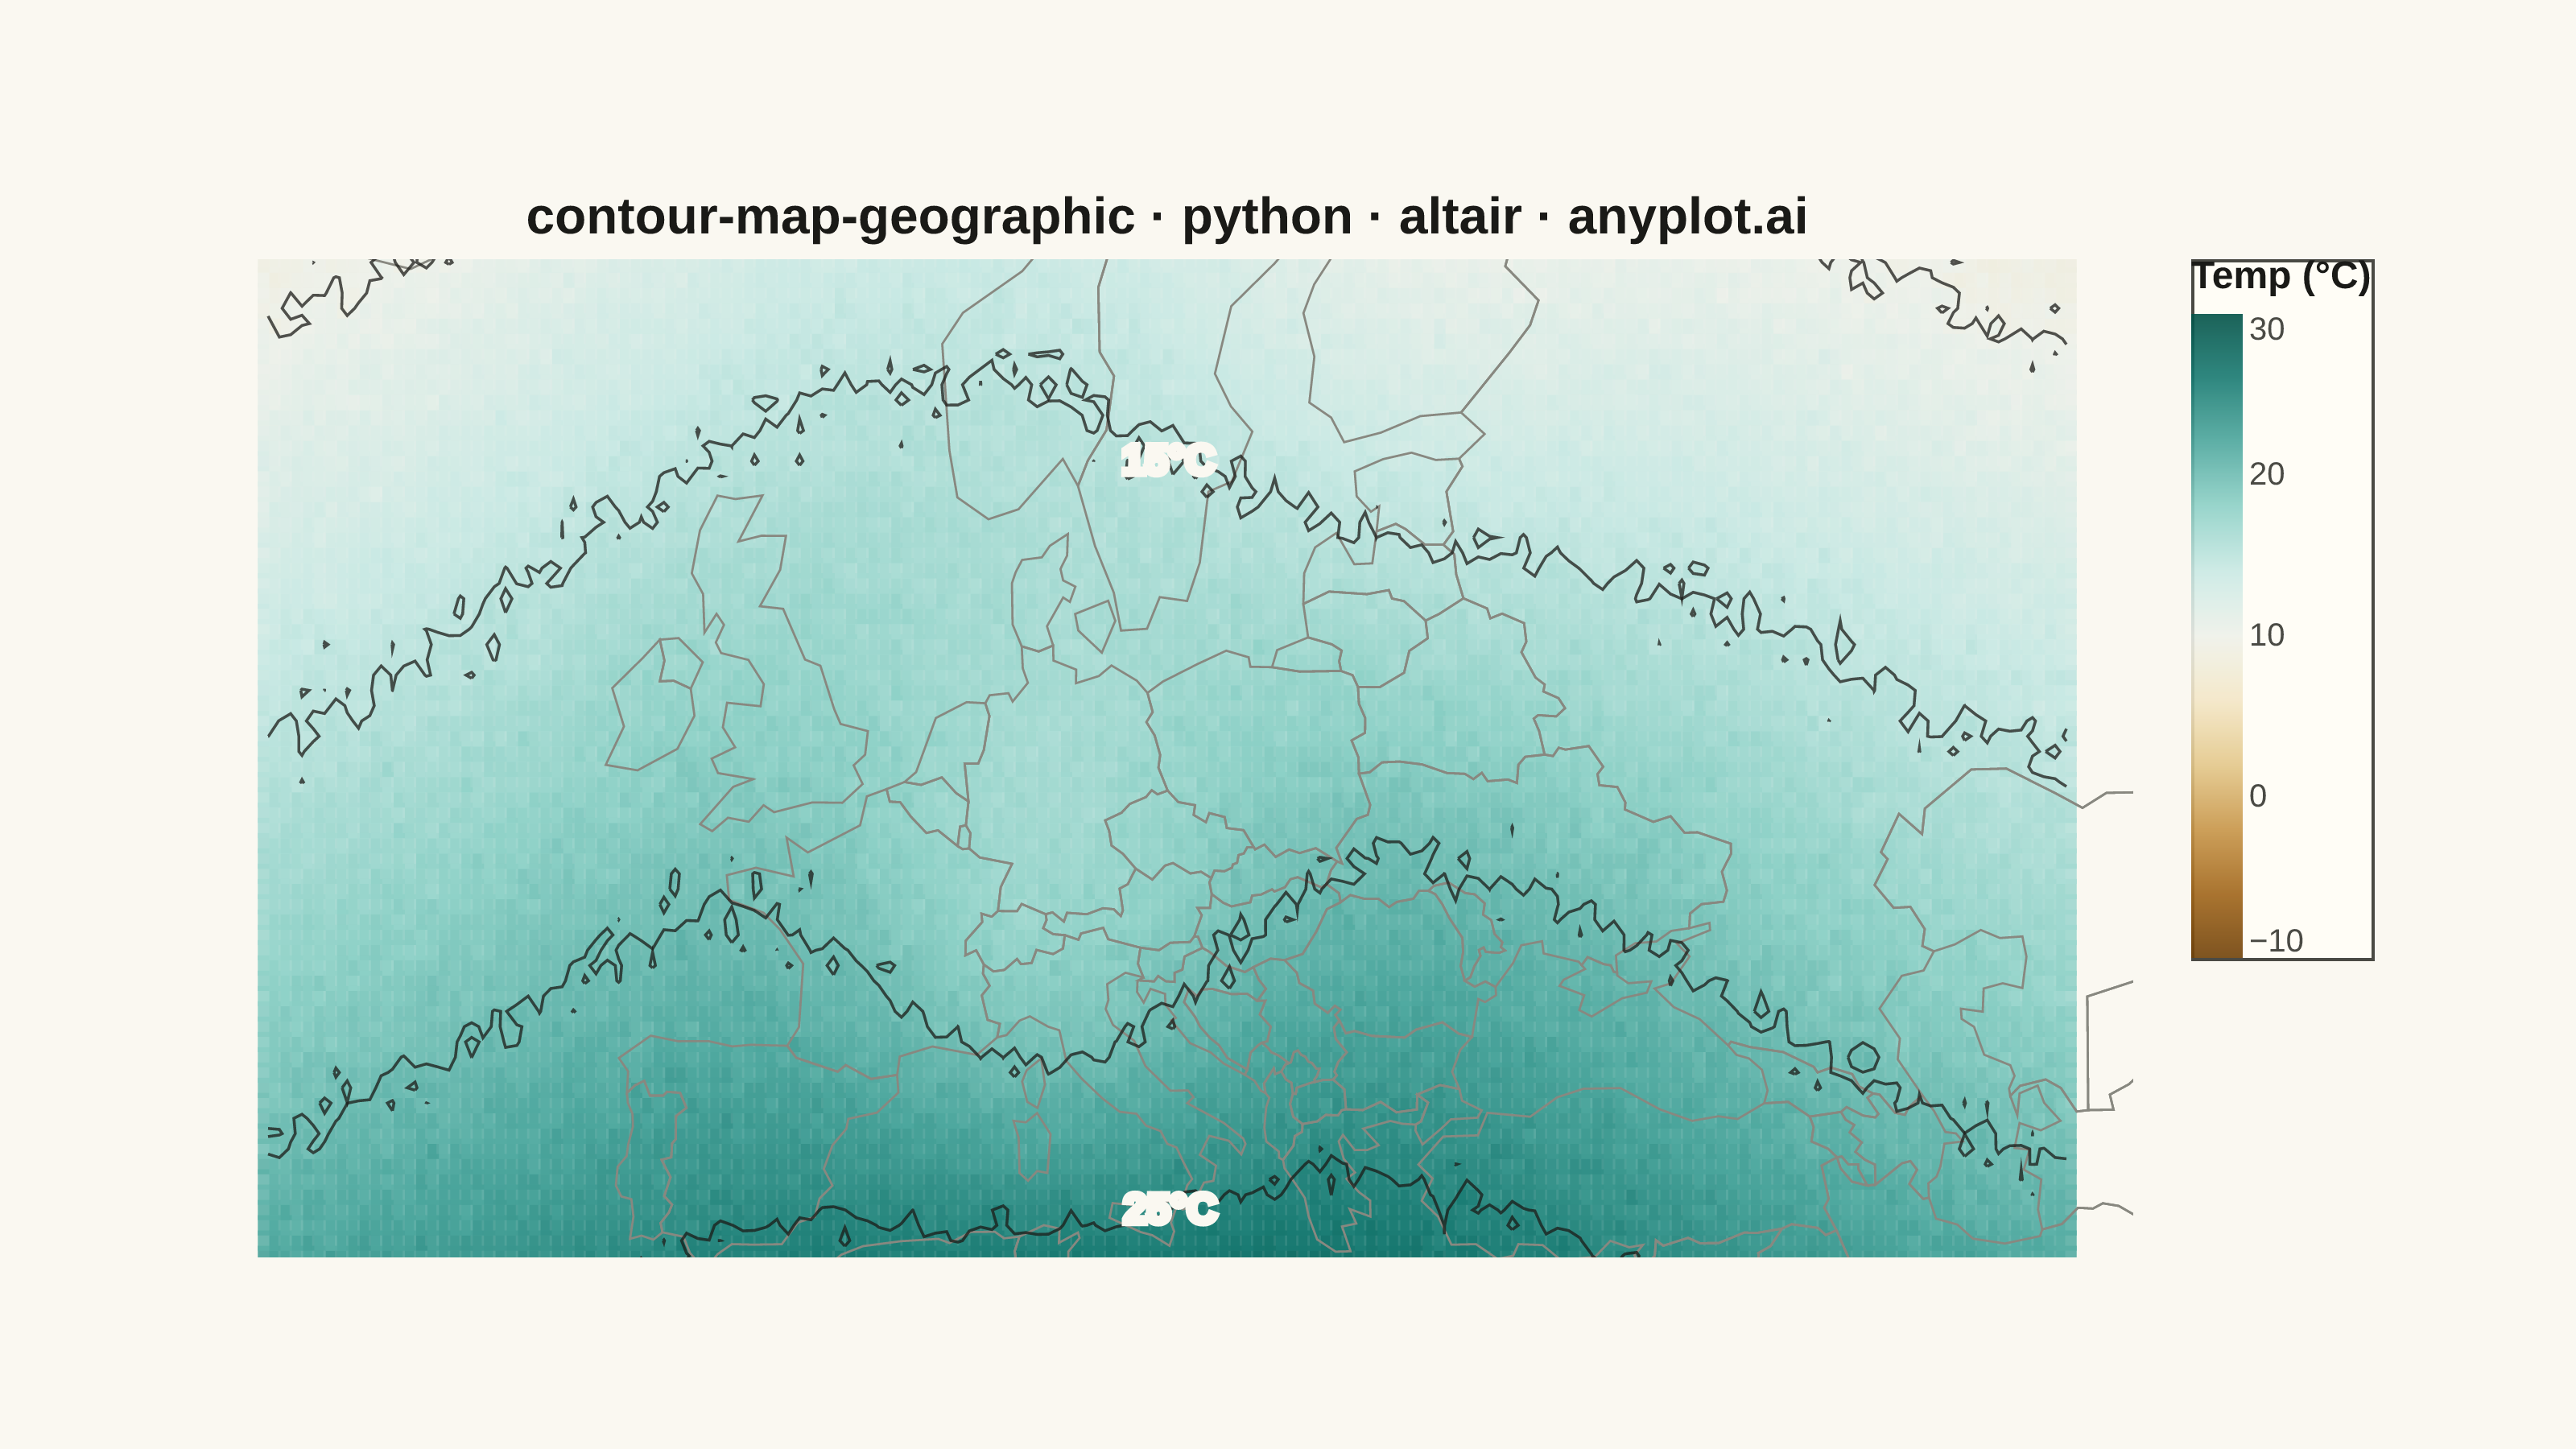
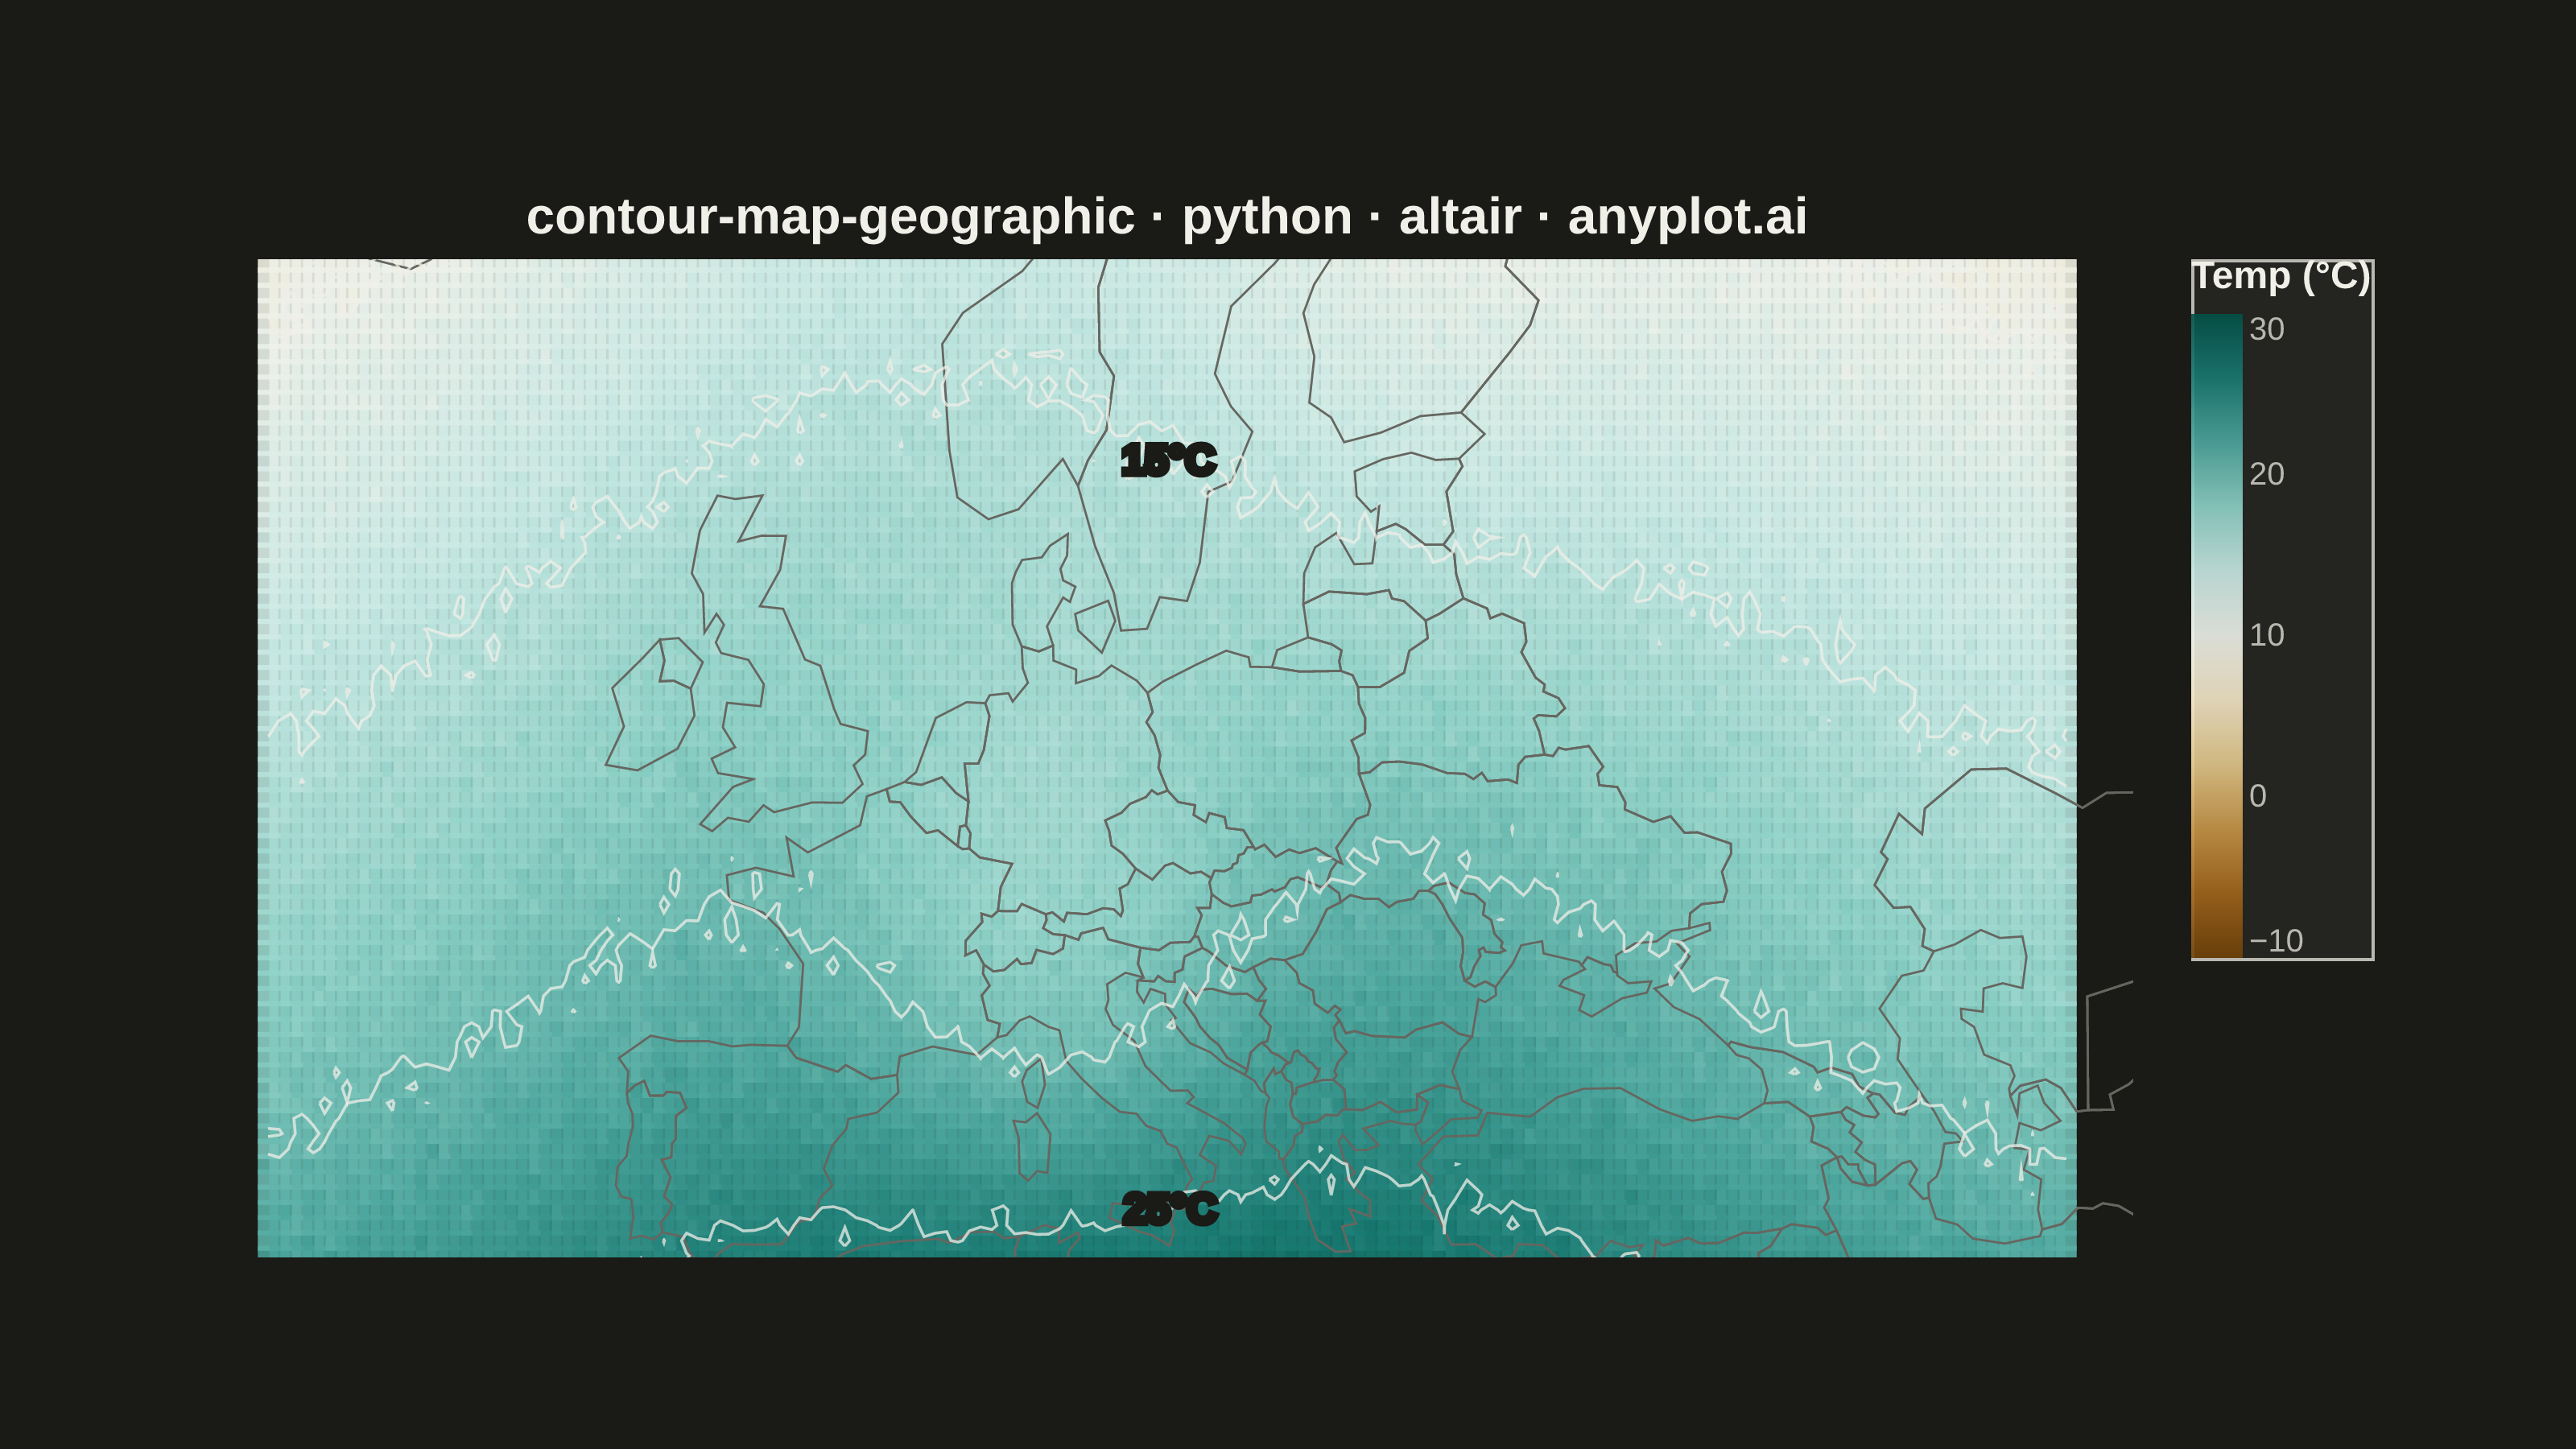
A contour map overlays isolines (lines of equal value) onto a geographic basemap, visualizing continuous spatial data such as elevation, temperature, or atmospheric pressure across real-world coordinates. Unlike basic contour plots that use abstract x/y coordinates, this plot anchors contours to latitude/longitude positions with geographic context like coastlines, borders, or terrain. It combines the precision of isoline visualization with spatial awareness, making it ideal for meteorological, topographic, and environmental applications.
""" anyplot.ai
contour-map-geographic: Contour Lines on Geographic Map
Library: altair 6.1.0 | Python 3.13.13
Quality: 81/100 | Updated: 2026-05-20
"""

import os
import sys


# Prevent altair.py (this file) from shadowing the installed altair package
_script_dir = os.path.dirname(os.path.abspath(__file__))
sys.path = [p for p in sys.path if p and os.path.abspath(p) != _script_dir]

import altair as alt
import numpy as np
import pandas as pd
from contourpy import contour_generator
from PIL import Image


# Theme tokens
THEME = os.getenv("ANYPLOT_THEME", "light")
PAGE_BG = "#FAF8F1" if THEME == "light" else "#1A1A17"
ELEVATED_BG = "#FFFDF6" if THEME == "light" else "#242420"
INK = "#1A1A17" if THEME == "light" else "#F0EFE8"
INK_SOFT = "#4A4A44" if THEME == "light" else "#B8B7B0"
BASEMAP_STROKE = "#888880" if THEME == "light" else "#666660"

# Data — Mercator-uniform latitude grid eliminates stripe artefacts
np.random.seed(42)

# Convert latitude bounds to Mercator y, space uniformly, invert back to lat
_y_lo = np.log(np.tan(np.pi / 4 + 30 * np.pi / 360))
_y_hi = np.log(np.tan(np.pi / 4 + 72 * np.pi / 360))
_y_vals = np.linspace(_y_lo, _y_hi, 110)
lat_range = 2 * (np.arctan(np.exp(_y_vals)) - np.pi / 4) * 180 / np.pi

lon_range = np.linspace(-25, 55, 160)
lon_grid, lat_grid = np.meshgrid(lon_range, lat_range)

temperature = (
    30
    - 0.6 * (lat_grid - 30)
    + 3 * np.sin((lon_grid + 10) / 15)
    + 2 * np.cos(lat_grid / 10)
    - 5 * np.exp(-((lat_grid - 47) ** 2 + (lon_grid - 10) ** 2) / 100)
    - 3 * np.exp(-((lat_grid - 65) ** 2 + (lon_grid - 25) ** 2) / 150)
    + np.random.normal(0, 0.3, lon_grid.shape)
)
temperature = np.clip(temperature, -15, 35)

df_fill = pd.DataFrame(
    {"longitude": lon_grid.flatten(), "latitude": lat_grid.flatten(), "temperature": temperature.flatten()}
)

# True contour paths from contourpy (operates in geographic coordinate space)
contour_levels = [-5, 0, 5, 10, 15, 20, 25]
gen = contour_generator(x=lon_range, y=lat_range, z=temperature)

line_rows = []
seg_counter = 0
for level in contour_levels:
    for seg in gen.lines(level):
        if len(seg) >= 3:
            for order, (lon, lat) in enumerate(seg):
                line_rows.append(
                    {
                        "longitude": float(lon),
                        "latitude": float(lat),
                        "level": float(level),
                        "seg_id": seg_counter,
                        "order": order,
                    }
                )
            seg_counter += 1

line_df = pd.DataFrame(line_rows).sort_values(["seg_id", "order"])

# One contour label per level: pick the point nearest lon=15°E within visible range
# Visible latitude range is approx 36-64°N at scale=400, center=(15°N,52°N), height=310
label_rows = []
for lvl in [-5, 5, 15, 25]:
    subset = line_df[
        (line_df["level"] == float(lvl))
        & (line_df["longitude"] > 5)
        & (line_df["longitude"] < 40)
        & (line_df["latitude"] > 35)
        & (line_df["latitude"] < 64)
    ]
    if len(subset) > 0:
        idx = (subset["longitude"] - 15).abs().idxmin()
        row = line_df.loc[idx]
        label_rows.append(
            {"longitude": float(row["longitude"]), "latitude": float(row["latitude"]), "label": f"{int(lvl)}°C"}
        )

label_df = pd.DataFrame(label_rows)

# Chart construction
W, H = 600, 310
proj = {"type": "mercator", "scale": 400, "center": [15, 52]}

countries = alt.topo_feature("https://cdn.jsdelivr.net/npm/world-atlas@2/countries-110m.json", "countries")

# Temperature raster — mark_square size tuned to Mercator-uniform y step
# y_step = (y_hi - y_lo) / 109 * scale = 1.294/109*400 ≈ 4.75 px; size=40 (side=6.3) covers it
heat = (
    alt.Chart(df_fill)
    .mark_square(size=40, opacity=0.90)
    .encode(
        longitude="longitude:Q",
        latitude="latitude:Q",
        color=alt.Color(
            "temperature:Q",
            scale=alt.Scale(scheme="brownbluegreen", domain=[-10, 30]),
            legend=alt.Legend(
                title="Temp (°C)",
                titleFontSize=12,
                labelFontSize=10,
                gradientLength=200,
                gradientThickness=16,
                orient="right",
            ),
        ),
        tooltip=[
            alt.Tooltip("longitude:Q", format=".1f", title="Lon"),
            alt.Tooltip("latitude:Q", format=".1f", title="Lat"),
            alt.Tooltip("temperature:Q", format=".1f", title="Temp (°C)"),
        ],
    )
    .project(**proj)
    .properties(width=W, height=H)
)

# Country borders overlay on top of temperature fill for geographic context
borders = (
    alt.Chart(countries)
    .mark_geoshape(filled=False, stroke=BASEMAP_STROKE, strokeWidth=0.7)
    .project(**proj)
    .properties(width=W, height=H)
)

# True smooth contour isolines
isolines = (
    alt.Chart(line_df)
    .mark_line(color=INK, strokeWidth=0.9, opacity=0.75)
    .encode(longitude="longitude:Q", latitude="latitude:Q", detail="seg_id:N", order="order:Q")
    .project(**proj)
    .properties(width=W, height=H)
)

# Temperature labels at selected contour levels
iso_labels = (
    alt.Chart(label_df)
    .mark_text(fontSize=13, fontWeight="bold", fill=INK, stroke=PAGE_BG, strokeWidth=2)
    .encode(longitude="longitude:Q", latitude="latitude:Q", text="label:N")
    .project(**proj)
    .properties(width=W, height=H)
)

chart = (
    alt.layer(heat, borders, isolines, iso_labels)
    .properties(
        width=W,
        height=H,
        background=PAGE_BG,
        title=alt.Title(
            "contour-map-geographic · python · altair · anyplot.ai", fontSize=16, anchor="middle", color=INK
        ),
    )
    .configure_view(fill=PAGE_BG, stroke=INK_SOFT, strokeWidth=0.5)
    .configure_axis(labelColor=INK_SOFT, titleColor=INK)
    .configure_legend(fillColor=ELEVATED_BG, strokeColor=INK_SOFT, labelColor=INK_SOFT, titleColor=INK)
)

# Save PNG then pad to exact 3200×1800
TW, TH = 3200, 1800
chart.save(f"plot-{THEME}.png", scale_factor=4.0)

_img = Image.open(f"plot-{THEME}.png").convert("RGB")
_w, _h = _img.size
if _w > TW or _h > TH:
    raise SystemExit(f"vl-convert produced {_w}×{_h}, exceeds {TW}×{TH}. Shrink chart width/height and re-render.")
if _w < TW or _h < TH:
    _canvas = Image.new("RGB", (TW, TH), PAGE_BG)
    _canvas.paste(_img, ((TW - _w) // 2, (TH - _h) // 2))
    _canvas.save(f"plot-{THEME}.png")

chart.save(f"plot-{THEME}.html")
Runnable source as JSON, for any HTTP client: https://api.anyplot.ai/specs/contour-map-geographic/altair/code. Any spec id and library id listed in llms-full.txt fit the same URL shape; every URL below is complete and callable.
{
  "spec_id": "contour-map-geographic",
  "language": "python",
  "library": "altair",
  "page": "https://anyplot.ai/contour-map-geographic/python/altair",
  "hub": "https://anyplot.ai/contour-map-geographic",
  "code_json": "https://api.anyplot.ai/specs/contour-map-geographic/altair/code",
  "spec_json": "https://api.anyplot.ai/specs/contour-map-geographic",
  "render_light_png": "https://storage.googleapis.com/anyplot-images/plots/contour-map-geographic/python/altair/plot-light.png",
  "render_dark_png": "https://storage.googleapis.com/anyplot-images/plots/contour-map-geographic/python/altair/plot-dark.png",
  "interactive_light_html": "https://storage.googleapis.com/anyplot-images/plots/contour-map-geographic/python/altair/plot-light.html",
  "interactive_dark_html": "https://storage.googleapis.com/anyplot-images/plots/contour-map-geographic/python/altair/plot-dark.html",
  "quality_score": 81.0,
  "license": "MIT",
  "guide": "https://anyplot.ai/llms.txt"
}
Part of Contour Lines on Geographic Map on anyplot.ai.