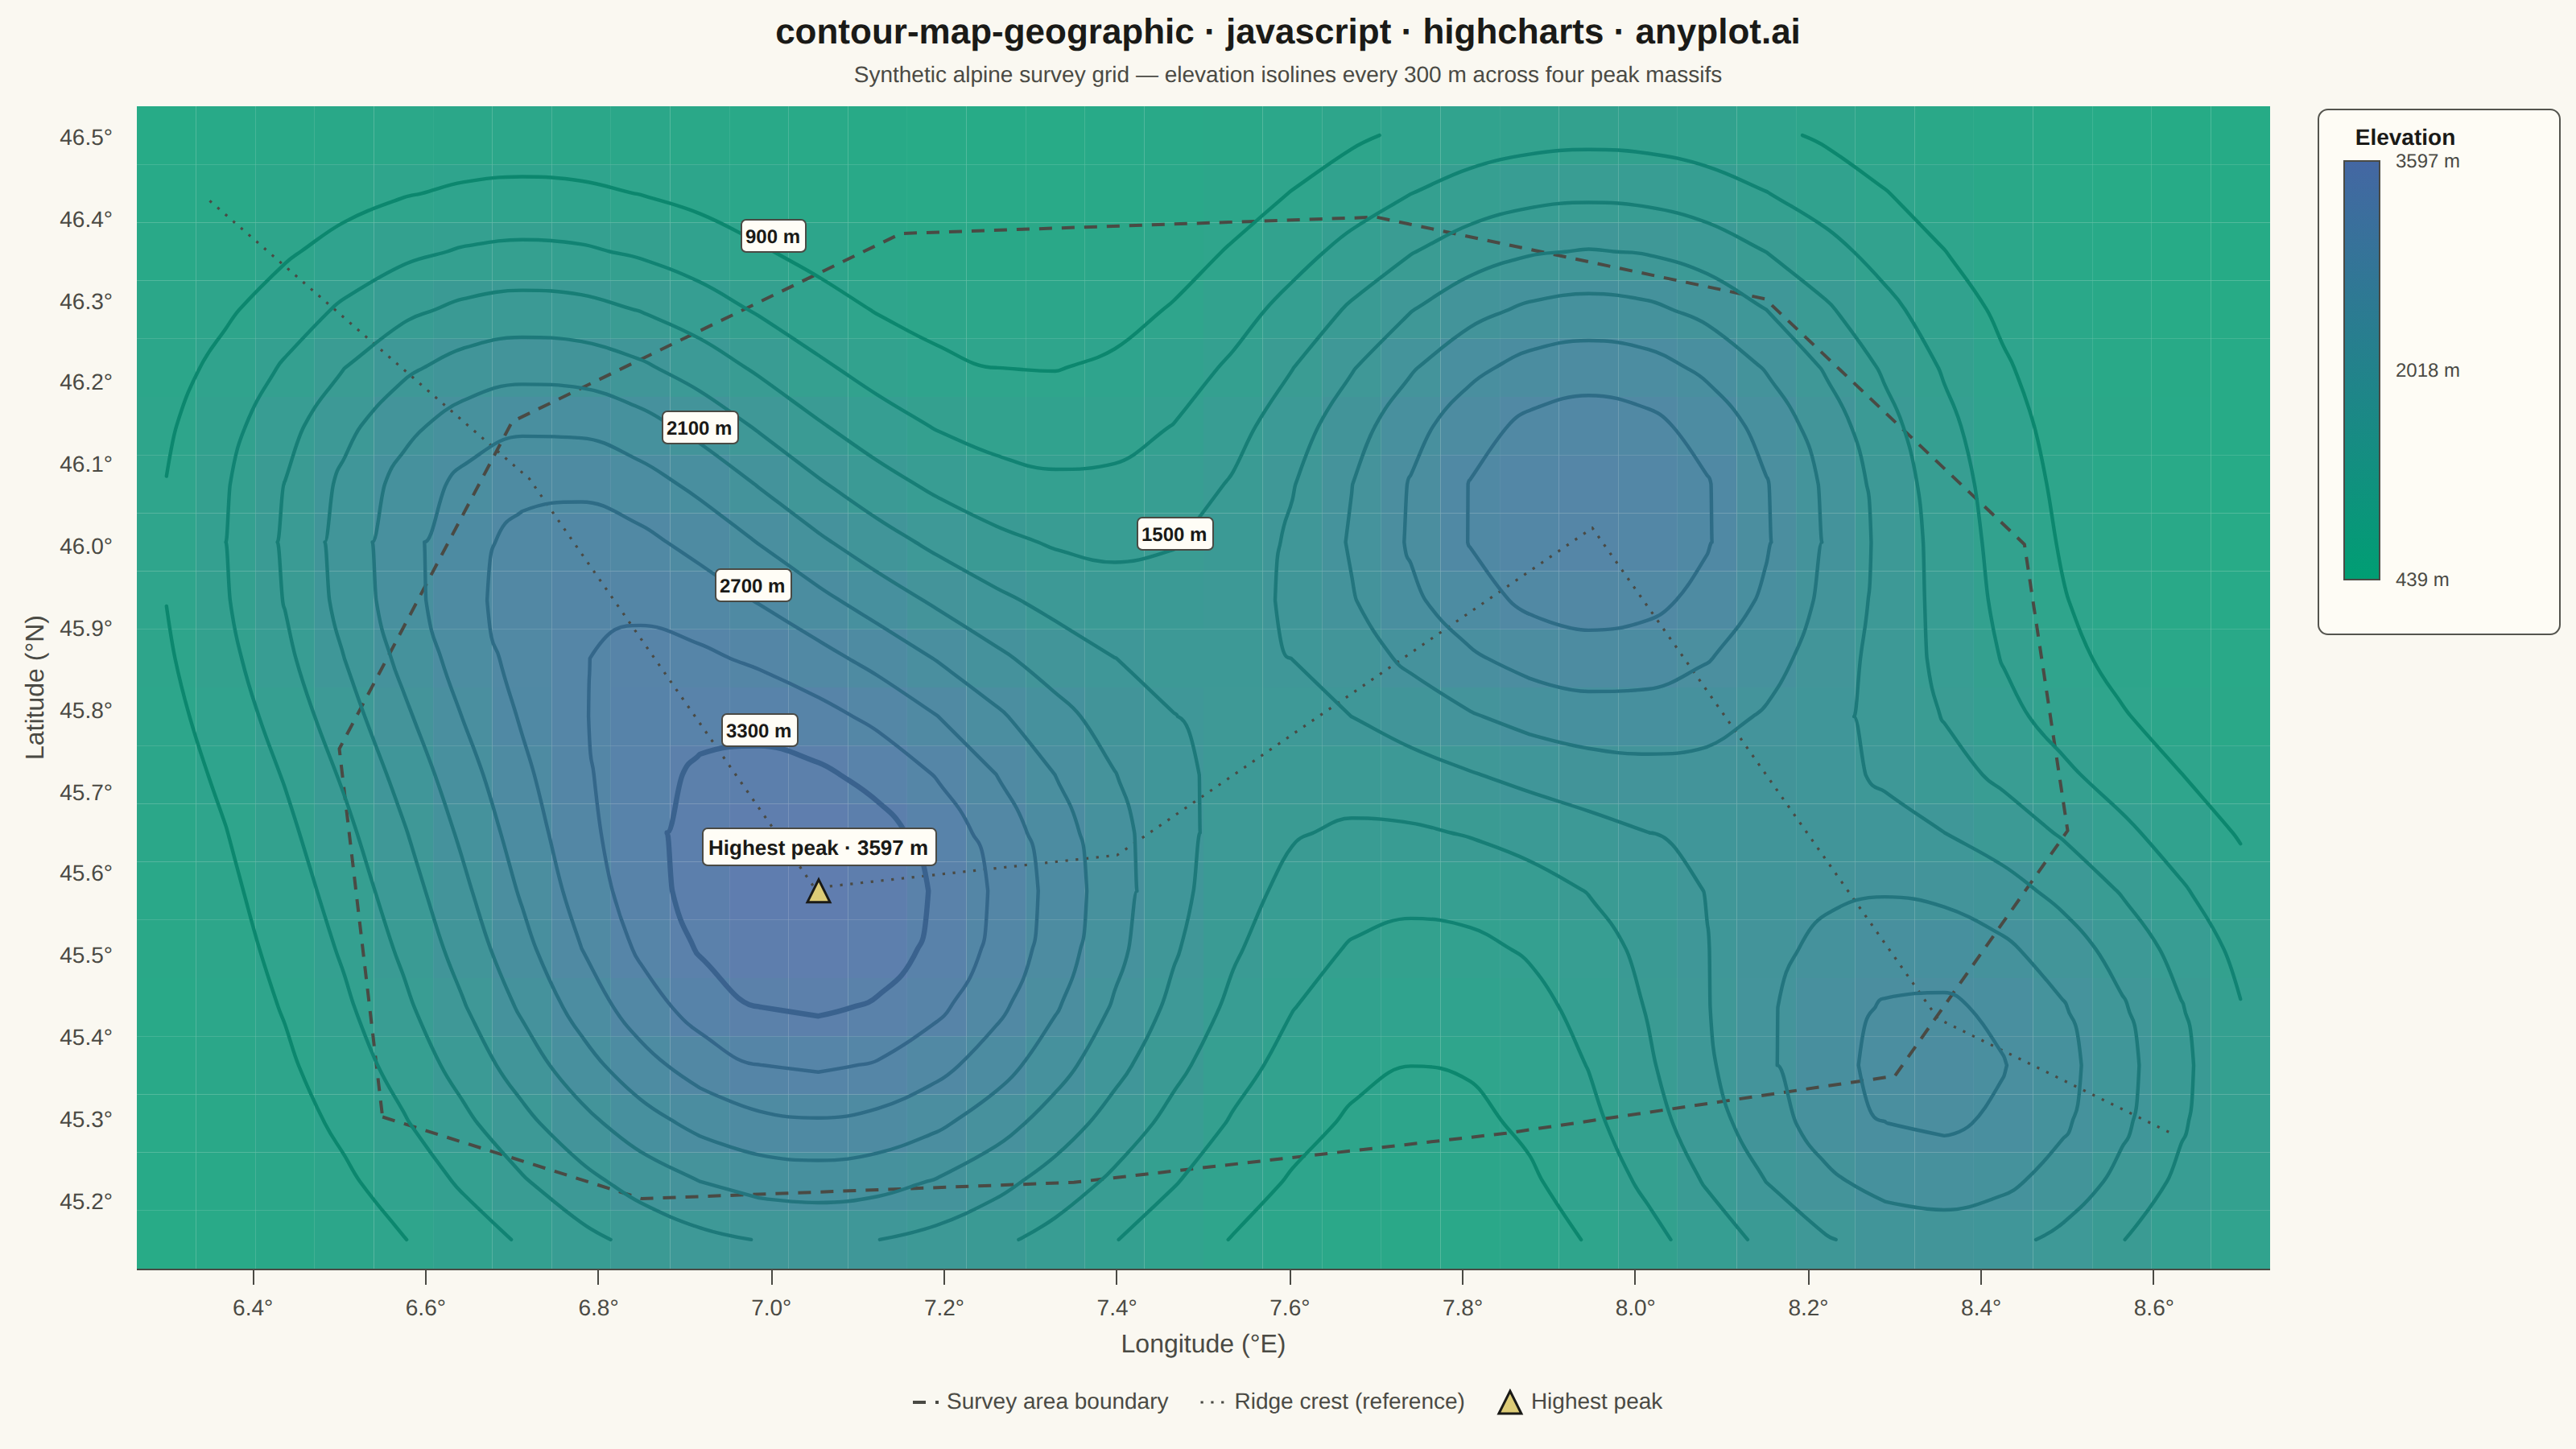
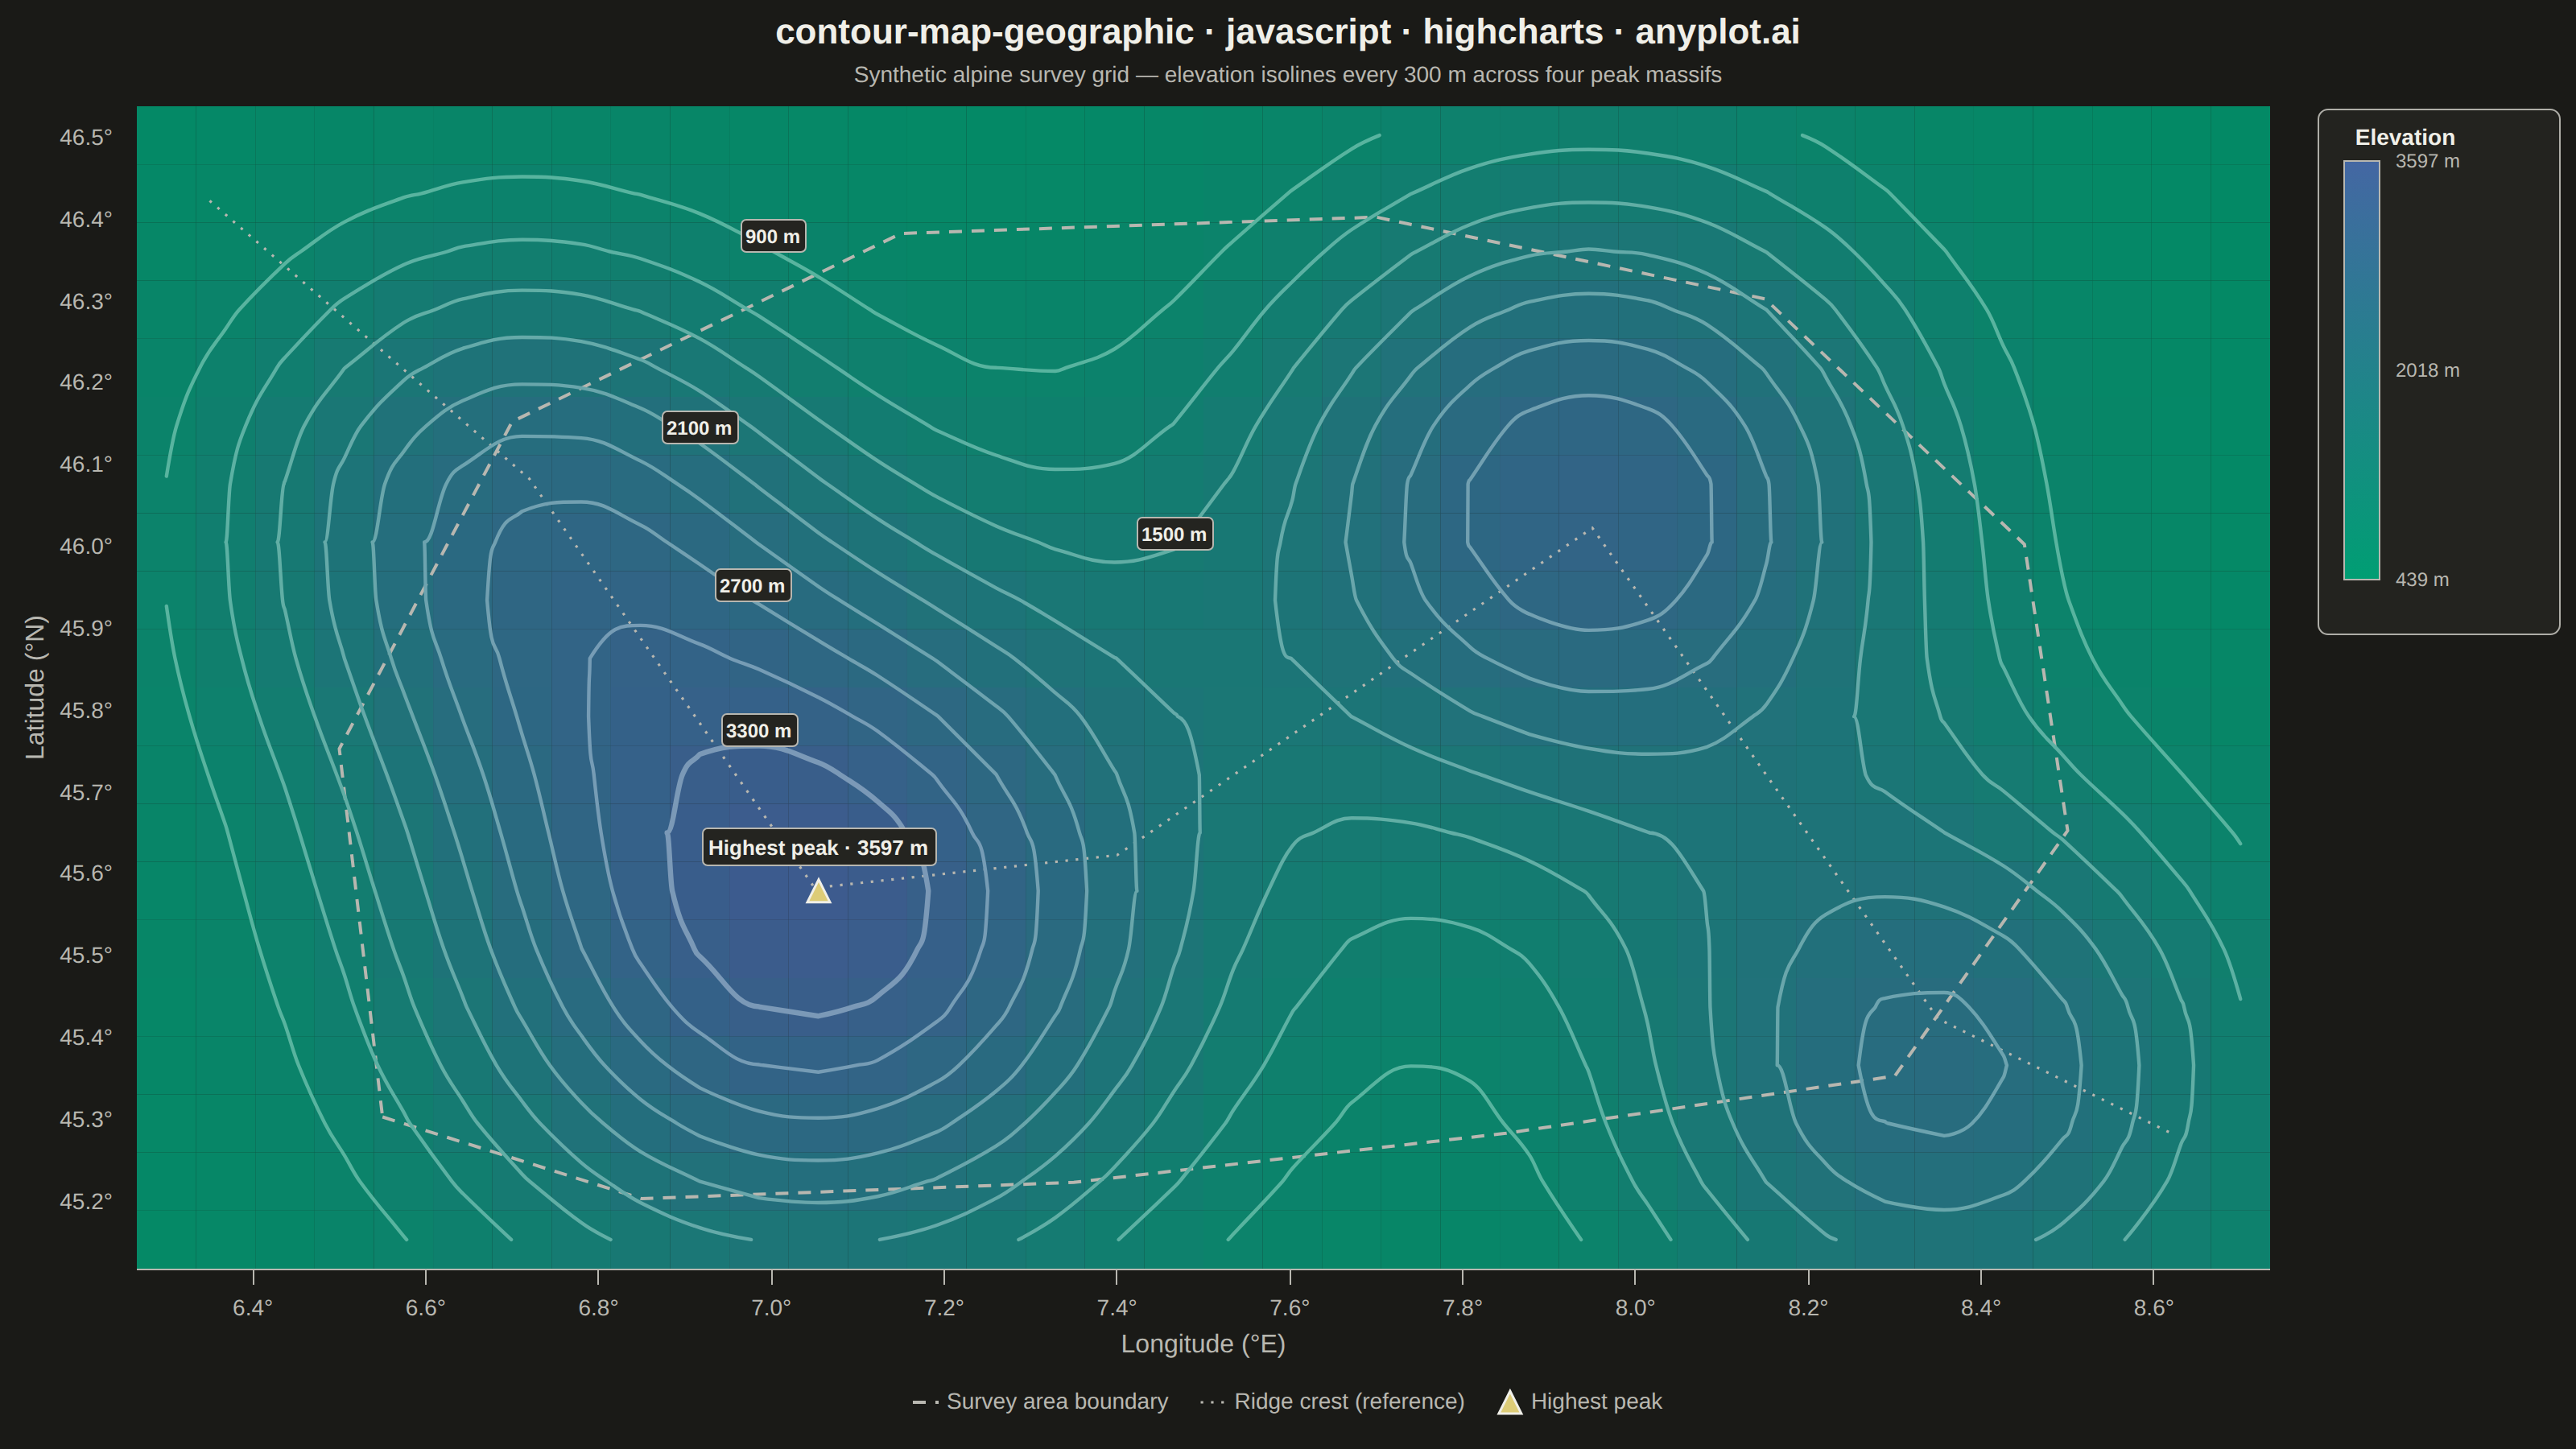
The same plot in 14 other libraries — JavaScript: Chart.js, D3.js, Apache ECharts, MUI X Charts; Python: Altair, Bokeh, lets-plot, Matplotlib, Plotly, plotnine, Pygal, Seaborn; R: ggplot2; Julia: Makie.jl. Compare all 15 side by side: Contour Lines on Geographic Map in Python, R, Julia and JavaScript.
A contour map overlays isolines (lines of equal value) onto a geographic basemap, visualizing continuous spatial data such as elevation, temperature, or atmospheric pressure across real-world coordinates. Unlike basic contour plots that use abstract x/y coordinates, this plot anchors contours to latitude/longitude positions with geographic context like coastlines, borders, or terrain. It combines the precision of isoline visualization with spatial awareness, making it ideal for meteorological, topographic, and environmental applications.
// anyplot.ai
// contour-map-geographic: Contour Lines on Geographic Map
// Library: highcharts 12.6.0 | JavaScript 22.23.2
// Quality: 90/100 | Created: 2026-09-01

//# anyplot-orientation: landscape
const t = window.ANYPLOT_TOKENS;

// --- Data: synthetic alpine elevation field over a lon/lat survey grid -----
// --- (deterministic sum of peak Gaussians — no RNG needed) -----------------
const LON_MIN = 6.3;
const LON_MAX = 8.7;
const LAT_MIN = 45.15;
const LAT_MAX = 46.5;
const NX = 36;
const NY = 20;

const PEAKS = [
  { lon: 7.05, lat: 45.55, height: 3100, sigma: 0.32 },
  { lon: 7.95, lat: 46.05, height: 2550, sigma: 0.28 },
  { lon: 8.35, lat: 45.35, height: 2050, sigma: 0.26 },
  { lon: 6.7, lat: 46.05, height: 1750, sigma: 0.24 },
];

function elevationAt(lon, lat) {
  let z = 420; // valley floor, meters
  for (const peak of PEAKS) {
    const dLon = lon - peak.lon;
    const dLat = lat - peak.lat;
    const d2 = dLon * dLon + dLat * dLat;
    z += peak.height * Math.exp(-d2 / (2 * peak.sigma * peak.sigma));
  }
  return z;
}

const lons = Array.from(
  { length: NX },
  (_, i) => LON_MIN + (i * (LON_MAX - LON_MIN)) / (NX - 1),
);
const lats = Array.from(
  { length: NY },
  (_, j) => LAT_MIN + (j * (LAT_MAX - LAT_MIN)) / (NY - 1),
);
const grid = lats.map((lat) => lons.map((lon) => elevationAt(lon, lat)));

const flatValues = grid.flat();
const gridMin = Math.min(...flatValues);
const gridMax = Math.max(...flatValues);
const halfDLon = (lons[1] - lons[0]) / 2;
const halfDLat = (lats[1] - lats[0]) / 2;

// --- Locate the single highest grid point for a focal-point callout --------
let peakRow = 0;
let peakCol = 0;
grid.forEach((row, j) => {
  row.forEach((value, i) => {
    if (value > grid[peakRow][peakCol]) {
      peakRow = j;
      peakCol = i;
    }
  });
});
const peakLon = lons[peakCol];
const peakLat = lats[peakRow];

// --- Contour levels: round-number intervals spanning the field -------------
const LEVEL_STEP = 300; // meters
const firstLevel = Math.ceil((gridMin + LEVEL_STEP) / LEVEL_STEP) * LEVEL_STEP;
const levels = [];
for (let lvl = firstLevel; lvl < gridMax; lvl += LEVEL_STEP) levels.push(lvl);

// --- Imprint sequential color scale (single-polarity: low -> high) ---------
// Parses both "#RRGGBB" and "rgb(r, g, b)" so mixHex() results can be re-mixed
// (e.g. blending an already-mixed isoline color further toward t.ink).
function parseColor(color) {
  if (color.startsWith("#")) {
    return {
      r: parseInt(color.slice(1, 3), 16),
      g: parseInt(color.slice(3, 5), 16),
      b: parseInt(color.slice(5, 7), 16),
    };
  }
  const [r, g, b] = color.match(/[\d.]+/g).map(Number);
  return { r, g, b };
}

function mixHex(colorLow, colorHigh, frac) {
  const f = Math.max(0, Math.min(1, frac));
  const a = parseColor(colorLow);
  const b = parseColor(colorHigh);
  const r = Math.round(a.r + (b.r - a.r) * f);
  const g = Math.round(a.g + (b.g - a.g) * f);
  const bl = Math.round(a.b + (b.b - a.b) * f);
  return `rgb(${r}, ${g}, ${bl})`;
}

// --- Marching squares: trace one level's isolines as lon/lat segments ------
function marchingSquares(level) {
  const segments = [];
  const interp = (v0, v1, p0, p1) => {
    const frac = (level - v0) / (v1 - v0);
    return [p0[0] + frac * (p1[0] - p0[0]), p0[1] + frac * (p1[1] - p0[1])];
  };

  for (let j = 0; j < NY - 1; j++) {
    for (let i = 0; i < NX - 1; i++) {
      const x0 = lons[i];
      const x1 = lons[i + 1];
      const y0 = lats[j];
      const y1 = lats[j + 1];
      const bl = grid[j][i];
      const br = grid[j][i + 1];
      const tr = grid[j + 1][i + 1];
      const tl = grid[j + 1][i];
      const bit =
        (tl >= level ? 8 : 0) |
        (tr >= level ? 4 : 0) |
        (br >= level ? 2 : 0) |
        (bl >= level ? 1 : 0);
      if (bit === 0 || bit === 15) continue;

      const top = () => interp(tl, tr, [x0, y1], [x1, y1]);
      const right = () => interp(tr, br, [x1, y1], [x1, y0]);
      const bottom = () => interp(bl, br, [x0, y0], [x1, y0]);
      const left = () => interp(bl, tl, [x0, y0], [x0, y1]);

      // Standard marching-squares case table (TL=8, TR=4, BR=2, BL=1).
      // Cases 5 and 10 are the ambiguous saddle configurations; this table
      // resolves them with a fixed diagonal, which is a common convention.
      const CASES = {
        1: [[left(), bottom()]],
        2: [[bottom(), right()]],
        3: [[left(), right()]],
        4: [[right(), top()]],
        5: [
          [left(), top()],
          [bottom(), right()],
        ],
        6: [[bottom(), top()]],
        7: [[left(), top()]],
        8: [[top(), left()]],
        9: [[top(), bottom()]],
        10: [
          [top(), right()],
          [left(), bottom()],
        ],
        11: [[top(), right()]],
        12: [[right(), left()]],
        13: [[right(), bottom()]],
        14: [[bottom(), left()]],
      };
      segments.push(...CASES[bit]);
    }
  }
  return segments;
}

// --- Stitch disjoint segments into continuous polylines ---------------------
function stitchPolylines(segments) {
  const key = (p) => `${p[0].toFixed(5)},${p[1].toFixed(5)}`;
  const adjacency = new Map();
  segments.forEach((segment, segIdx) => {
    [0, 1].forEach((endIdx) => {
      const k = key(segment[endIdx]);
      if (!adjacency.has(k)) adjacency.set(k, []);
      adjacency.get(k).push({ segIdx, endIdx });
    });
  });

  const used = new Array(segments.length).fill(false);
  const polylines = [];
  for (let i = 0; i < segments.length; i++) {
    if (used[i]) continue;
    used[i] = true;
    const line = [segments[i][0], segments[i][1]];

    let extended = true;
    while (extended) {
      extended = false;
      const candidates = adjacency.get(key(line[line.length - 1])) || [];
      for (const cand of candidates) {
        if (used[cand.segIdx]) continue;
        const seg = segments[cand.segIdx];
        line.push(seg[cand.endIdx === 0 ? 1 : 0]);
        used[cand.segIdx] = true;
        extended = true;
        break;
      }
    }
    extended = true;
    while (extended) {
      extended = false;
      const candidates = adjacency.get(key(line[0])) || [];
      for (const cand of candidates) {
        if (used[cand.segIdx]) continue;
        const seg = segments[cand.segIdx];
        line.unshift(seg[cand.endIdx === 0 ? 1 : 0]);
        used[cand.segIdx] = true;
        extended = true;
        break;
      }
    }
    polylines.push(line);
  }
  return polylines;
}

// --- Build one real Highcharts series per traced polyline -------------------
// Each isoline is genuine point data (hover works), not a decorative overlay.
// Lines are blended toward t.ink (more so on dark theme, where both ends of
// the seq gradient sit close in lightness to the near-black page) so isolines
// stay legible against the raster without changing the raster's own colors.
const ISOLINE_INK_BLEND = t.theme === "dark" ? 0.34 : 0.12;
const topLevel = levels[levels.length - 1];
const contourSeries = [];
levels.forEach((level, levelIdx) => {
  const polylines = stitchPolylines(marchingSquares(level)).filter(
    (line) => line.length >= 4,
  );
  if (polylines.length === 0) return;

  const isFocalLevel = level === topLevel;
  const baseColor = mixHex(t.seq[0], t.seq[1], (level - gridMin) / (gridMax - gridMin));
  const lineColor = mixHex(baseColor, t.ink, ISOLINE_INK_BLEND);
  const longest = polylines.reduce((a, b) => (b.length > a.length ? b : a));

  polylines.forEach((line) => {
    const midIdx = Math.floor(line.length / 2);
    const showLabel = line === longest && (levelIdx % 2 === 0 || isFocalLevel);
    contourSeries.push({
      name: `${level} m`,
      type: "spline",
      color: lineColor,
      lineWidth: isFocalLevel ? 3.2 : 2.2,
      marker: { enabled: false },
      showInLegend: false,
      zIndex: isFocalLevel ? 5 : 4,
      tooltip: { headerFormat: "", pointFormat: `Elevation isoline: <b>${level} m</b>` },
      data: line.map((p, idx) => {
        const point = { x: p[0], y: p[1] };
        if (showLabel && idx === midIdx) {
          point.dataLabels = {
            enabled: true,
            format: `${level} m`,
            style: { color: t.ink, fontSize: "12px", fontWeight: "600", textOutline: "none" },
            backgroundColor: t.elevatedBg,
            borderColor: t.inkSoft,
            borderWidth: 1,
            borderRadius: 3,
            padding: 3,
          };
        }
        return point;
      }),
    });
  });
});

// --- Survey area boundary (geographic context, inset within the grid) ------
const boundaryPoints = [
  [6.55, 45.3],
  [6.85, 45.2],
  [7.35, 45.22],
  [7.85, 45.28],
  [8.3, 45.35],
  [8.5, 45.65],
  [8.45, 46.0],
  [8.15, 46.3],
  [7.7, 46.4],
  [7.15, 46.38],
  [6.7, 46.15],
  [6.5, 45.75],
  [6.55, 45.3],
];
const boundarySeries = {
  name: "Survey area boundary",
  type: "line",
  color: t.inkSoft,
  dashStyle: "Dash",
  lineWidth: 2,
  marker: { enabled: false },
  enableMouseTracking: false,
  showInLegend: true,
  zIndex: 2,
  data: boundaryPoints.map((p) => ({ x: p[0], y: p[1] })),
};

// --- Ridge-crest reference line (second geographic context feature, -------
// --- a stylized topographic divide tracing the massif chain) ---------------
const ridgelinePoints = [
  [6.35, 46.42],
  [6.72, 46.08],
  [7.05, 45.58],
  [7.4, 45.62],
  [7.95, 46.02],
  [8.35, 45.42],
  [8.62, 45.28],
];
const ridgelineSeries = {
  name: "Ridge crest (reference)",
  type: "line",
  color: t.inkSoft,
  dashStyle: "Dot",
  lineWidth: 1.6,
  marker: { enabled: false },
  enableMouseTracking: false,
  showInLegend: true,
  zIndex: 3,
  data: ridgelinePoints.map((p) => ({ x: p[0], y: p[1] })),
};

// --- Highest-peak focal callout (sharpens the terrain read beyond an -------
// --- evenly-weighted four-peak overview) ------------------------------------
const peakSeries = {
  name: "Highest peak",
  type: "scatter",
  color: t.ink,
  marker: {
    enabled: true,
    symbol: "triangle",
    radius: 7,
    fillColor: t.amber,
    lineColor: t.ink,
    lineWidth: 1.5,
  },
  enableMouseTracking: false,
  showInLegend: true,
  zIndex: 6,
  dataLabels: {
    enabled: true,
    format: `Highest peak · ${Math.round(gridMax)} m`,
    y: -16,
    style: { color: t.ink, fontSize: "13px", fontWeight: "700", textOutline: "none" },
    backgroundColor: t.elevatedBg,
    borderColor: t.inkSoft,
    borderWidth: 1,
    borderRadius: 3,
    padding: 4,
  },
  data: [{ x: peakLon, y: peakLat }],
};

// --- Filled elevation raster (core Highcharts has no heatmap/colorAxis -----
// --- module — each grid cell is drawn as a real, data-colored rect) --------
function drawElevationRaster(chart) {
  const xAxis = chart.xAxis[0];
  const yAxis = chart.yAxis[0];
  grid.forEach((row, j) => {
    row.forEach((value, i) => {
      const frac = (value - gridMin) / (gridMax - gridMin);
      const x0 = xAxis.toPixels(lons[i] - halfDLon, false);
      const x1 = xAxis.toPixels(lons[i] + halfDLon, false);
      const y0 = yAxis.toPixels(lats[j] - halfDLat, false);
      const y1 = yAxis.toPixels(lats[j] + halfDLat, false);
      chart.renderer
        .rect(Math.min(x0, x1), Math.min(y0, y1), Math.abs(x1 - x0), Math.abs(y0 - y1))
        .attr({ fill: mixHex(t.seq[0], t.seq[1], frac), opacity: 0.85, zIndex: 0 })
        .add();
    });
  });
}

// --- Elevation color-scale legend (core Highcharts has no colorbar --------
// --- widget — drawn manually, same swatch idiom as a standard legend) ------
function drawElevationLegend(chart) {
  const barW = 22;
  const barH = 260;
  const barX = chart.plotLeft + chart.plotWidth + 46;
  const barY = chart.plotTop + 34;

  chart.renderer
    .rect(barX - 16, barY - 32, 150, barH + 66, 6)
    .attr({ fill: t.elevatedBg, stroke: t.inkSoft, "stroke-width": 1, zIndex: 6, opacity: 0.94 })
    .add();

  chart.renderer
    .text("Elevation", barX + 38, barY - 10)
    .attr({ align: "center", zIndex: 7 })
    .css({ color: t.ink, fontSize: "14px", fontWeight: "600" })
    .add();

  chart.renderer
    .rect(barX, barY, barW, barH)
    .attr({
      fill: {
        linearGradient: { x1: 0, y1: 1, x2: 0, y2: 0 },
        stops: [
          [0, t.seq[0]],
          [1, t.seq[1]],
        ],
      },
      stroke: t.inkSoft,
      "stroke-width": 1,
      zIndex: 7,
    })
    .add();

  [gridMax, (gridMax + gridMin) / 2, gridMin].forEach((value, idx) => {
    const y = barY + (barH * idx) / 2;
    chart.renderer
      .text(`${Math.round(value)} m`, barX + barW + 10, y + 4)
      .attr({ zIndex: 7 })
      .css({ color: t.inkSoft, fontSize: "12px" })
      .add();
  });
}

// --- Chart -------------------------------------------------------------------
Highcharts.chart("container", {
  chart: {
    type: "scatter",
    backgroundColor: "transparent",
    marginRight: 190,
    animation: false,
    style: { fontFamily: "inherit" },
    events: {
      load: function () {
        drawElevationRaster(this);
        drawElevationLegend(this);
      },
    },
  },
  credits: { enabled: false },
  title: {
    text: "contour-map-geographic · javascript · highcharts · anyplot.ai",
    style: { color: t.ink, fontSize: "22px", fontWeight: "600" },
  },
  subtitle: {
    text: "Synthetic alpine survey grid — elevation isolines every 300 m across four peak massifs",
    style: { color: t.inkSoft, fontSize: "14px" },
  },
  xAxis: {
    min: LON_MIN - halfDLon,
    max: LON_MAX + halfDLon,
    startOnTick: false,
    endOnTick: false,
    gridLineWidth: 0,
    lineColor: t.inkSoft,
    tickColor: t.inkSoft,
    title: { text: "Longitude (°E)", style: { color: t.inkSoft, fontSize: "16px" } },
    labels: { style: { color: t.inkSoft, fontSize: "14px" }, format: "{value:.1f}°" },
  },
  yAxis: {
    min: LAT_MIN - halfDLat,
    max: LAT_MAX + halfDLat,
    startOnTick: false,
    endOnTick: false,
    gridLineWidth: 0,
    lineColor: t.inkSoft,
    tickColor: t.inkSoft,
    title: { text: "Latitude (°N)", style: { color: t.inkSoft, fontSize: "16px" } },
    labels: { style: { color: t.inkSoft, fontSize: "14px" }, format: "{value:.1f}°" },
  },
  legend: {
    itemStyle: { color: t.inkSoft, fontSize: "14px" },
    itemHoverStyle: { color: t.ink },
  },
  plotOptions: {
    series: { animation: false, states: { hover: { enabled: false } } },
  },
  series: [boundarySeries, ridgelineSeries, peakSeries, ...contourSeries],
});
Runnable source as JSON, for any HTTP client: https://api.anyplot.ai/specs/contour-map-geographic/highcharts/code. Any spec id and library id listed in llms-full.txt fit the same URL shape; every URL below is complete and callable.
{
  "spec_id": "contour-map-geographic",
  "language": "javascript",
  "library": "highcharts",
  "page": "https://anyplot.ai/contour-map-geographic/javascript/highcharts",
  "hub": "https://anyplot.ai/contour-map-geographic",
  "code_json": "https://api.anyplot.ai/specs/contour-map-geographic/highcharts/code",
  "spec_json": "https://api.anyplot.ai/specs/contour-map-geographic",
  "render_light_png": "https://storage.googleapis.com/anyplot-images/plots/contour-map-geographic/javascript/highcharts/plot-light.png",
  "render_dark_png": "https://storage.googleapis.com/anyplot-images/plots/contour-map-geographic/javascript/highcharts/plot-dark.png",
  "interactive_light_html": "https://storage.googleapis.com/anyplot-images/plots/contour-map-geographic/javascript/highcharts/plot-light.html",
  "interactive_dark_html": "https://storage.googleapis.com/anyplot-images/plots/contour-map-geographic/javascript/highcharts/plot-dark.html",
  "quality_score": 90.0,
  "license": "MIT",
  "guide": "https://anyplot.ai/llms.txt"
}
Part of Contour Lines on Geographic Map on anyplot.ai.