The same plot in 14 other libraries — Python: Altair, Bokeh, lets-plot, Matplotlib, Plotly, plotnine, Pygal, Seaborn; R: ggplot2; JavaScript: Chart.js, D3.js, Apache ECharts, Highcharts, MUI X Charts. Compare all 15 side by side: Pharmacological Dose-Response Curve in Python, R, Julia and JavaScript.
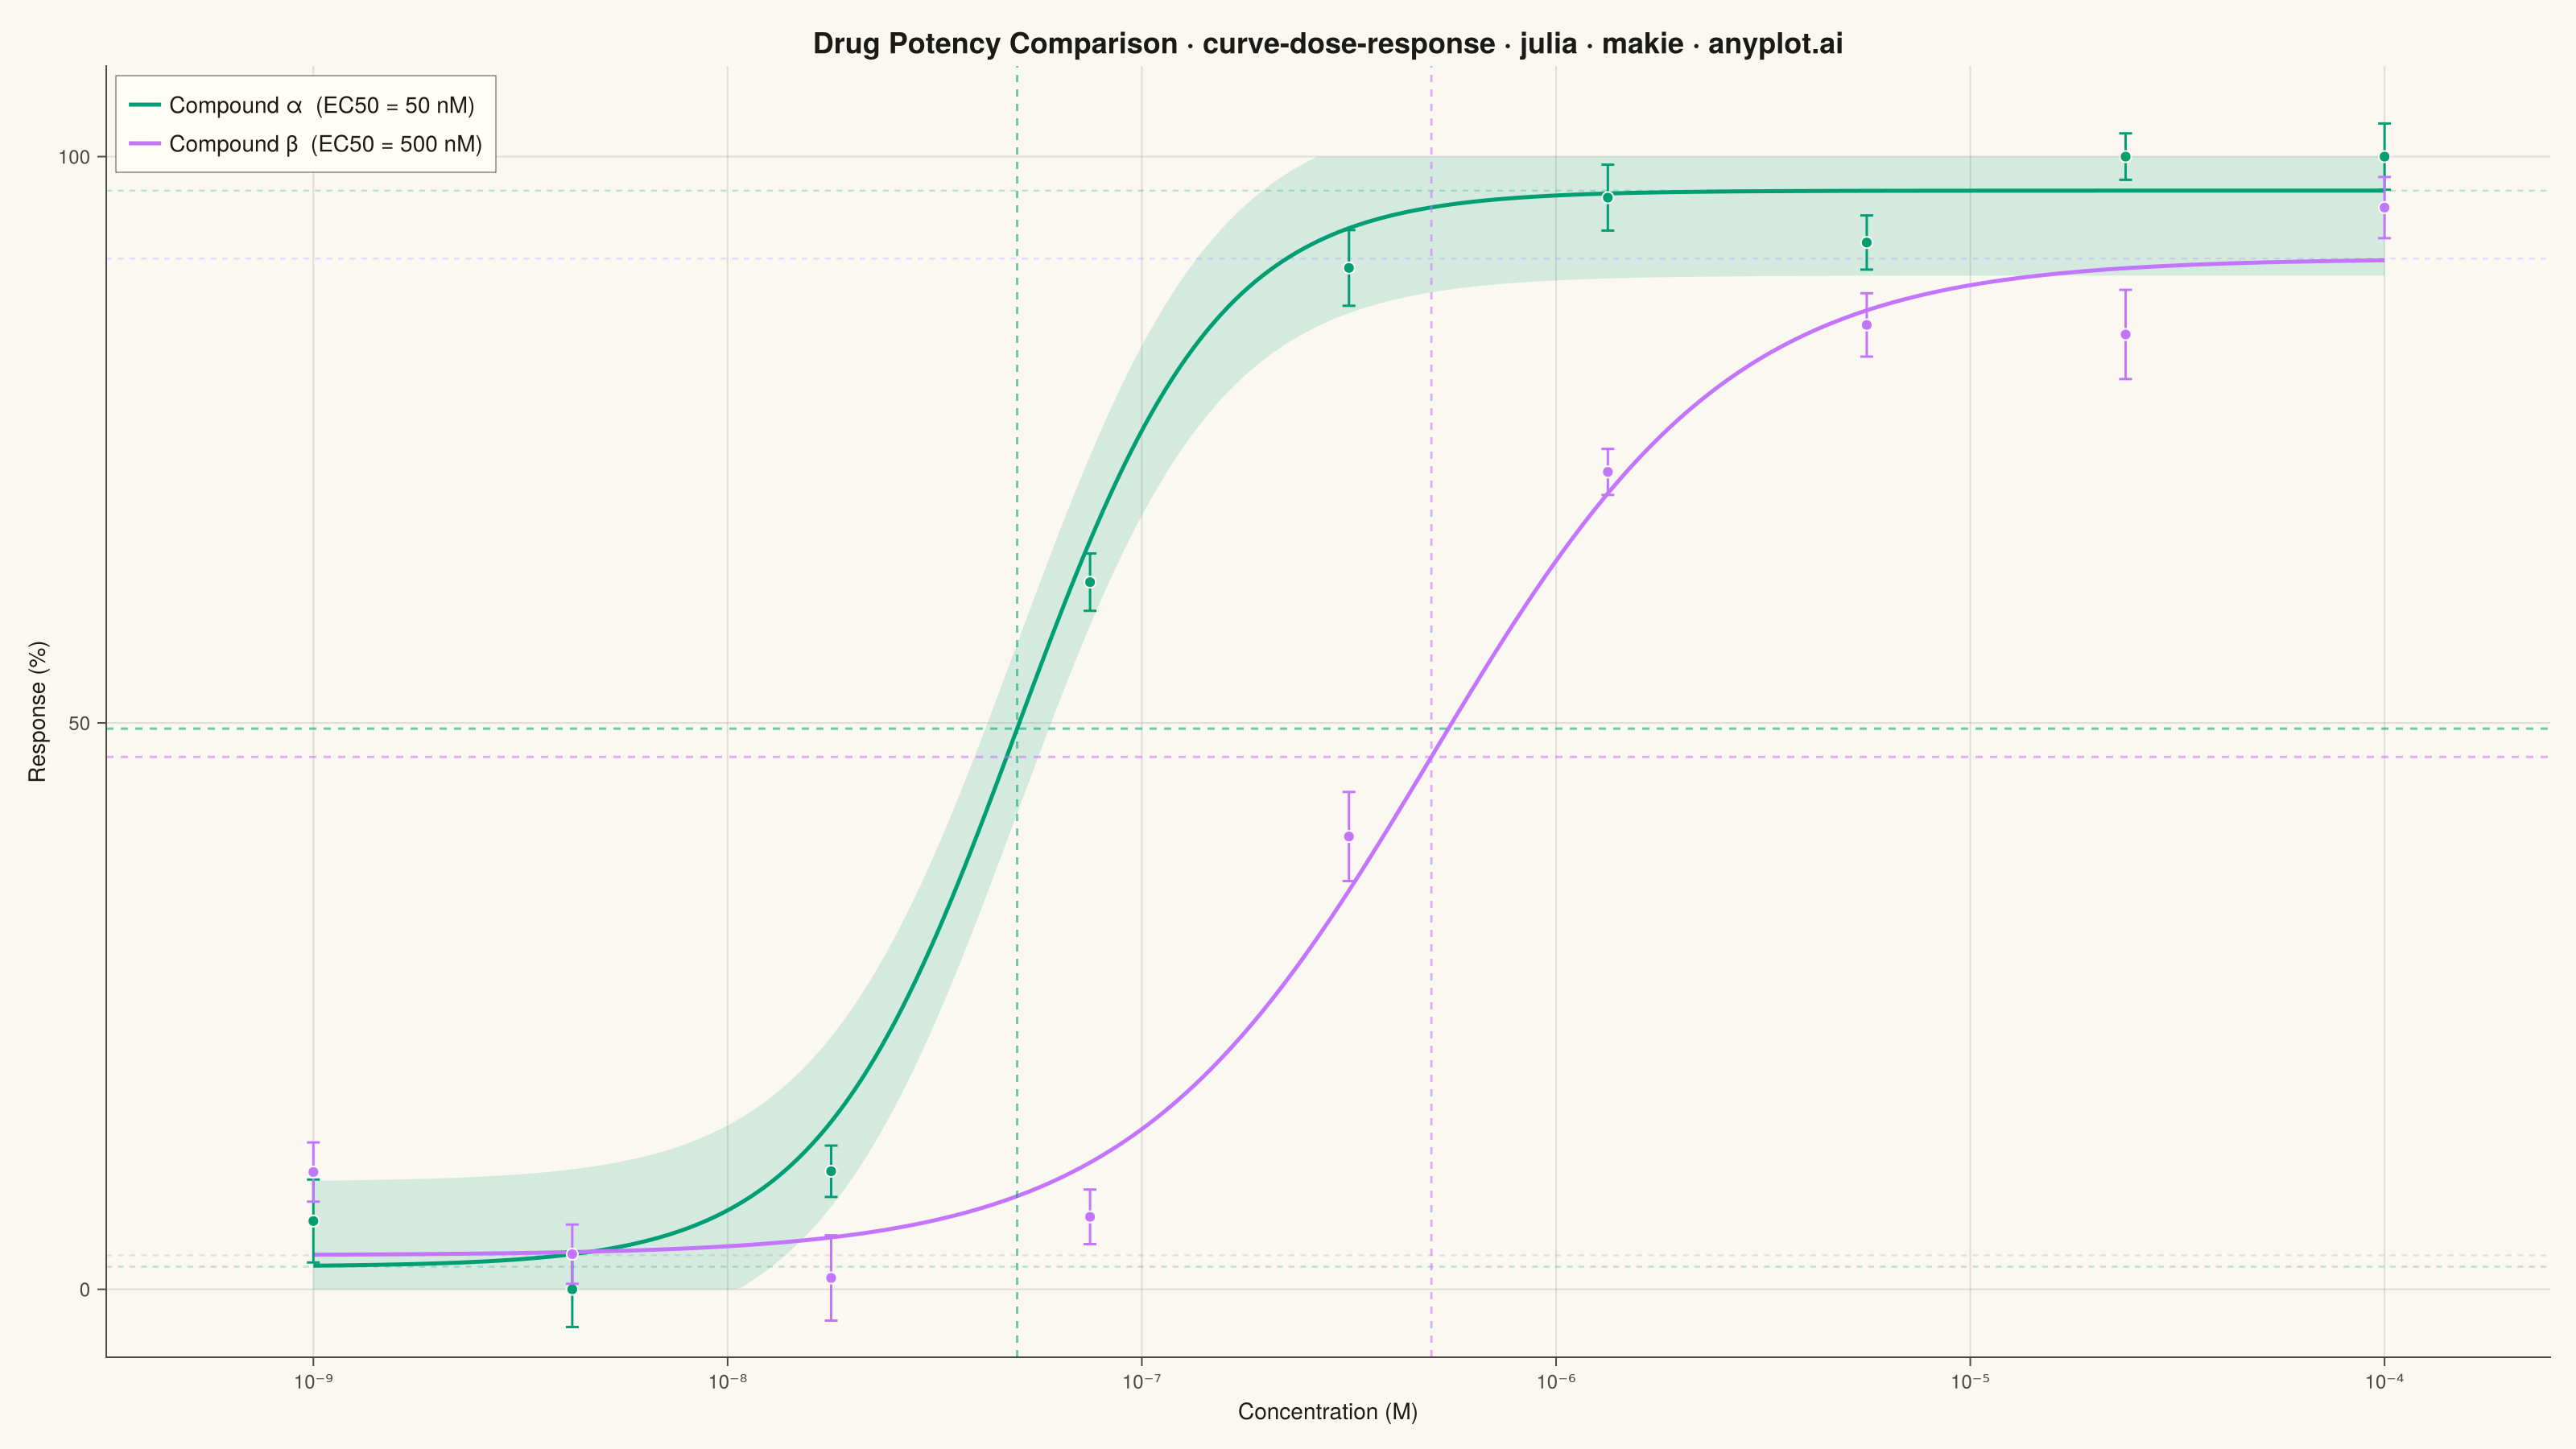
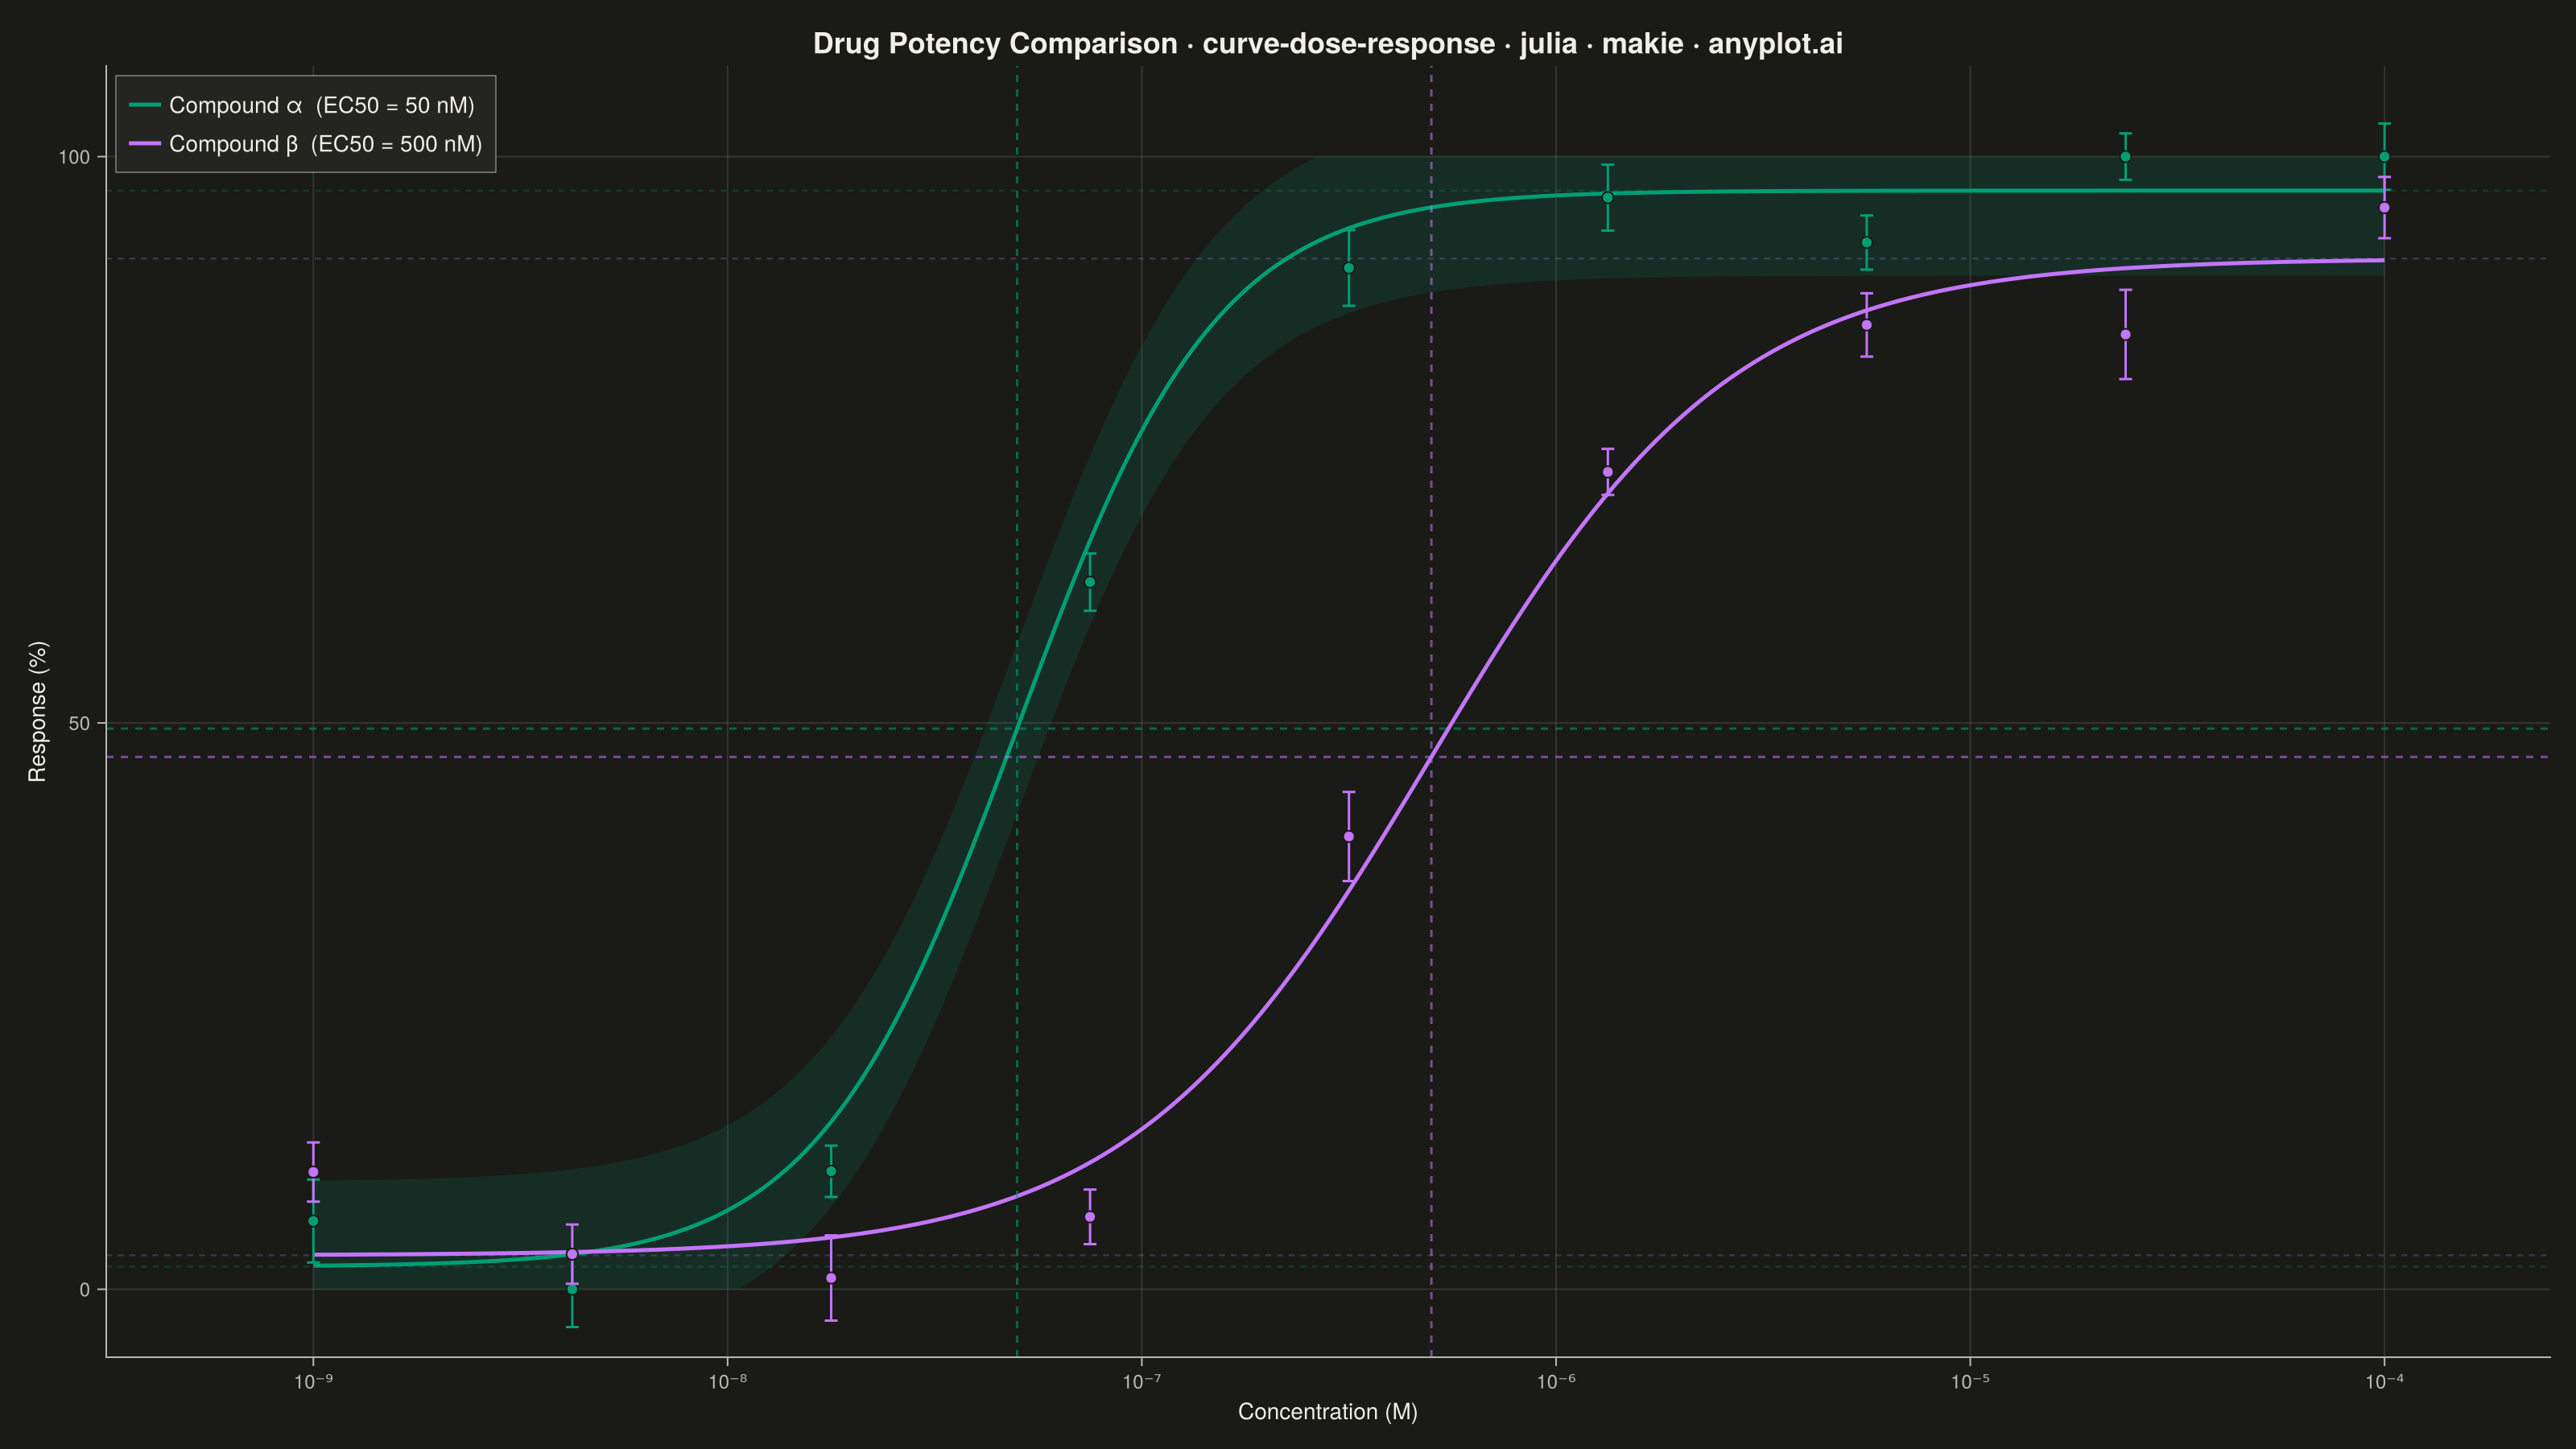
A sigmoidal dose-response curve that plots biological response against drug concentration on a logarithmic x-axis, fitted using a four-parameter logistic (4PL) model. This visualization is essential for determining drug potency metrics such as EC50 (half-maximal effective concentration) or IC50 (half-maximal inhibitory concentration), Hill slope steepness, and upper/lower response asymptotes. It enables rapid visual comparison of compound efficacy and is a standard tool in pharmacological analysis.
# anyplot.ai
# curve-dose-response: Pharmacological Dose-Response Curve
# Library: makie 0.22.10 | Julia 1.11.9
# Quality: 90/100 | Created: 2026-06-24

using CairoMakie
using Colors
using Random

Random.seed!(42)

# Theme tokens
const THEME       = get(ENV, "ANYPLOT_THEME", "light")
const PAGE_BG     = THEME == "light" ? colorant"#FAF8F1" : colorant"#1A1A17"
const ELEVATED_BG = THEME == "light" ? colorant"#FFFDF6" : colorant"#242420"
const INK         = THEME == "light" ? colorant"#1A1A17" : colorant"#F0EFE8"
const INK_SOFT    = THEME == "light" ? colorant"#4A4A44" : colorant"#B8B7B0"

const IMPRINT_PALETTE = [
    colorant"#009E73",
    colorant"#C475FD",
    colorant"#4467A3",
    colorant"#BD8233",
    colorant"#AE3030",
    colorant"#2ABCCD",
    colorant"#954477",
    colorant"#99B314",
]

# 4PL sigmoid: Bottom + (Top - Bottom) / (1 + (EC50/x)^hill)
function four_pl(x, bottom, top, ec50, hill)
    return bottom + (top - bottom) / (1.0 + (ec50 / x)^hill)
end

# Compound A — potent, steep sigmoid (EC50 = 50 nM)
const BOTTOM_A = 2.0
const TOP_A    = 97.0
const EC50_A   = 50e-9
const HILL_A   = 1.8

# Compound B — moderate potency, shallower (EC50 = 500 nM)
const BOTTOM_B = 3.0
const TOP_B    = 91.0
const EC50_B   = 500e-9
const HILL_B   = 1.2

# Experimental data: 9 concentration points from 1e-9 to 1e-4 M
conc_data     = exp10.(range(-9.0, -4.0, length=9))
log_conc_data = log10.(conc_data)

response_a = clamp.([four_pl(c, BOTTOM_A, TOP_A, EC50_A, HILL_A) + 5.0 * randn() for c in conc_data], 0.0, 100.0)
sem_a      = 2.0 .+ rand(9) .* 2.0

response_b = clamp.([four_pl(c, BOTTOM_B, TOP_B, EC50_B, HILL_B) + 5.0 * randn() for c in conc_data], 0.0, 100.0)
sem_b      = 2.0 .+ rand(9) .* 2.0

# Smooth fitted curves (300 points for visual smoothness)
conc_fit     = exp10.(range(-9.0, -4.0, length=300))
log_conc_fit = log10.(conc_fit)
curve_a      = [four_pl(c, BOTTOM_A, TOP_A, EC50_A, HILL_A) for c in conc_fit]
curve_b      = [four_pl(c, BOTTOM_B, TOP_B, EC50_B, HILL_B) for c in conc_fit]

# 95% CI band for Compound A (approximate fixed half-width)
ci_upper_a = clamp.(curve_a .+ 7.5, 0.0, 100.0)
ci_lower_a = clamp.(curve_a .- 7.5, 0.0, 100.0)

# EC50 reference positions
log_ec50_a = log10(EC50_A)
log_ec50_b = log10(EC50_B)
half_max_a = BOTTOM_A + (TOP_A - BOTTOM_A) / 2.0
half_max_b = BOTTOM_B + (TOP_B - BOTTOM_B) / 2.0

# Title font sizing — scale down for long titles
title_str = "Drug Potency Comparison · curve-dose-response · julia · makie · anyplot.ai"
titlesize = max(13, round(Int, 20 * min(1.0, 67 / length(title_str))))

# Figure
fig = Figure(
    resolution      = (1600, 900),
    fontsize        = 14,
    backgroundcolor = PAGE_BG,
)

ax = Axis(
    fig[1, 1];
    title              = title_str,
    titlesize          = titlesize,
    titlecolor         = INK,
    xlabel             = "Concentration (M)",
    ylabel             = "Response (%)",
    xlabelsize         = 14,
    ylabelsize         = 14,
    xlabelcolor        = INK,
    ylabelcolor        = INK,
    xticklabelsize     = 12,
    yticklabelsize     = 12,
    xticklabelcolor    = INK_SOFT,
    yticklabelcolor    = INK_SOFT,
    xtickcolor         = INK_SOFT,
    ytickcolor         = INK_SOFT,
    backgroundcolor    = PAGE_BG,
    topspinevisible    = false,
    rightspinevisible  = false,
    leftspinecolor     = INK_SOFT,
    bottomspinecolor   = INK_SOFT,
    xgridcolor         = RGBAf(INK.r, INK.g, INK.b, 0.12),
    ygridcolor         = RGBAf(INK.r, INK.g, INK.b, 0.12),
    xminorgridvisible  = false,
    yminorgridvisible  = false,
    xticks             = ([-9.0, -8.0, -7.0, -6.0, -5.0, -4.0], ["10⁻⁹", "10⁻⁸", "10⁻⁷", "10⁻⁶", "10⁻⁵", "10⁻⁴"]),
)

xlims!(ax, -9.5, -3.6)
ylims!(ax, -6.0, 108.0)

# Asymptote reference lines (top and bottom plateaus)
hlines!(ax, [TOP_A, BOTTOM_A]; color = (IMPRINT_PALETTE[1], 0.25), linestyle = :dash, linewidth = 1.2)
hlines!(ax, [TOP_B, BOTTOM_B]; color = (IMPRINT_PALETTE[2], 0.25), linestyle = :dash, linewidth = 1.2)

# 95% CI band for Compound A
band!(ax, log_conc_fit, ci_lower_a, ci_upper_a; color = (IMPRINT_PALETTE[1], 0.15))

# Fitted sigmoid curves
lines!(ax, log_conc_fit, curve_a;
    color = IMPRINT_PALETTE[1], linewidth = 2.5,
    label = "Compound α  (EC50 = 50 nM)")
lines!(ax, log_conc_fit, curve_b;
    color = IMPRINT_PALETTE[2], linewidth = 2.5,
    label = "Compound β  (EC50 = 500 nM)")

# EC50 reference lines — vertical and horizontal dashed
vlines!(ax, [log_ec50_a]; color = (IMPRINT_PALETTE[1], 0.55), linestyle = :dash, linewidth = 1.5)
vlines!(ax, [log_ec50_b]; color = (IMPRINT_PALETTE[2], 0.55), linestyle = :dash, linewidth = 1.5)
hlines!(ax, [half_max_a]; color = (IMPRINT_PALETTE[1], 0.55), linestyle = :dash, linewidth = 1.5)
hlines!(ax, [half_max_b]; color = (IMPRINT_PALETTE[2], 0.55), linestyle = :dash, linewidth = 1.5)

# Error bars and experimental data markers
errorbars!(ax, log_conc_data, response_a, sem_a;
    color = IMPRINT_PALETTE[1], linewidth = 1.5, whiskerwidth = 8)
scatter!(ax, log_conc_data, response_a;
    color = IMPRINT_PALETTE[1], markersize = 10,
    strokewidth = 1.0, strokecolor = PAGE_BG)

errorbars!(ax, log_conc_data, response_b, sem_b;
    color = IMPRINT_PALETTE[2], linewidth = 1.5, whiskerwidth = 8)
scatter!(ax, log_conc_data, response_b;
    color = IMPRINT_PALETTE[2], markersize = 10,
    strokewidth = 1.0, strokecolor = PAGE_BG)

# Legend (upper-left)
axislegend(ax;
    position        = :lt,
    backgroundcolor = ELEVATED_BG,
    labelcolor      = INK,
    framecolor      = INK_SOFT,
    framewidth      = 0.5,
    padding         = (8, 8, 8, 8),
    rowgap          = 4,
)

save("plot-$(THEME).png", fig; px_per_unit = 2)
Runnable source as JSON, for any HTTP client: https://api.anyplot.ai/specs/curve-dose-response/makie/code. Any spec id and library id listed in llms-full.txt fit the same URL shape; every URL below is complete and callable.
{
  "spec_id": "curve-dose-response",
  "language": "julia",
  "library": "makie",
  "page": "https://anyplot.ai/curve-dose-response/julia/makie",
  "hub": "https://anyplot.ai/curve-dose-response",
  "code_json": "https://api.anyplot.ai/specs/curve-dose-response/makie/code",
  "spec_json": "https://api.anyplot.ai/specs/curve-dose-response",
  "render_light_png": "https://storage.googleapis.com/anyplot-images/plots/curve-dose-response/julia/makie/plot-light.png",
  "render_dark_png": "https://storage.googleapis.com/anyplot-images/plots/curve-dose-response/julia/makie/plot-dark.png",
  "quality_score": 90.0,
  "license": "MIT",
  "guide": "https://anyplot.ai/llms.txt"
}
Part of Pharmacological Dose-Response Curve on anyplot.ai.