The same plot in 14 other libraries — JavaScript: D3.js, Apache ECharts, Highcharts, MUI X Charts; Python: Altair, Bokeh, lets-plot, Matplotlib, Plotly, plotnine, Pygal, Seaborn; R: ggplot2; Julia: Makie.jl. Compare all 15 side by side: Basic Donut Chart in Python, R, Julia and JavaScript.
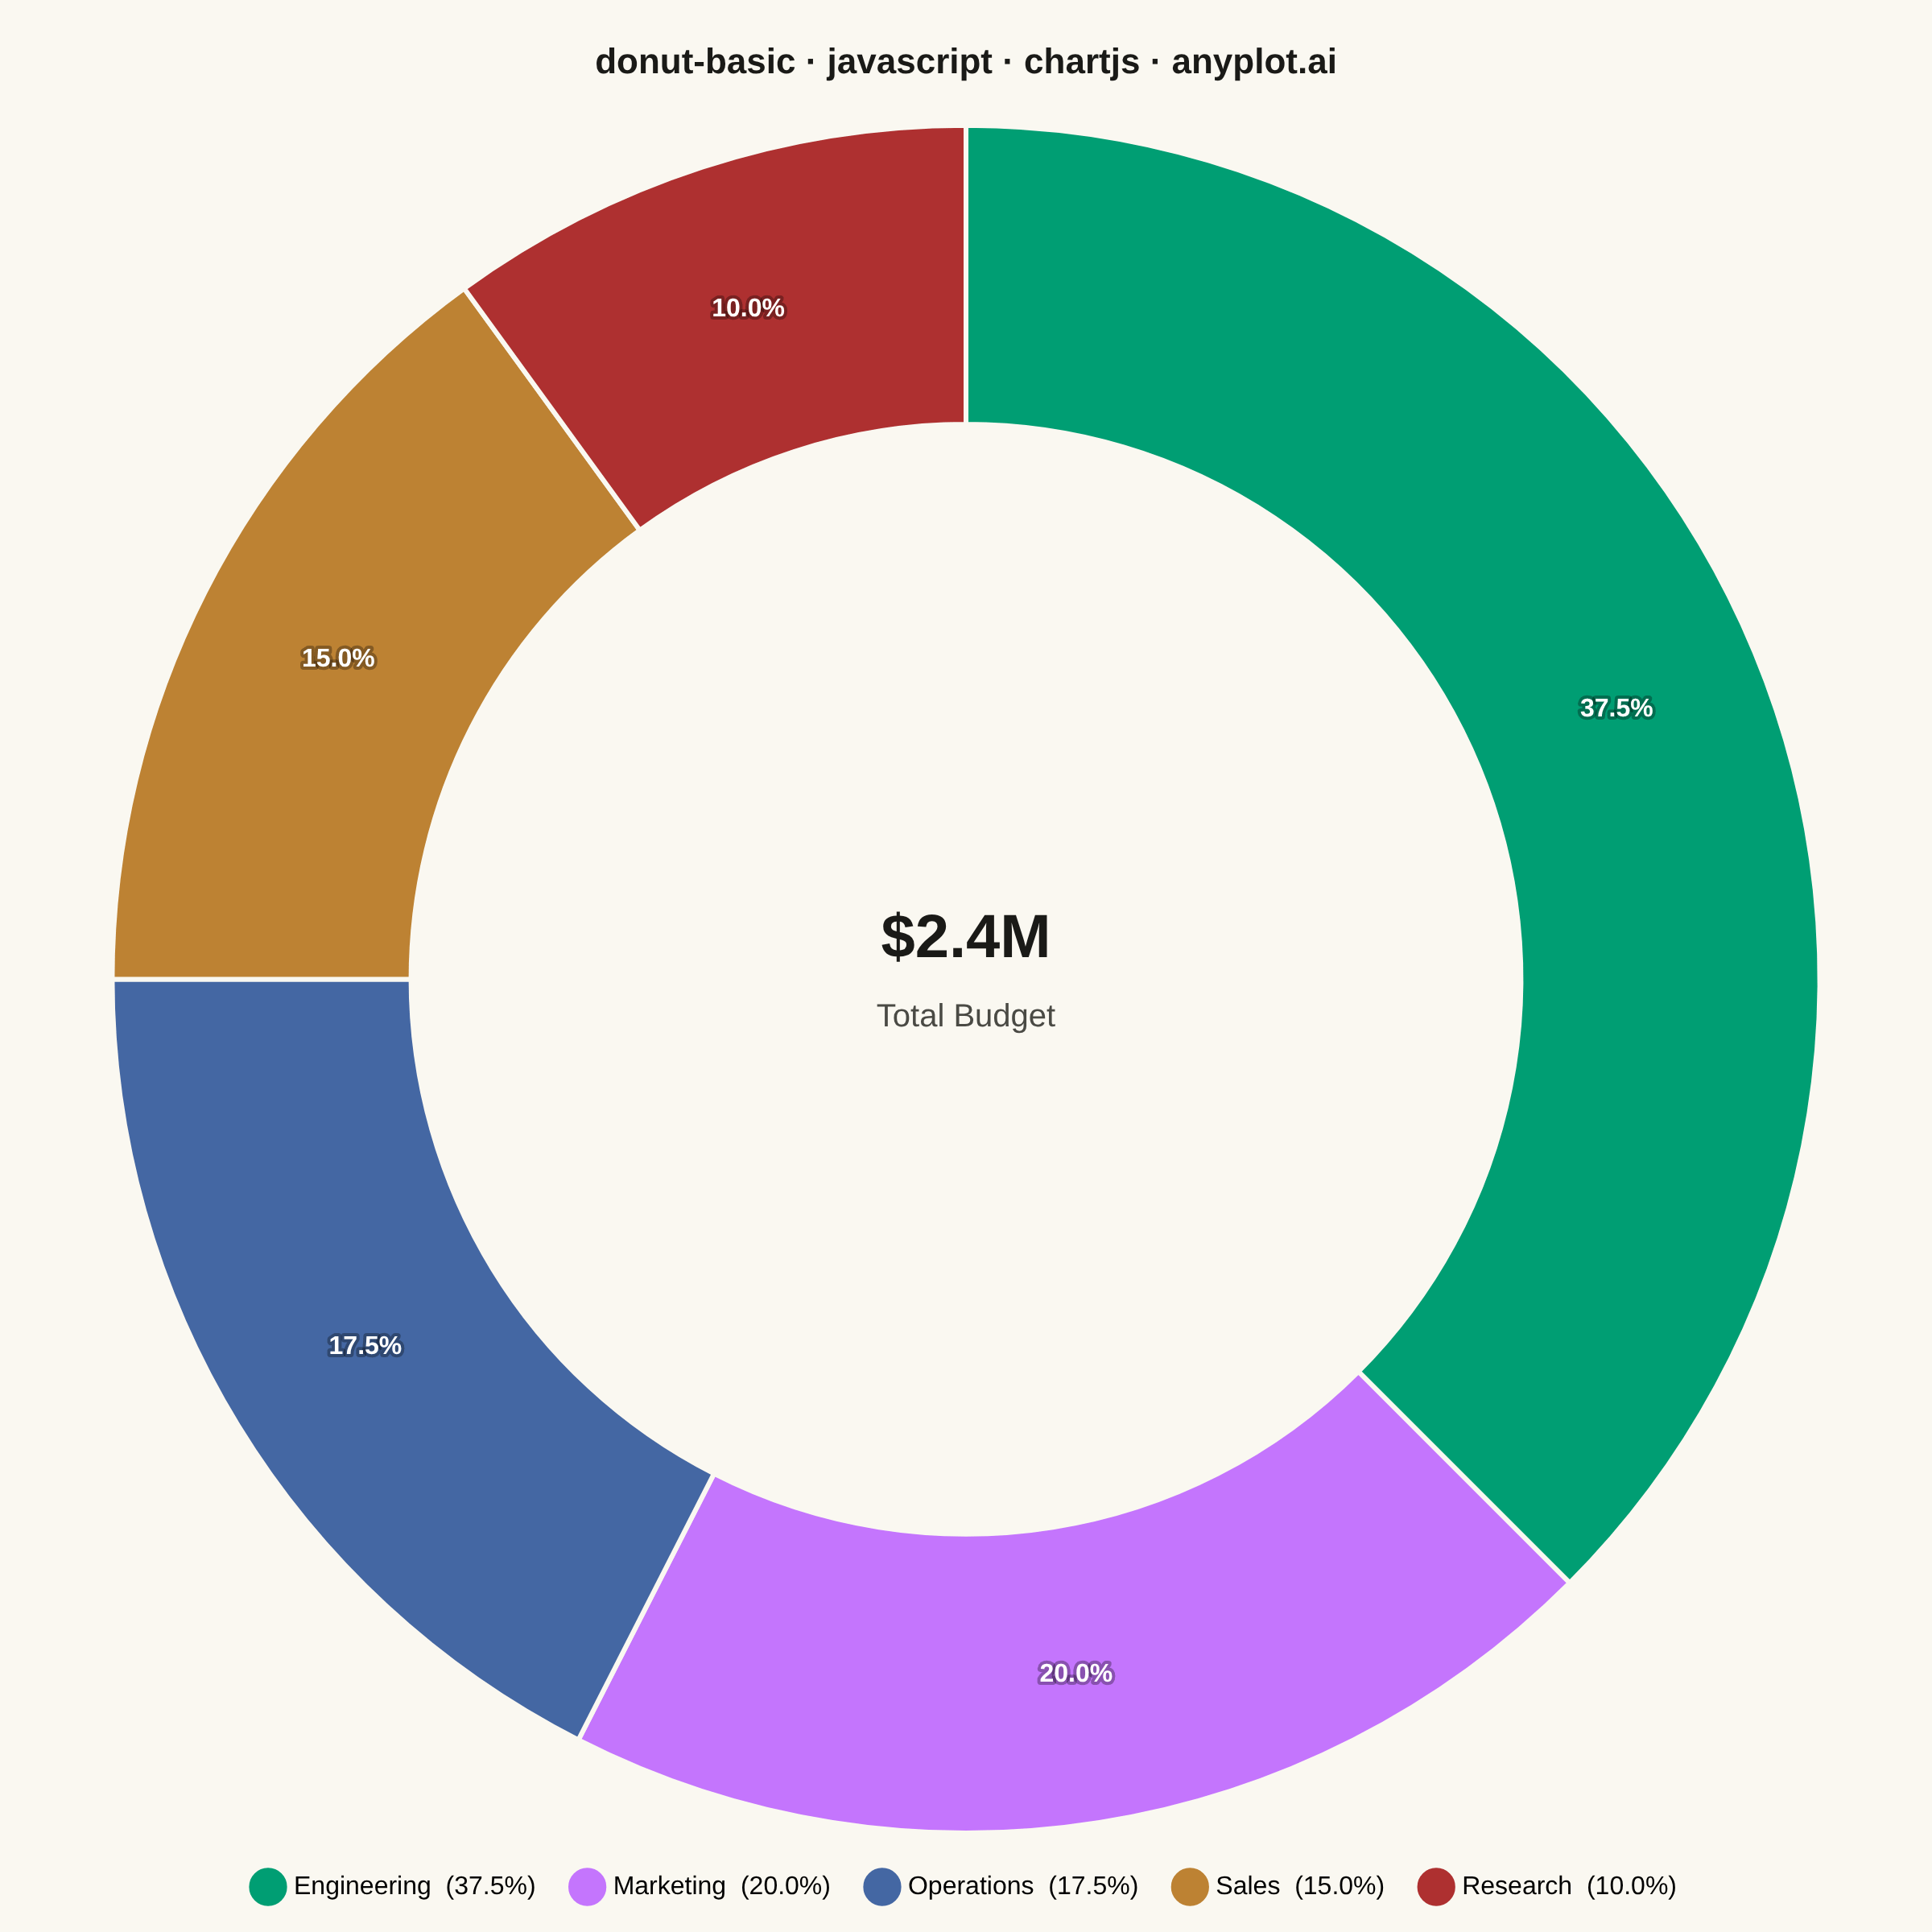
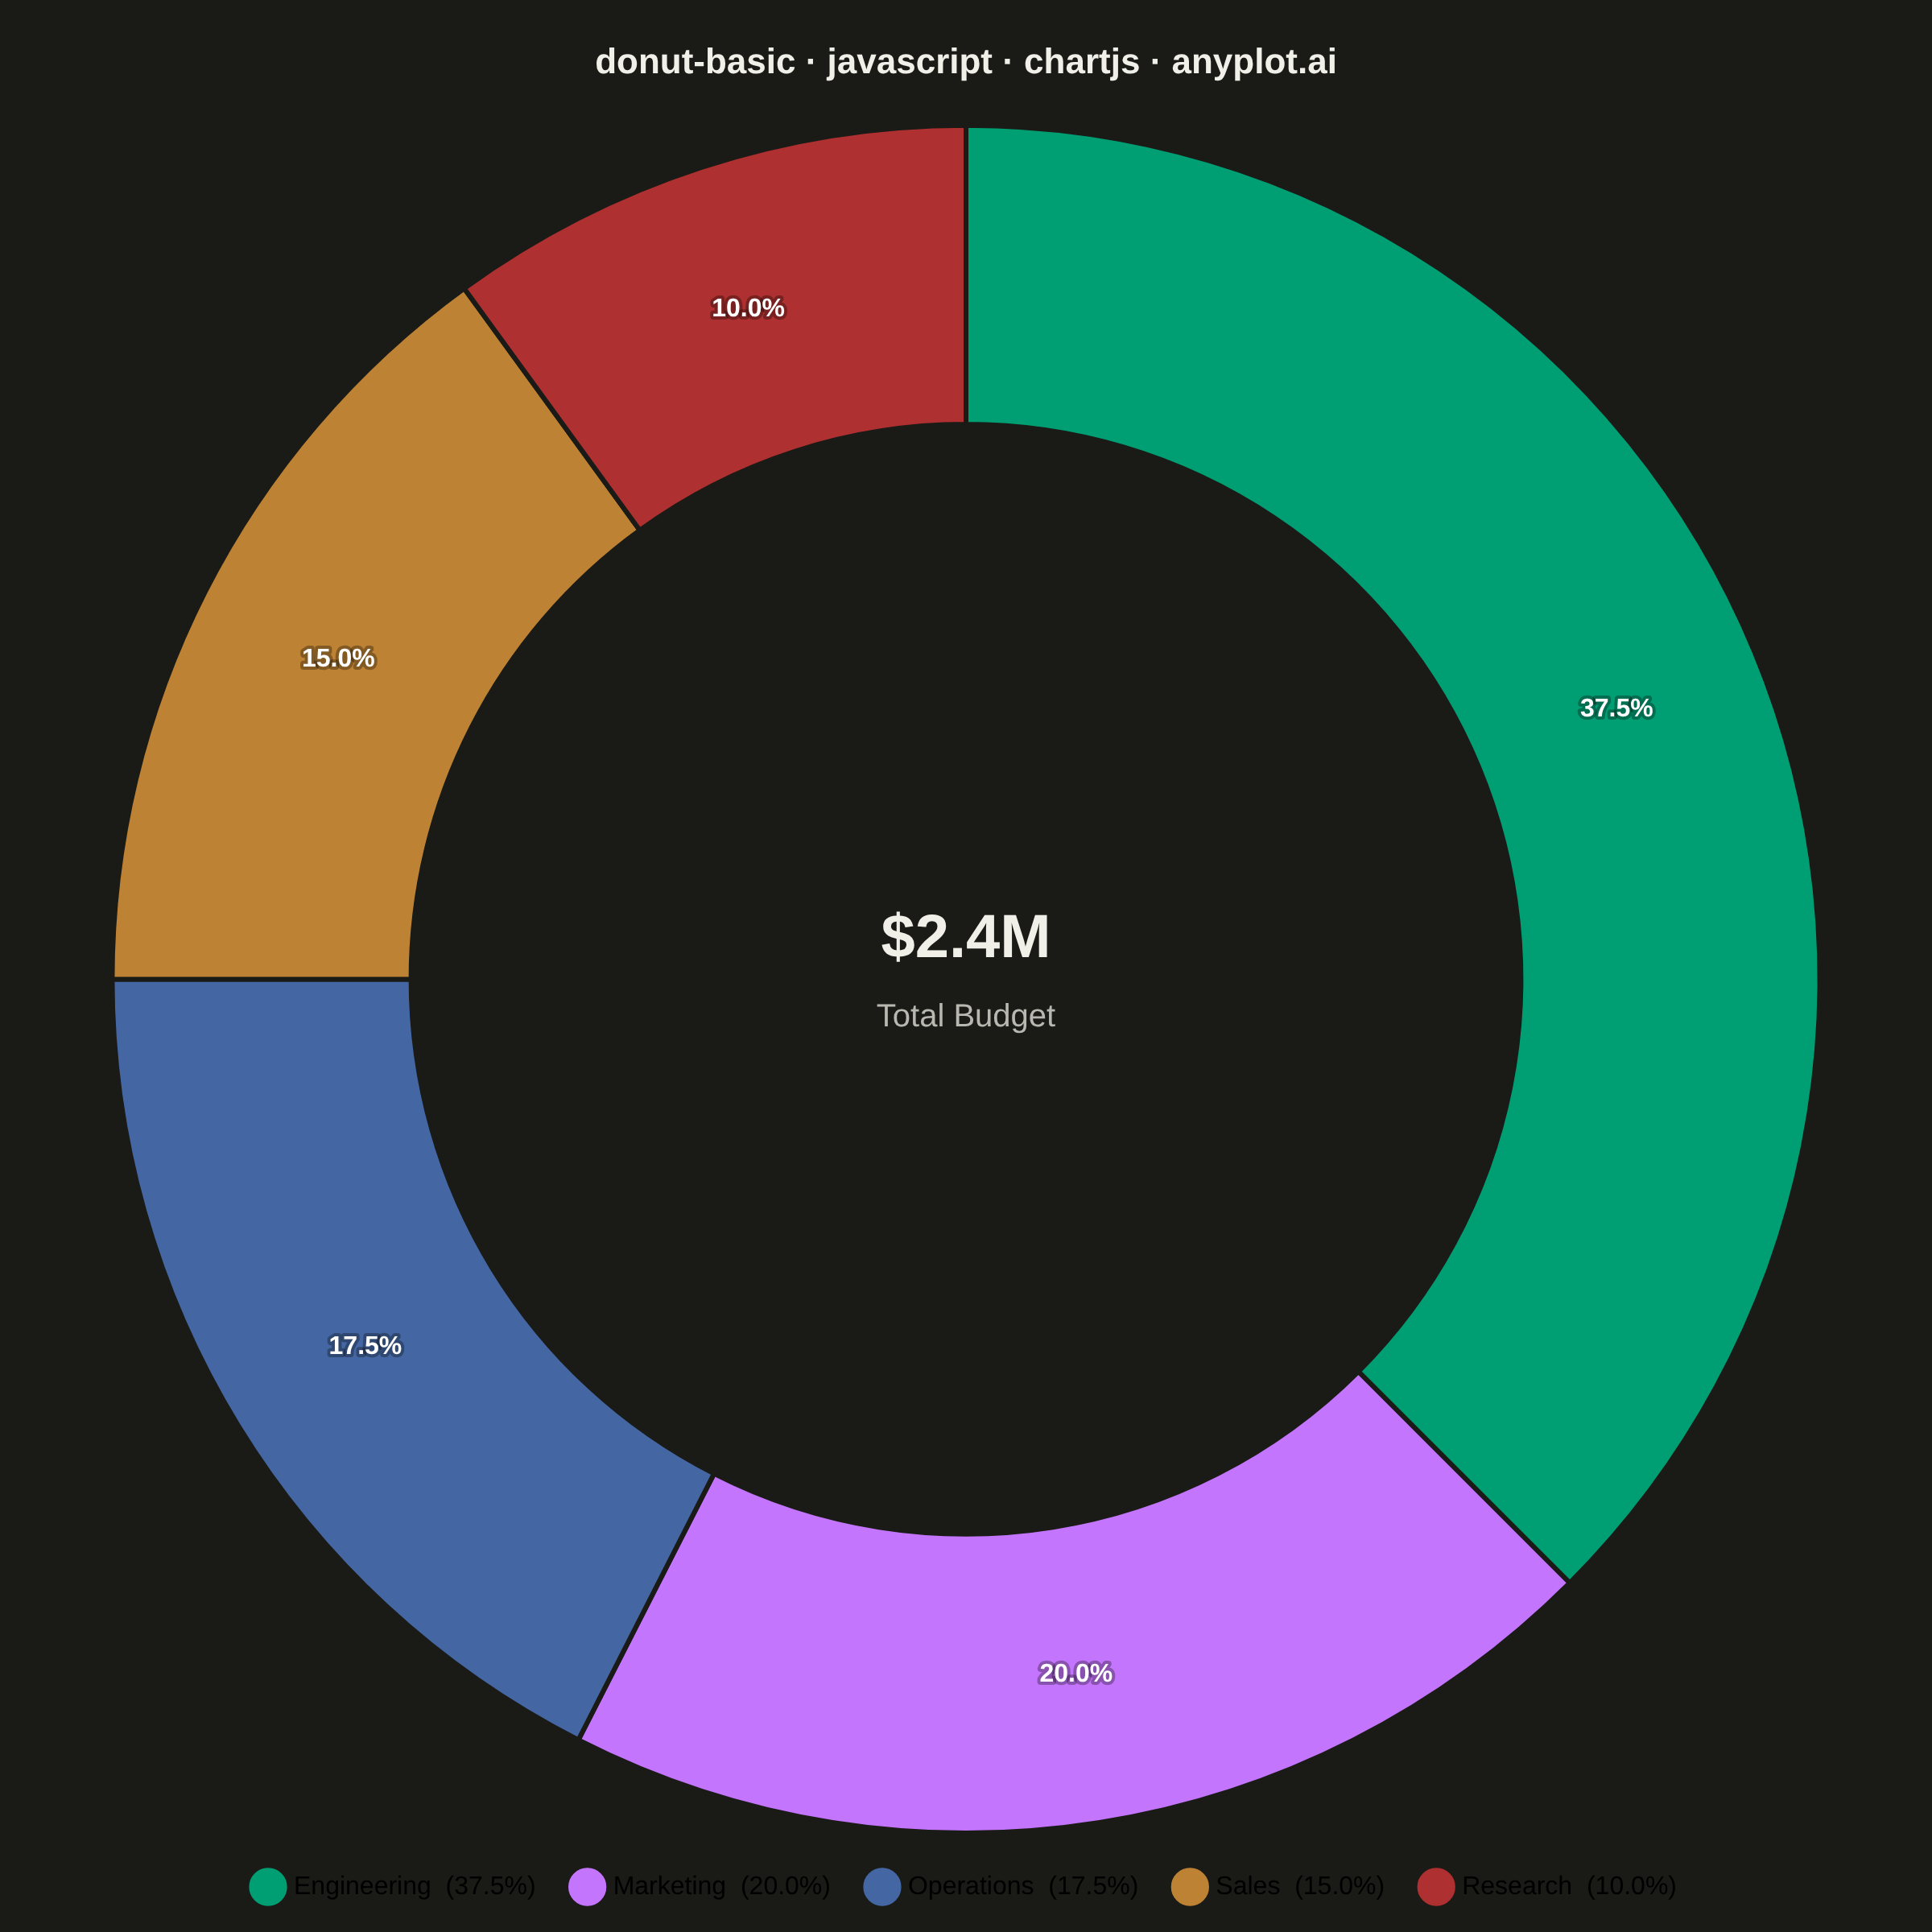
A donut chart (ring chart) showing proportions of categorical data as segments of a ring, with a hollow center. Similar to pie charts but the empty center can display summary statistics or additional information. The ring format can be easier to read when comparing segment sizes.
// anyplot.ai
// donut-basic: Basic Donut Chart
// Library: chartjs 4.4.7 | JavaScript 22.23.0
// Quality: 93/100 | Created: 2026-06-25
//# anyplot-orientation: square

const t = window.ANYPLOT_TOKENS;

// --- Data -------------------------------------------------------------------
const departments = ['Engineering', 'Marketing', 'Operations', 'Sales', 'Research'];
const budgets = [900000, 480000, 420000, 360000, 240000]; // total: 2,400,000
const total = budgets.reduce((a, b) => a + b, 0);

// --- Center label plugin ----------------------------------------------------
const centerPlugin = {
  id: 'centerLabel',
  afterDraw(chart) {
    const { ctx, chartArea } = chart;
    const cx = chartArea.left + chartArea.width / 2;
    const cy = chartArea.top + chartArea.height / 2;
    ctx.save();
    ctx.textAlign = 'center';
    ctx.textBaseline = 'middle';
    ctx.font = 'bold 38px sans-serif';
    ctx.fillStyle = t.ink;
    ctx.fillText('$2.4M', cx, cy - 24);
    ctx.font = '20px sans-serif';
    ctx.fillStyle = t.inkSoft;
    ctx.fillText('Total Budget', cx, cy + 24);
    ctx.restore();
  },
};

// --- Segment percentage label plugin ----------------------------------------
const segmentLabelsPlugin = {
  id: 'segmentLabels',
  afterDraw(chart) {
    const { ctx } = chart;
    const meta = chart.getDatasetMeta(0);
    meta.data.forEach((arc, i) => {
      const pct = ((budgets[i] / total) * 100).toFixed(1) + '%';
      const midAngle = (arc.startAngle + arc.endAngle) / 2;
      const r = (arc.innerRadius + arc.outerRadius) / 2;
      const x = arc.x + Math.cos(midAngle) * r;
      const y = arc.y + Math.sin(midAngle) * r;
      ctx.save();
      ctx.textAlign = 'center';
      ctx.textBaseline = 'middle';
      ctx.font = 'bold 16px sans-serif';
      ctx.strokeStyle = 'rgba(0,0,0,0.3)';
      ctx.lineWidth = 4;
      ctx.lineJoin = 'round';
      ctx.strokeText(pct, x, y);
      ctx.fillStyle = '#FFFFFF';
      ctx.fillText(pct, x, y);
      ctx.restore();
    });
  },
};

// --- Mount ------------------------------------------------------------------
const canvas = document.createElement('canvas');
document.getElementById('container').appendChild(canvas);

// --- Chart ------------------------------------------------------------------
new Chart(canvas, {
  type: 'doughnut',
  plugins: [centerPlugin, segmentLabelsPlugin],
  data: {
    labels: departments,
    datasets: [{
      data: budgets,
      backgroundColor: departments.map((_, i) => t.palette[i]),
      borderWidth: 3,
      borderColor: t.pageBg,
      hoverOffset: 0,
    }],
  },
  options: {
    responsive: true,
    maintainAspectRatio: false,
    animation: false,
    cutout: '65%',
    layout: { padding: { top: 10, bottom: 10, left: 20, right: 20 } },
    plugins: {
      title: {
        display: true,
        text: 'donut-basic · javascript · chartjs · anyplot.ai',
        color: t.ink,
        font: { size: 22, weight: 'bold' },
        padding: { top: 16, bottom: 24 },
      },
      legend: {
        position: 'bottom',
        labels: {
          color: t.ink,
          font: { size: 16 },
          padding: 24,
          usePointStyle: true,
          generateLabels(chart) {
            return chart.data.labels.map((label, i) => ({
              text: `${label}  (${((budgets[i] / total) * 100).toFixed(1)}%)`,
              fillStyle: t.palette[i],
              strokeStyle: t.palette[i],
              hidden: false,
              index: i,
              datasetIndex: 0,
            }));
          },
        },
      },
    },
  },
});
Runnable source as JSON, for any HTTP client: https://api.anyplot.ai/specs/donut-basic/chartjs/code. Any spec id and library id listed in llms-full.txt fit the same URL shape; every URL below is complete and callable.
{
  "spec_id": "donut-basic",
  "language": "javascript",
  "library": "chartjs",
  "page": "https://anyplot.ai/donut-basic/javascript/chartjs",
  "hub": "https://anyplot.ai/donut-basic",
  "code_json": "https://api.anyplot.ai/specs/donut-basic/chartjs/code",
  "spec_json": "https://api.anyplot.ai/specs/donut-basic",
  "render_light_png": "https://storage.googleapis.com/anyplot-images/plots/donut-basic/javascript/chartjs/plot-light.png",
  "render_dark_png": "https://storage.googleapis.com/anyplot-images/plots/donut-basic/javascript/chartjs/plot-dark.png",
  "interactive_light_html": "https://storage.googleapis.com/anyplot-images/plots/donut-basic/javascript/chartjs/plot-light.html",
  "interactive_dark_html": "https://storage.googleapis.com/anyplot-images/plots/donut-basic/javascript/chartjs/plot-dark.html",
  "quality_score": 93.0,
  "license": "MIT",
  "guide": "https://anyplot.ai/llms.txt"
}
Part of Basic Donut Chart on anyplot.ai.