The same plot in 14 other libraries — JavaScript: Chart.js, D3.js, Apache ECharts, MUI X Charts; Python: Altair, Bokeh, lets-plot, Matplotlib, Plotly, plotnine, Pygal, Seaborn; R: ggplot2; Julia: Makie.jl. Compare all 15 side by side: Basic Donut Chart in Python, R, Julia and JavaScript.
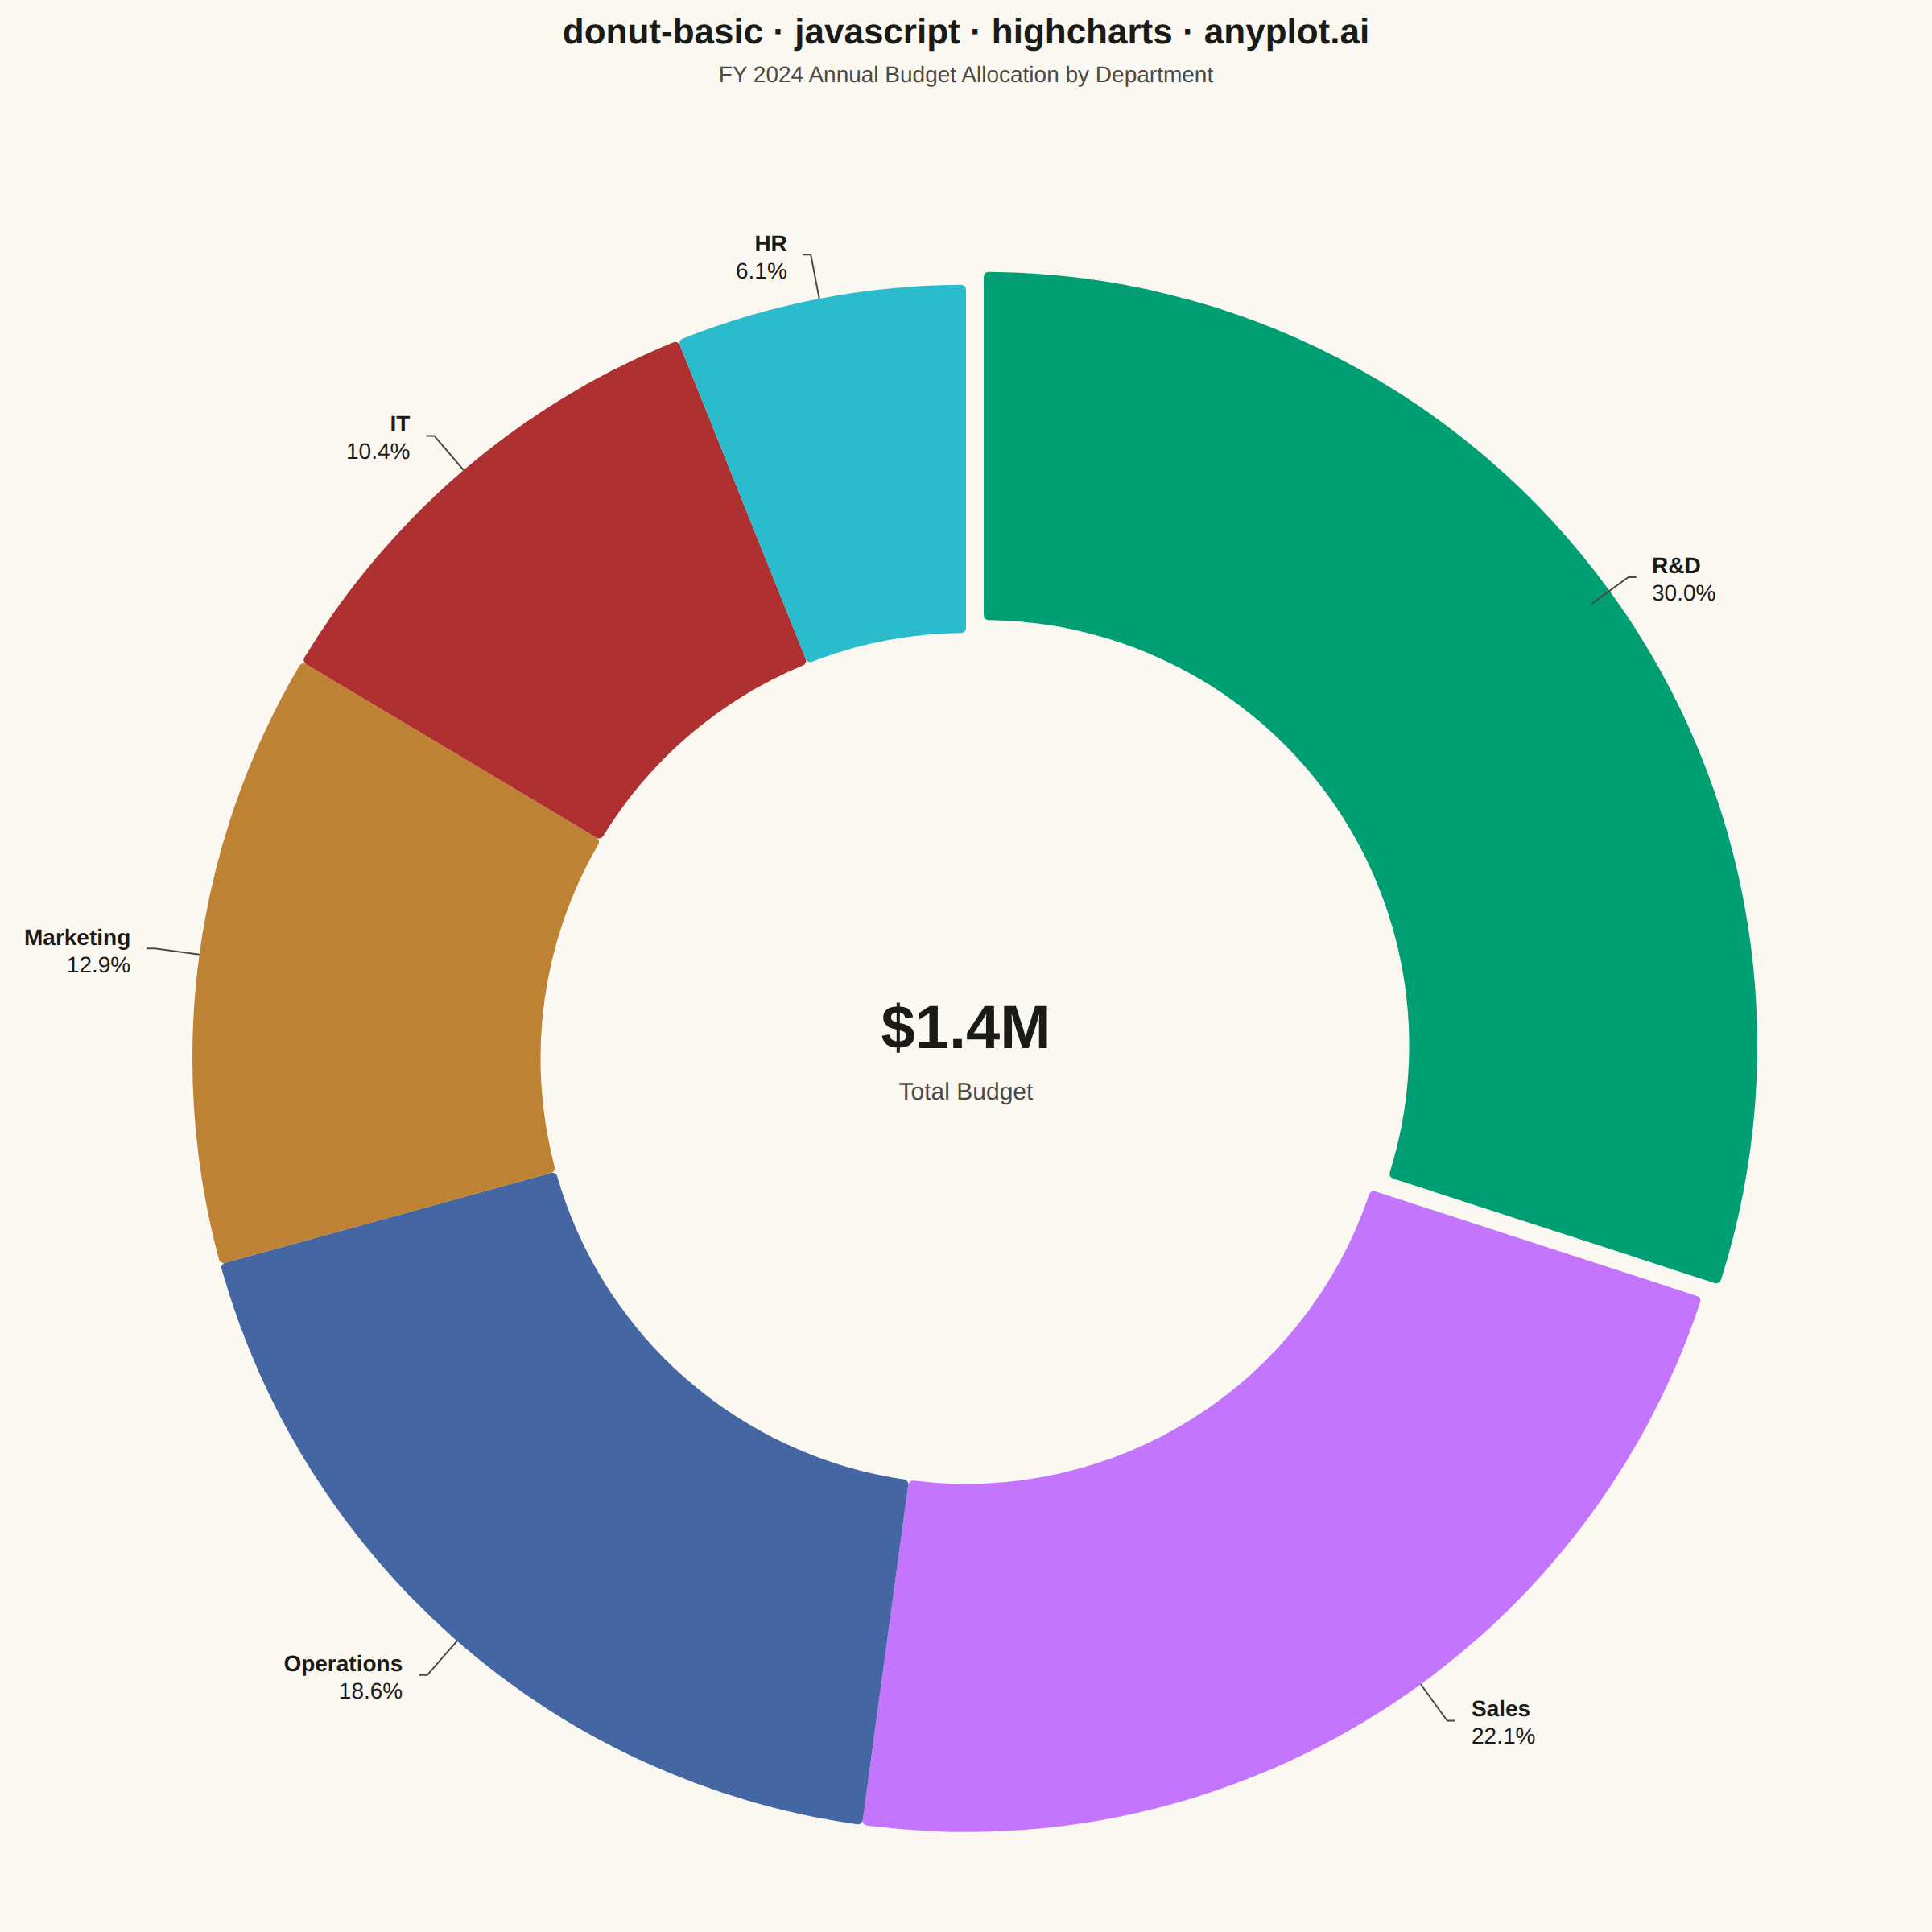
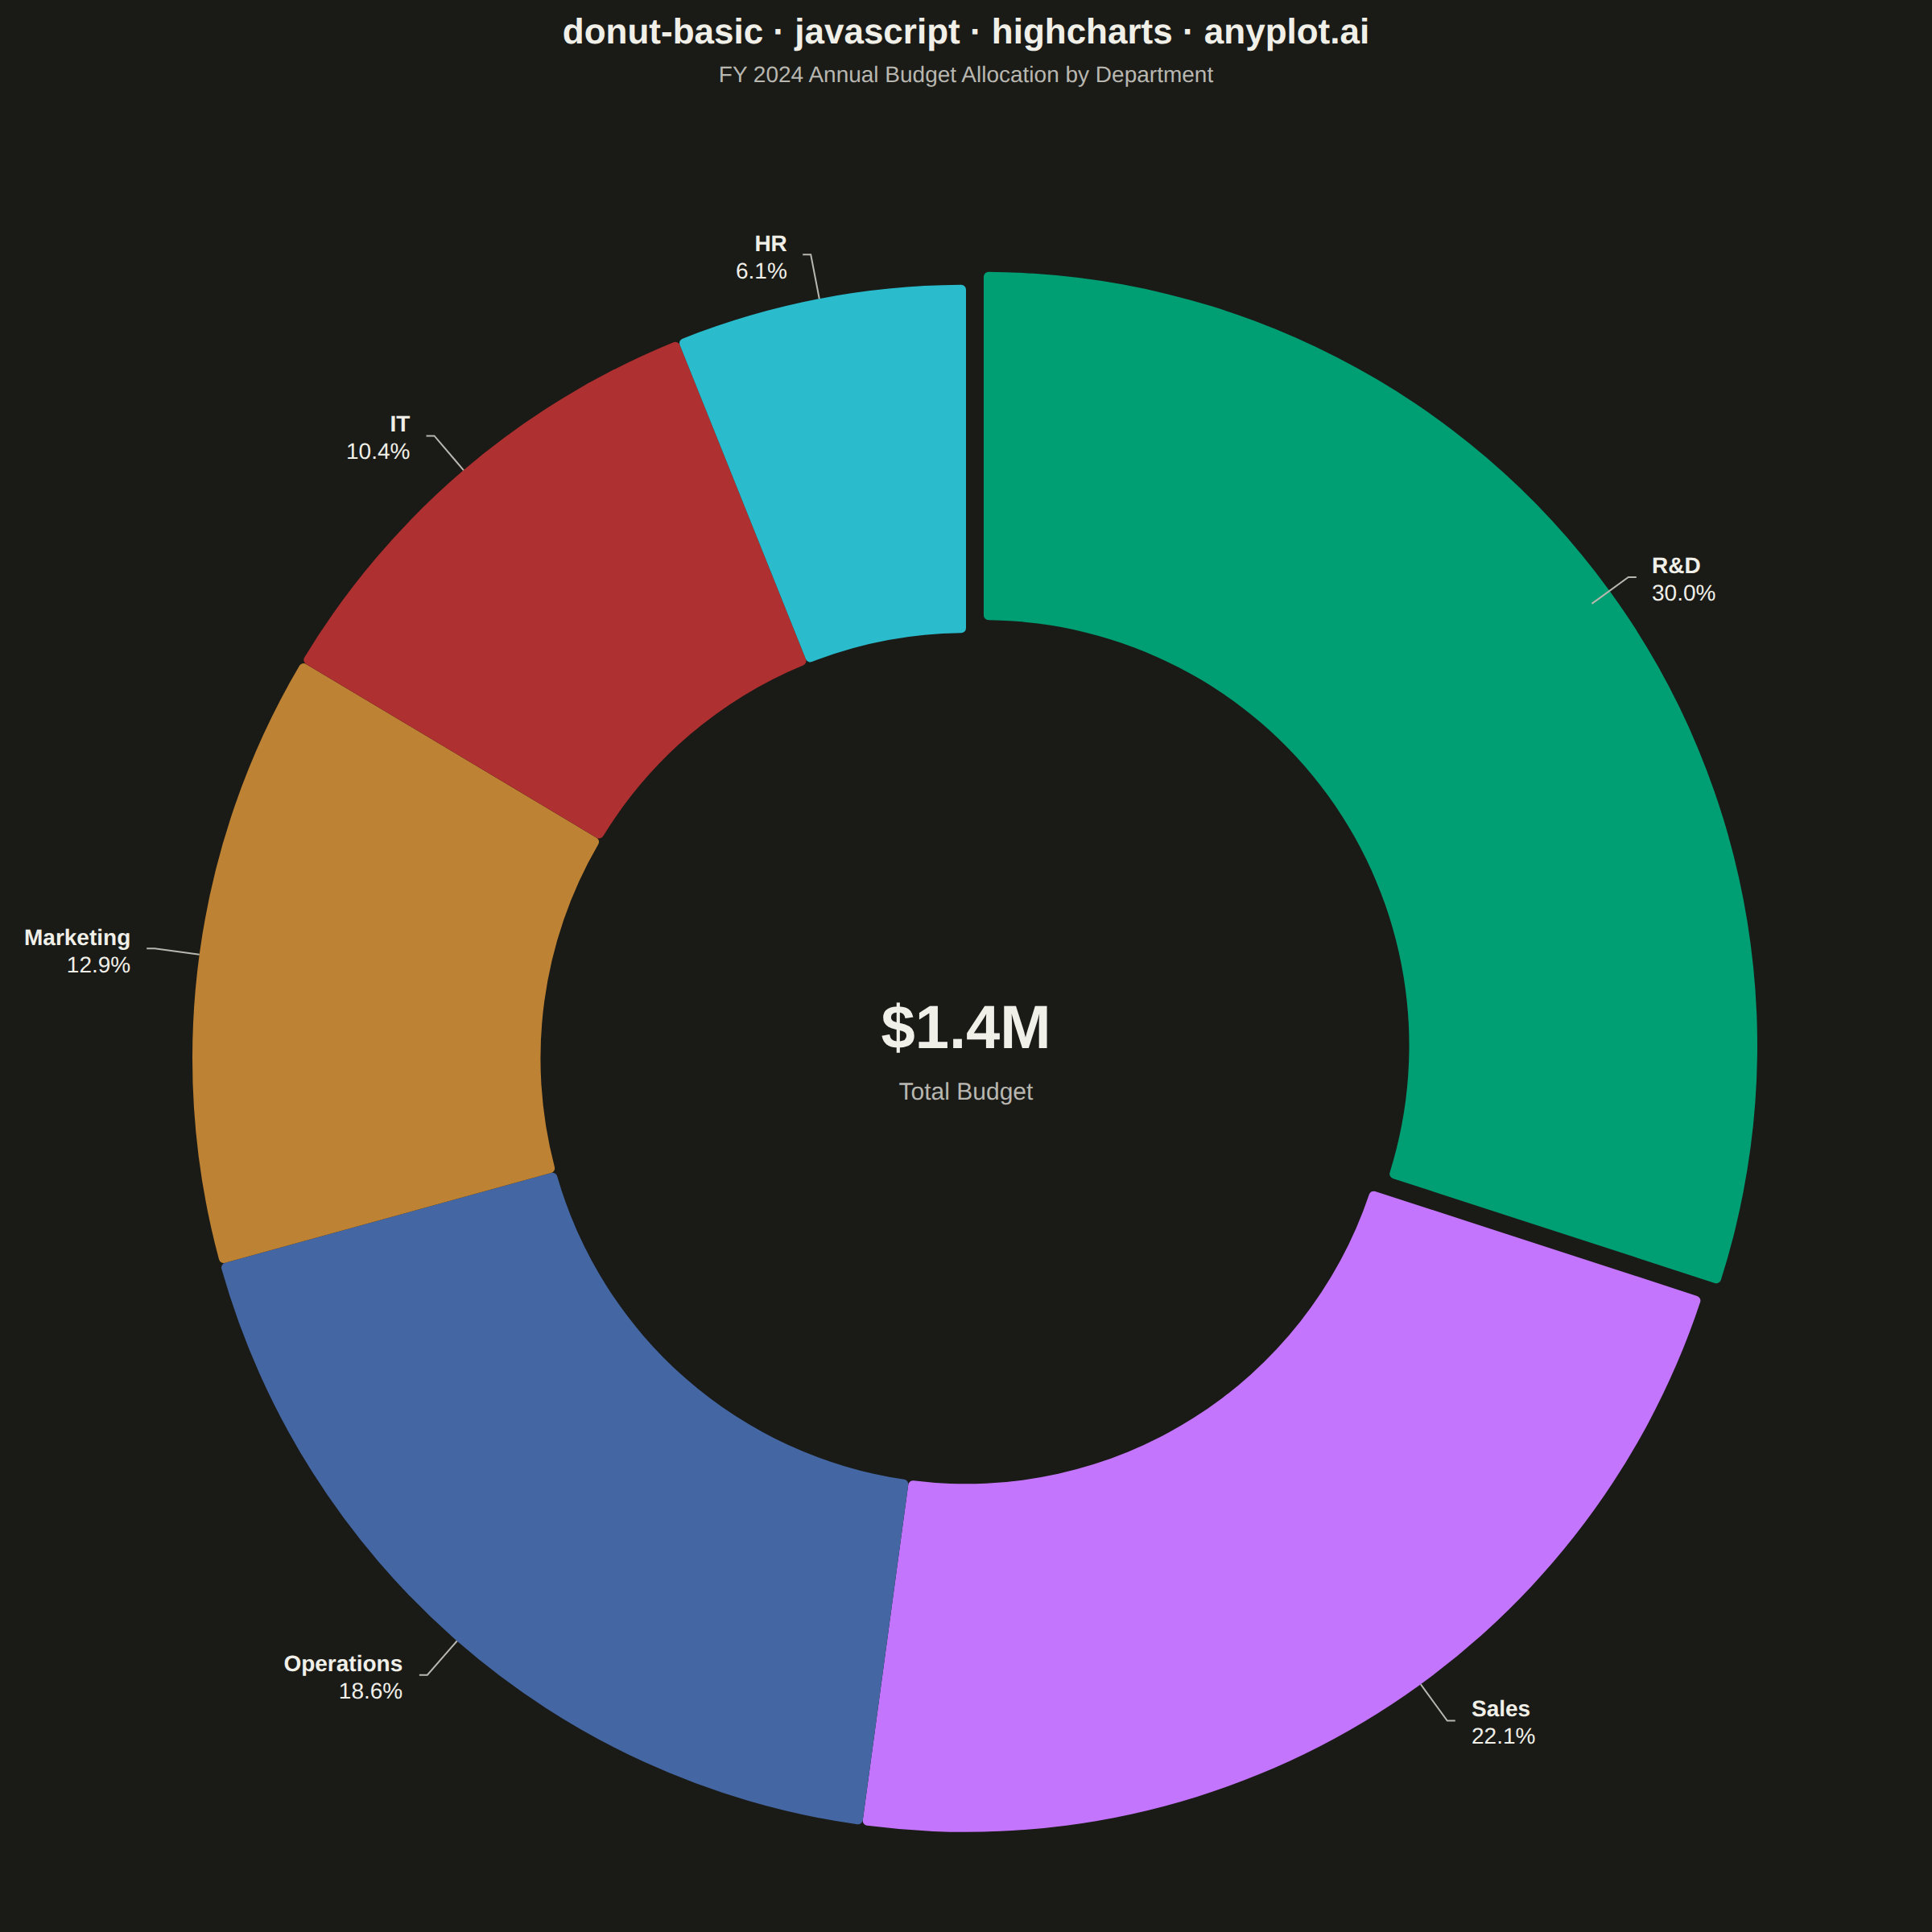
A donut chart (ring chart) showing proportions of categorical data as segments of a ring, with a hollow center. Similar to pie charts but the empty center can display summary statistics or additional information. The ring format can be easier to read when comparing segment sizes.
// anyplot.ai
// donut-basic: Basic Donut Chart
// Library: highcharts 12.6.0 | JavaScript 22.23.0
// Quality: 88/100 | Created: 2026-06-25
//# anyplot-orientation: square
// anyplot.ai
// donut-basic: Basic Donut Chart
// Library: Highcharts 12.6.0 | Node 22
// License: Highcharts — commercial license, free for non-commercial use (highcharts.com/license)
// Quality: pending | Created: 2026-06-25

const t = window.ANYPLOT_TOKENS;

// FY 2024 annual budget allocation by department ($K); R&D is the dominant slice
const departments = [
  { name: "R&D",        y: 420, sliced: true },
  { name: "Sales",      y: 310 },
  { name: "Operations", y: 260 },
  { name: "Marketing",  y: 180 },
  { name: "IT",         y: 145 },
  { name: "HR",         y:  85 },
];

const totalBudget = departments.reduce((s, d) => s + d.y, 0);

Highcharts.chart("container", {
  chart: {
    type: "pie",
    backgroundColor: "transparent",
    animation: false,
    style: { fontFamily: "inherit" },
    events: {
      render() {
        const s = this.series[0];
        if (!s || !s.center) return;
        const cx = this.plotLeft + s.center[0];
        const cy = this.plotTop  + s.center[1];

        if (this._cv) this._cv.destroy();
        if (this._ct) this._ct.destroy();

        this._cv = this.renderer
          .text(`$${(totalBudget / 1000).toFixed(1)}M`, cx, cy - 6)
          .attr({ align: "center", zIndex: 5 })
          .css({ color: t.ink, fontSize: "38px", fontWeight: "700" })
          .add();

        this._ct = this.renderer
          .text("Total Budget", cx, cy + 26)
          .attr({ align: "center", zIndex: 5 })
          .css({ color: t.inkSoft, fontSize: "15px" })
          .add();
      },
    },
  },
  credits: { enabled: false },
  colors: t.palette,
  title: {
    text: "donut-basic · javascript · highcharts · anyplot.ai",
    style: { color: t.ink, fontSize: "22px", fontWeight: "600" },
  },
  subtitle: {
    text: "FY 2024 Annual Budget Allocation by Department",
    style: { color: t.inkSoft, fontSize: "14px" },
  },
  plotOptions: {
    series: { animation: false },
    pie: {
      innerSize: "55%",
      center: ["50%", "53%"],
      slicedOffset: 14,
      dataLabels: {
        enabled: true,
        format: "<b>{point.name}</b><br>{point.percentage:.1f}%",
        style: {
          color: t.ink,
          fontSize: "14px",
          fontWeight: "normal",
          textOutline: "none",
        },
        connectorColor: t.inkSoft,
        connectorWidth: 1,
        distance: 28,
      },
      borderWidth: 0,
      point: {
        events: {
          legendItemClick() { return false; },
        },
      },
    },
  },
  legend: { enabled: false },
  responsive: {
    rules: [{
      condition: { maxWidth: 500 },
      chartOptions: {
        plotOptions: {
          pie: {
            dataLabels: { enabled: false },
            center: ["50%", "50%"],
          },
        },
        legend: {
          enabled: true,
          itemStyle: { color: t.inkSoft, fontSize: "12px" },
          itemHoverStyle: { color: t.ink },
        },
      },
    }],
  },
  series: [
    {
      name: "Budget ($K)",
      colorByPoint: true,
      data: departments,
    },
  ],
});
Runnable source as JSON, for any HTTP client: https://api.anyplot.ai/specs/donut-basic/highcharts/code. Any spec id and library id listed in llms-full.txt fit the same URL shape; every URL below is complete and callable.
{
  "spec_id": "donut-basic",
  "language": "javascript",
  "library": "highcharts",
  "page": "https://anyplot.ai/donut-basic/javascript/highcharts",
  "hub": "https://anyplot.ai/donut-basic",
  "code_json": "https://api.anyplot.ai/specs/donut-basic/highcharts/code",
  "spec_json": "https://api.anyplot.ai/specs/donut-basic",
  "render_light_png": "https://storage.googleapis.com/anyplot-images/plots/donut-basic/javascript/highcharts/plot-light.png",
  "render_dark_png": "https://storage.googleapis.com/anyplot-images/plots/donut-basic/javascript/highcharts/plot-dark.png",
  "interactive_light_html": "https://storage.googleapis.com/anyplot-images/plots/donut-basic/javascript/highcharts/plot-light.html",
  "interactive_dark_html": "https://storage.googleapis.com/anyplot-images/plots/donut-basic/javascript/highcharts/plot-dark.html",
  "quality_score": 88.0,
  "license": "MIT",
  "guide": "https://anyplot.ai/llms.txt"
}
Part of Basic Donut Chart on anyplot.ai.