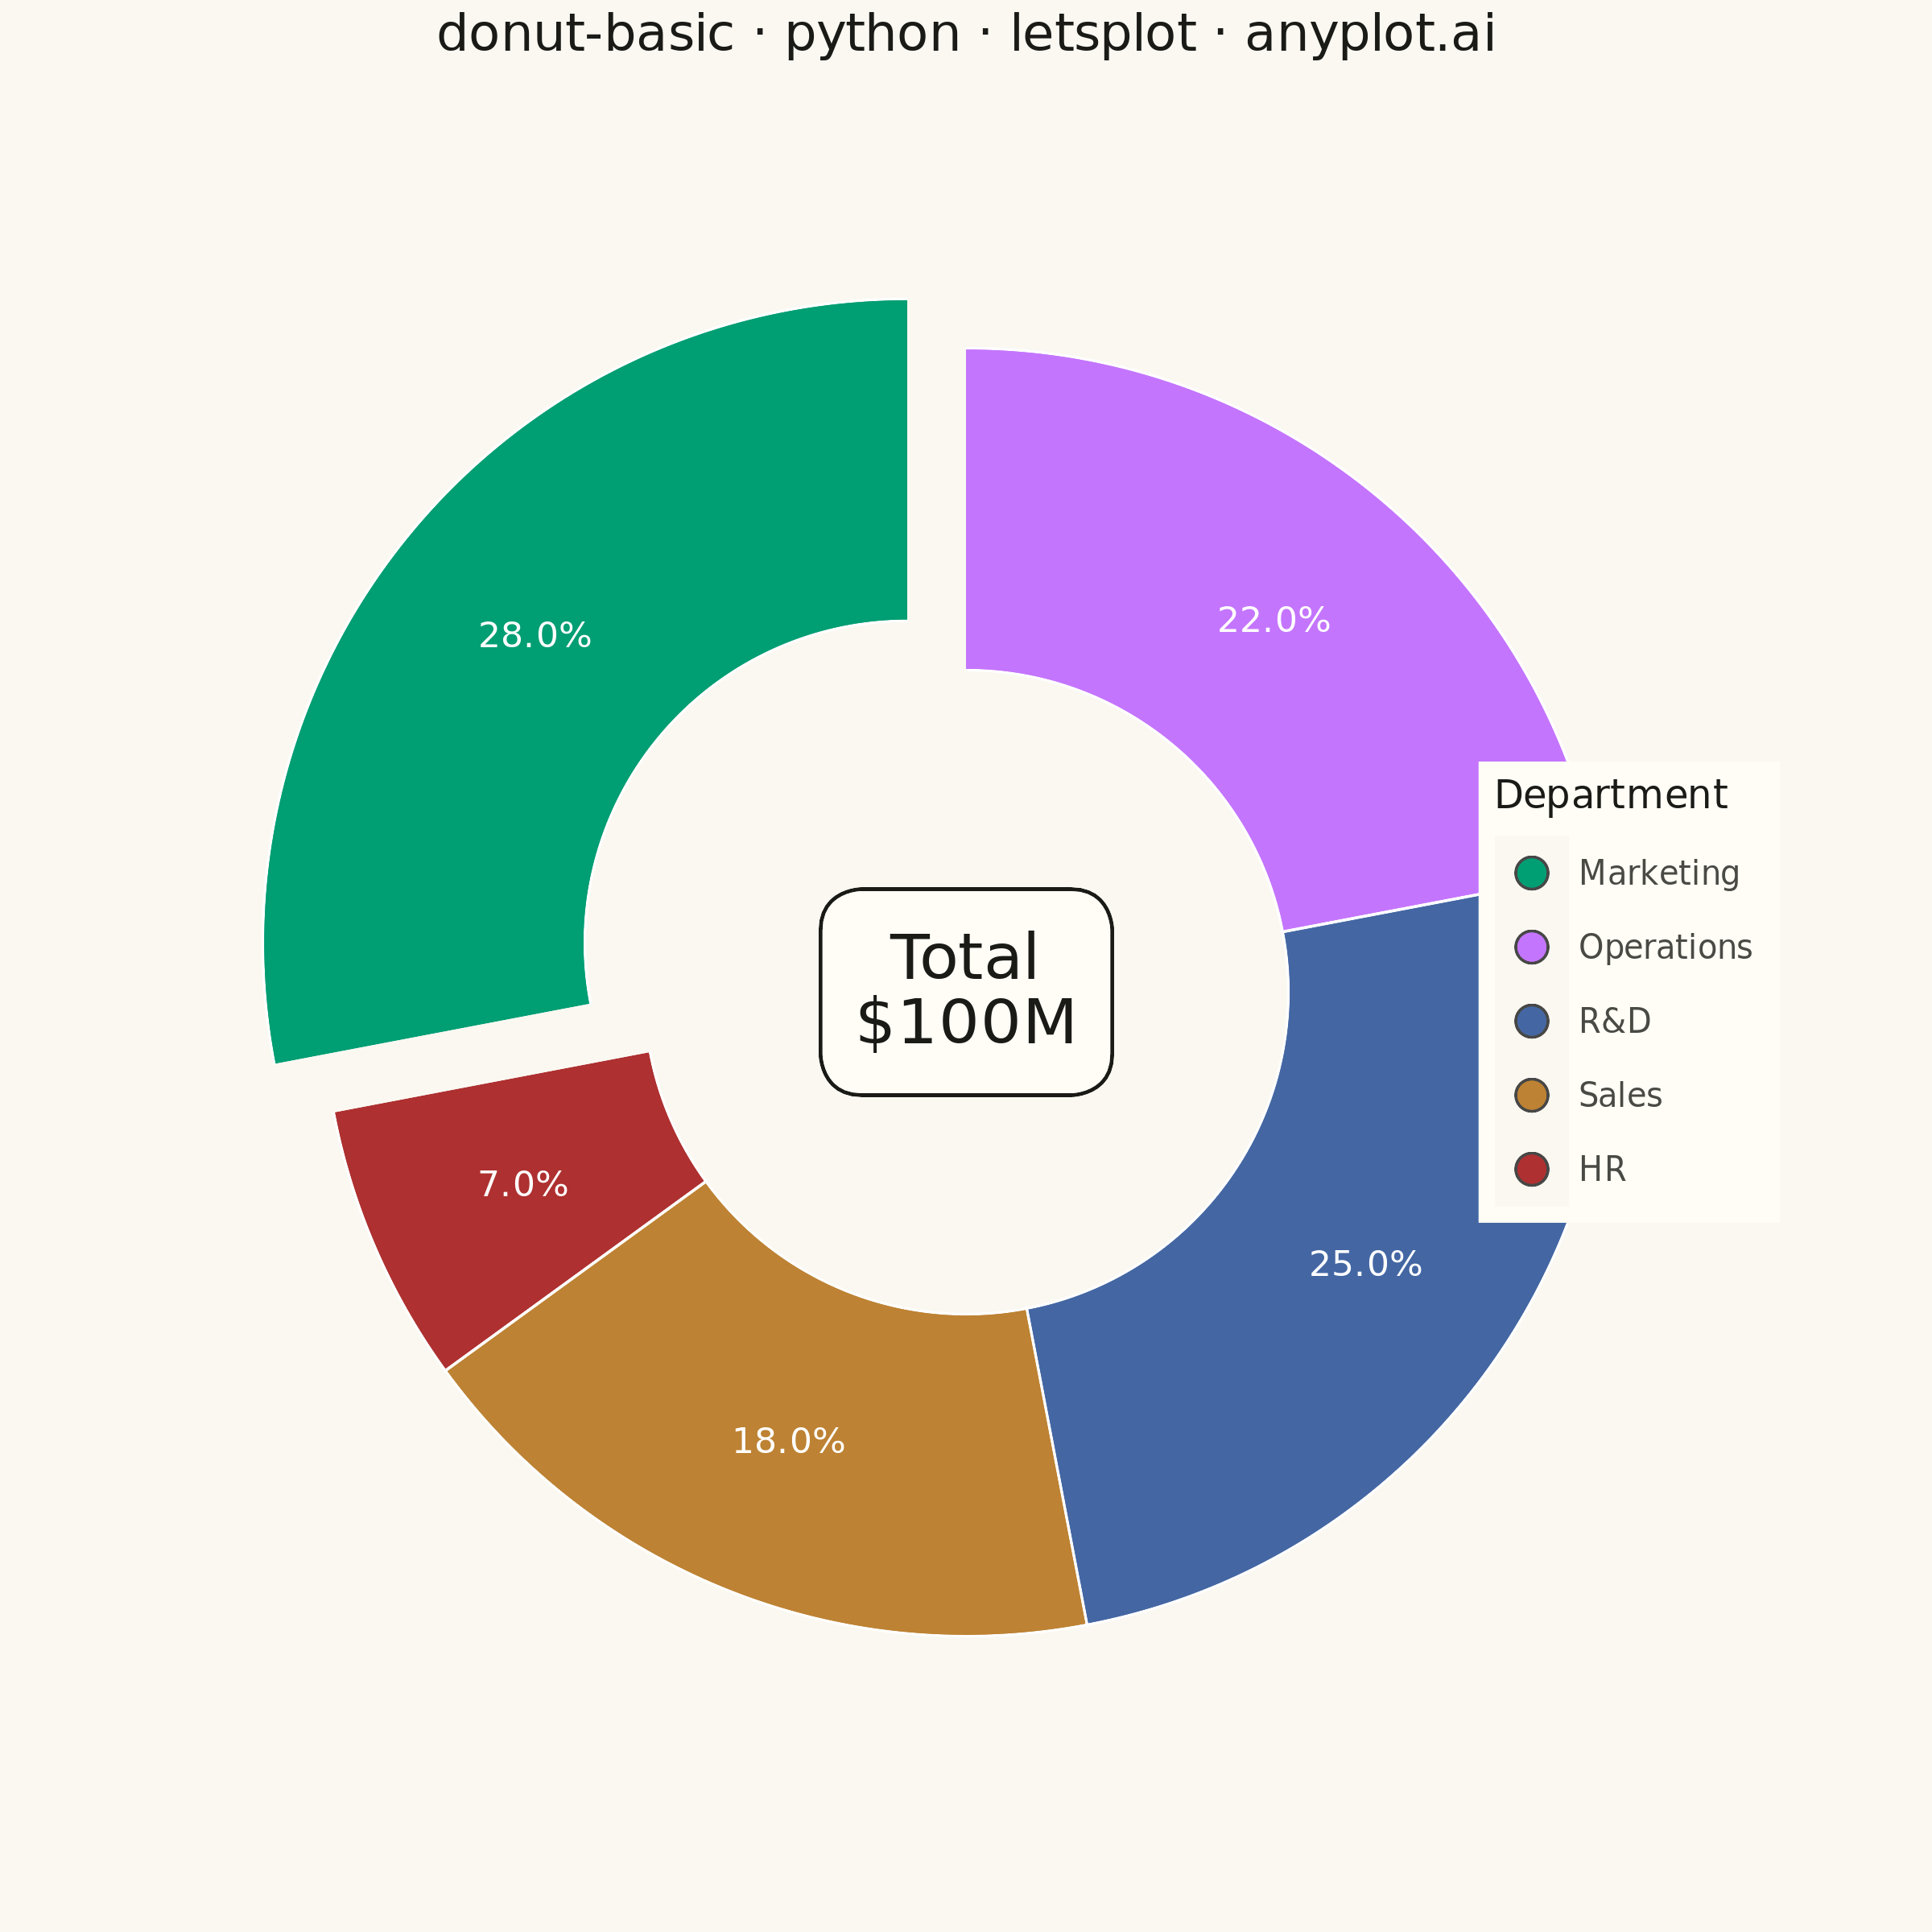
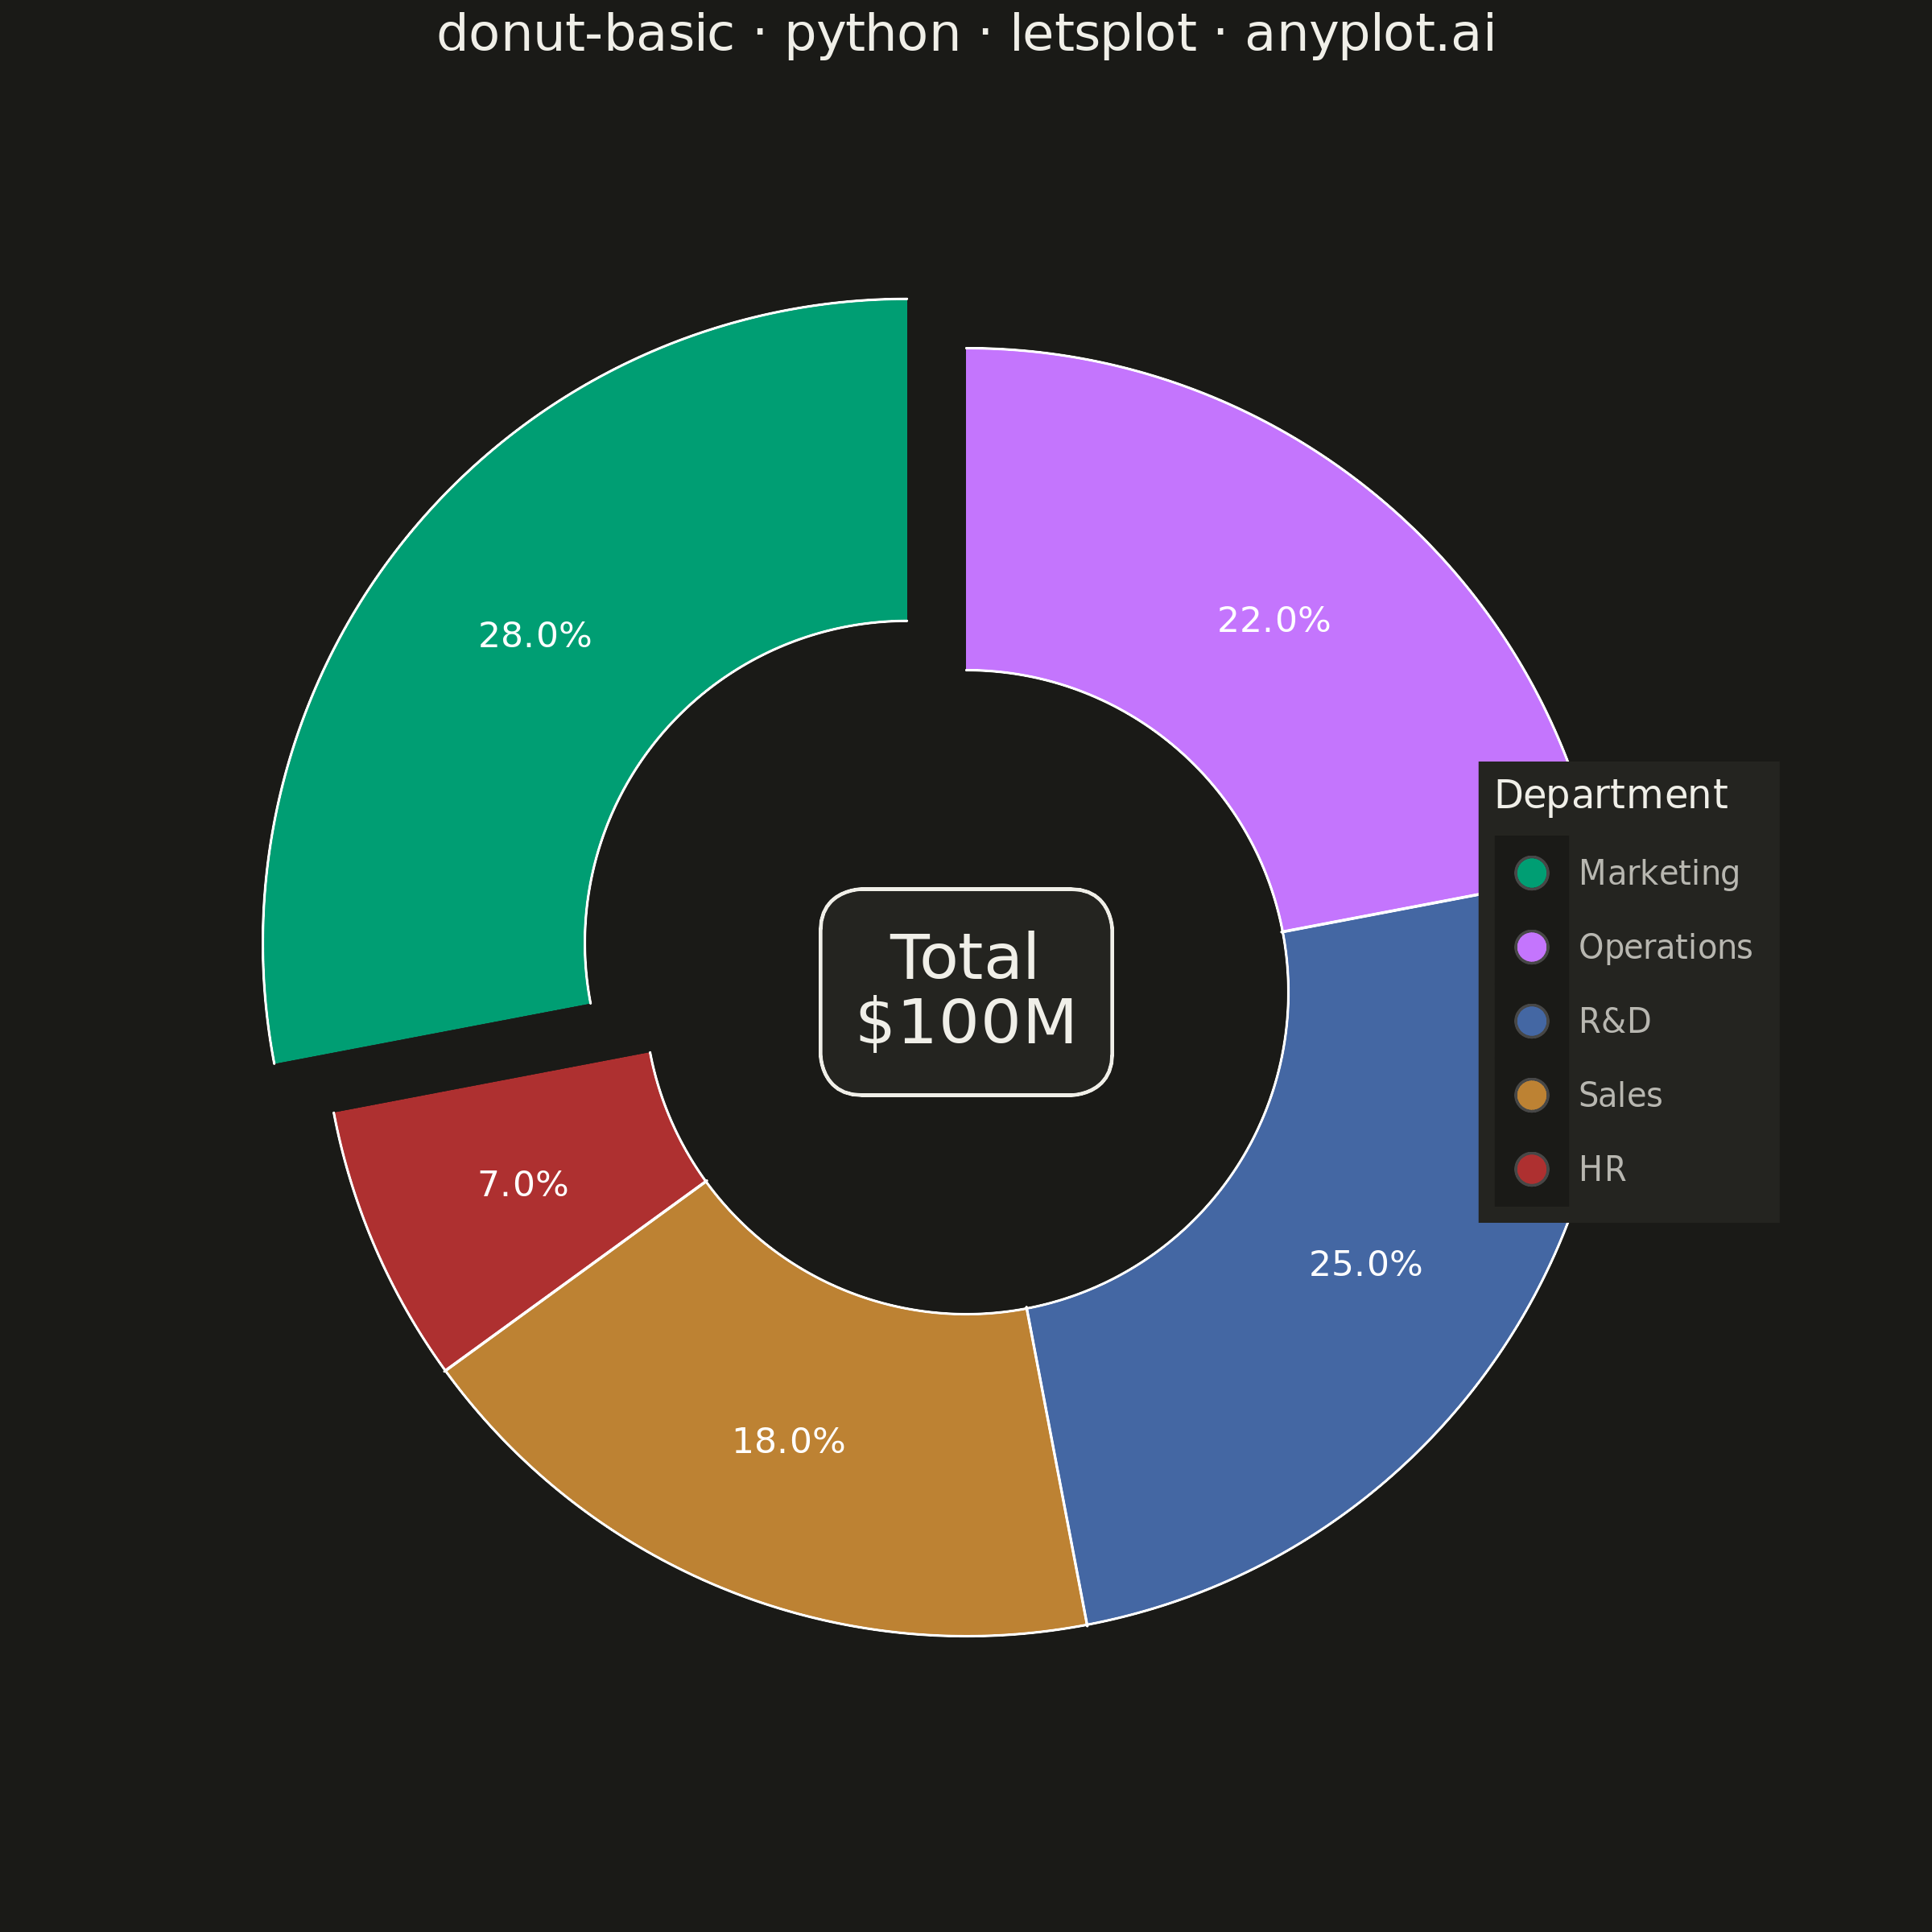
A donut chart (ring chart) showing proportions of categorical data as segments of a ring, with a hollow center. Similar to pie charts but the empty center can display summary statistics or additional information. The ring format can be easier to read when comparing segment sizes.
""" anyplot.ai
donut-basic: Basic Donut Chart
Library: letsplot 4.10.1 | Python 3.13.14
Quality: 91/100 | Updated: 2026-06-25
"""

import os

import pandas as pd
from lets_plot import *
from lets_plot.export import ggsave as export_ggsave


LetsPlot.setup_html()

# Theme tokens
THEME = os.getenv("ANYPLOT_THEME", "light")
PAGE_BG = "#FAF8F1" if THEME == "light" else "#1A1A17"
ELEVATED_BG = "#FFFDF6" if THEME == "light" else "#242420"
INK = "#1A1A17" if THEME == "light" else "#F0EFE8"
INK_SOFT = "#4A4A44" if THEME == "light" else "#B8B7B0"

# Imprint palette — 5 slots for 5 department categories
IMPRINT = ["#009E73", "#C475FD", "#4467A3", "#BD8233", "#AE3030"]

# Data — annual budget allocation by department ($M)
categories = ["Marketing", "Operations", "R&D", "Sales", "HR"]
values = [28, 22, 25, 18, 7]

df = pd.DataFrame({"category": categories, "value": values})
total = sum(values)
df["pct"] = df["value"] / total * 100
df["category"] = pd.Categorical(df["category"], categories=categories, ordered=True)
# Explode the dominant segment to give it visual emphasis
df["explode"] = [0.12 if c == "Marketing" else 0.0 for c in df["category"]]

center_df = pd.DataFrame({"x": [0.0], "y": [0.0], "label": [f"Total\n${total}M"]})

# Title: 46 chars < 67-char baseline → keep default size=16
TITLE = "donut-basic · python · letsplot · anyplot.ai"

plot = (
    ggplot(df)
    + geom_pie(
        aes(slice="value", fill="category", explode="explode"),
        stat="identity",
        size=40,
        hole=0.5,
        labels=layer_labels()
        .line("@pct")
        .format("pct", "{.1f}%")
        .size(11),
    )
    + geom_label(
        aes(x="x", y="y", label="label"),
        data=center_df,
        size=10,
        color=INK,
        fill=ELEVATED_BG,
        label_padding=0.6,
        label_r=0.2,
    )
    + scale_fill_manual(values=IMPRINT)
    + labs(title=TITLE, fill="Department")
    + ggsize(600, 600)
    + theme_void()
    + theme(
        plot_background=element_rect(fill=PAGE_BG, color=PAGE_BG),
        panel_background=element_rect(fill=PAGE_BG, color=PAGE_BG),
        plot_title=element_text(size=16, hjust=0.5, color=INK),
        legend_title=element_text(size=12, color=INK),
        legend_text=element_text(size=10, color=INK_SOFT),
        legend_background=element_rect(fill=ELEVATED_BG, color=ELEVATED_BG),
        legend_position=[0.85, 0.5],
    )
)

export_ggsave(plot, filename=f"plot-{THEME}.png", path=".", scale=4)
export_ggsave(plot, filename=f"plot-{THEME}.html", path=".")
Runnable source as JSON, for any HTTP client: https://api.anyplot.ai/specs/donut-basic/letsplot/code. Any spec id and library id listed in llms-full.txt fit the same URL shape; every URL below is complete and callable.
{
  "spec_id": "donut-basic",
  "language": "python",
  "library": "letsplot",
  "page": "https://anyplot.ai/donut-basic/python/letsplot",
  "hub": "https://anyplot.ai/donut-basic",
  "code_json": "https://api.anyplot.ai/specs/donut-basic/letsplot/code",
  "spec_json": "https://api.anyplot.ai/specs/donut-basic",
  "render_light_png": "https://storage.googleapis.com/anyplot-images/plots/donut-basic/python/letsplot/plot-light.png",
  "render_dark_png": "https://storage.googleapis.com/anyplot-images/plots/donut-basic/python/letsplot/plot-dark.png",
  "interactive_light_html": "https://storage.googleapis.com/anyplot-images/plots/donut-basic/python/letsplot/plot-light.html",
  "interactive_dark_html": "https://storage.googleapis.com/anyplot-images/plots/donut-basic/python/letsplot/plot-dark.html",
  "quality_score": 91.0,
  "license": "MIT",
  "guide": "https://anyplot.ai/llms.txt"
}
Part of Basic Donut Chart on anyplot.ai.