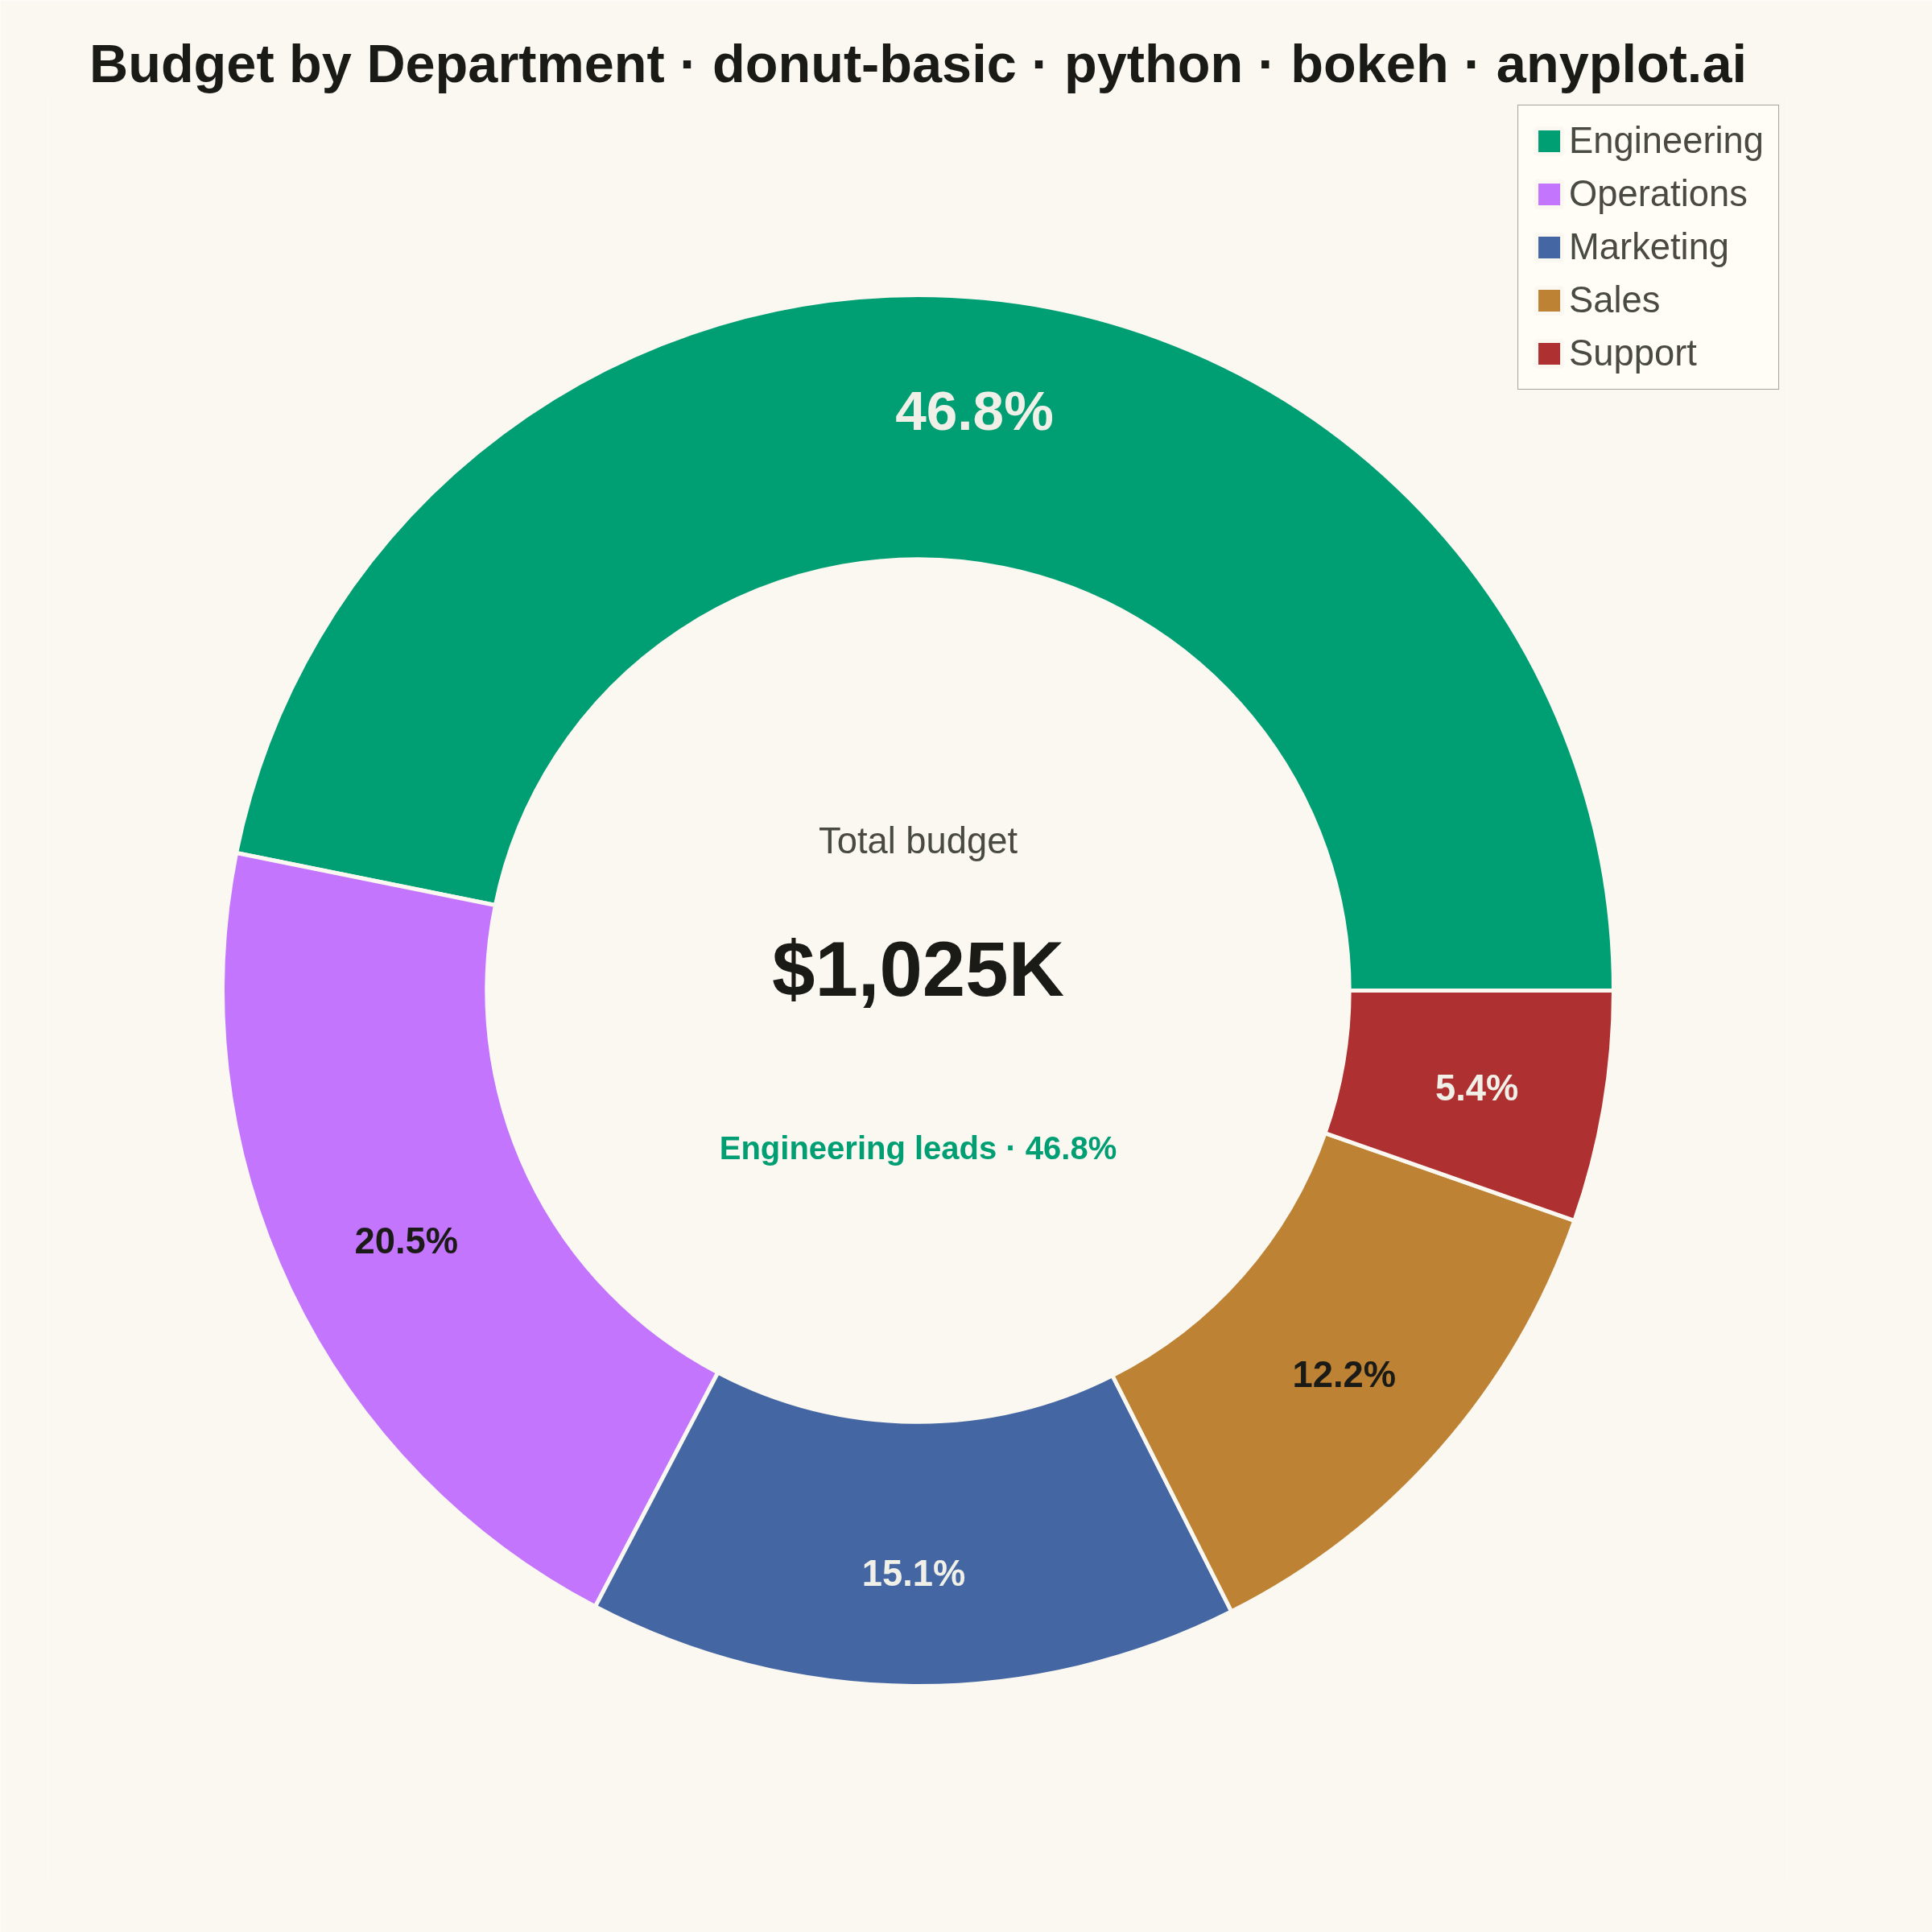
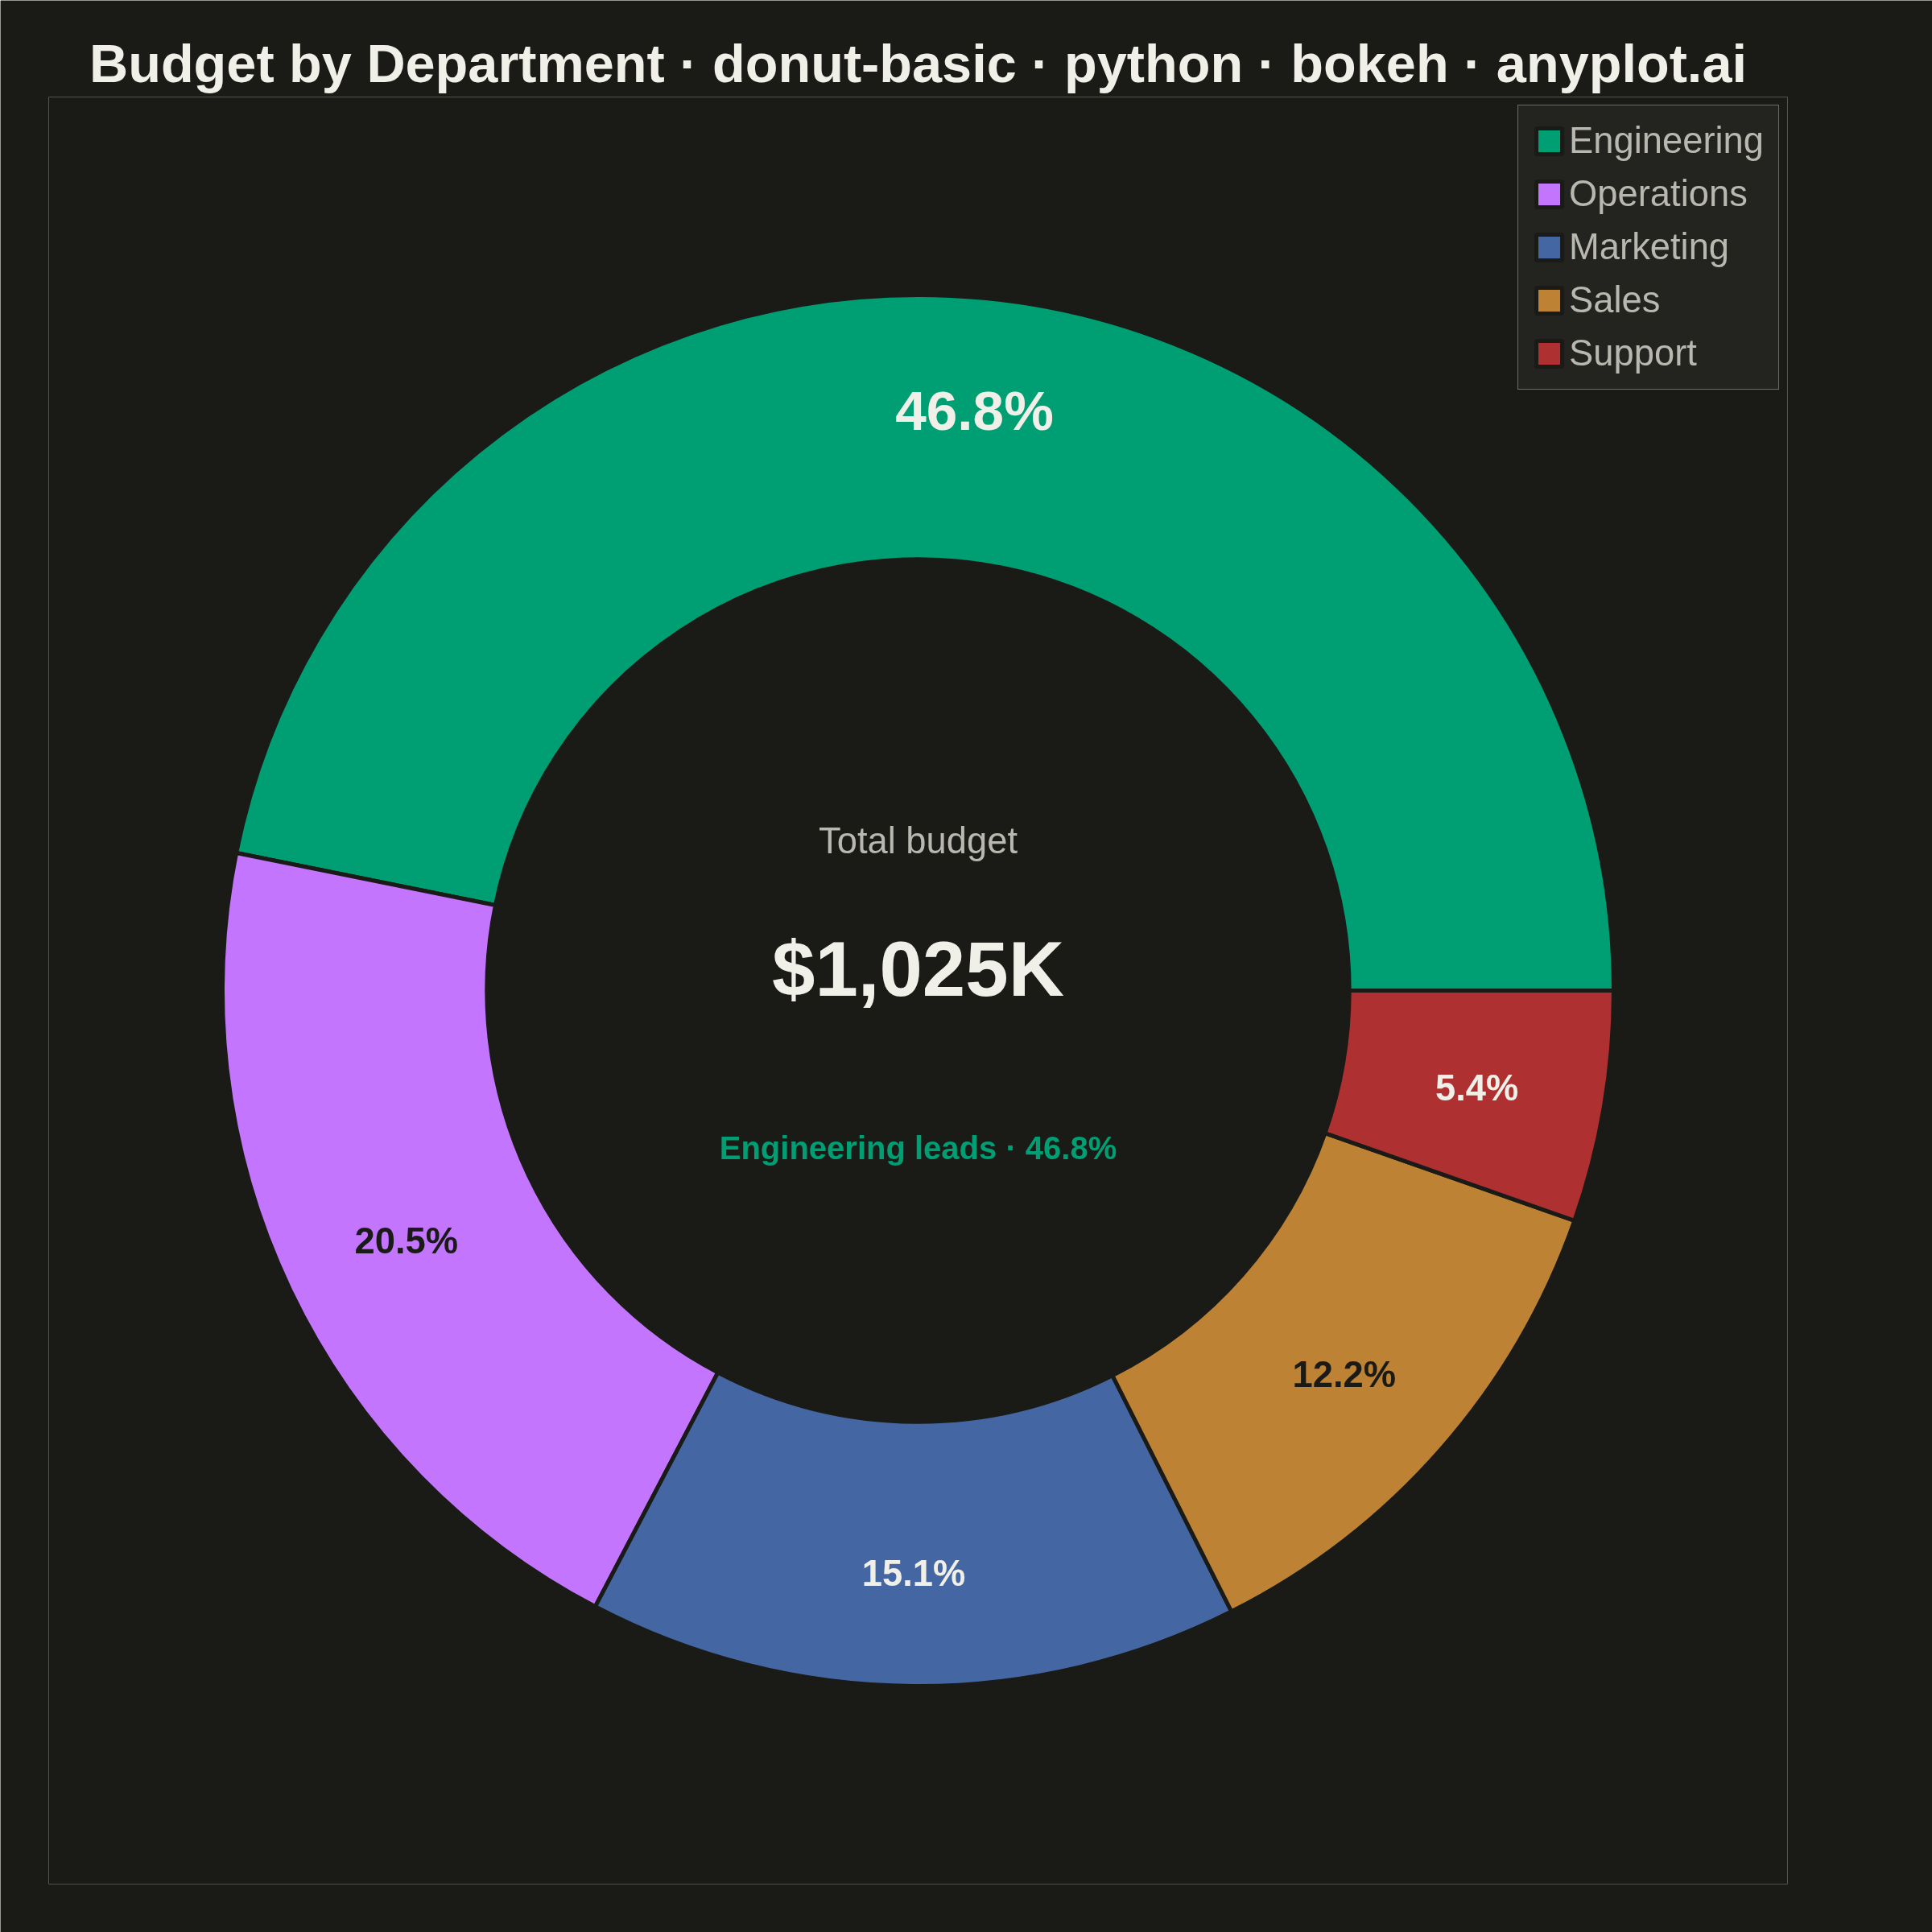
A donut chart (ring chart) showing proportions of categorical data as segments of a ring, with a hollow center. Similar to pie charts but the empty center can display summary statistics or additional information. The ring format can be easier to read when comparing segment sizes.
""" anyplot.ai
donut-basic: Basic Donut Chart
Library: bokeh 3.9.1 | Python 3.13.14
Quality: 89/100 | Updated: 2026-06-25
"""

import os
import sys
import time
from math import cos, pi, sin
from pathlib import Path


# Prevent this file from shadowing the installed bokeh package
_this_dir = os.path.dirname(os.path.abspath(__file__))
if _this_dir in sys.path:
    sys.path.remove(_this_dir)

import numpy as np
from bokeh.io import output_file, save
from bokeh.models import ColumnDataSource, HoverTool, Label
from bokeh.plotting import figure
from bokeh.transform import cumsum
from selenium import webdriver
from selenium.webdriver.chrome.options import Options


# Theme tokens
THEME = os.getenv("ANYPLOT_THEME", "light")
PAGE_BG = "#FAF8F1" if THEME == "light" else "#1A1A17"
ELEVATED_BG = "#FFFDF6" if THEME == "light" else "#242420"
INK = "#1A1A17" if THEME == "light" else "#F0EFE8"
INK_SOFT = "#4A4A44" if THEME == "light" else "#B8B7B0"

# Imprint categorical palette — first segment is always brand green
IMPRINT = ["#009E73", "#C475FD", "#4467A3", "#BD8233", "#AE3030"]

# Data — Annual budget allocation by department (USD thousands)
categories = ["Engineering", "Operations", "Marketing", "Sales", "Support"]
values = [480, 210, 155, 125, 55]
total = sum(values)

angles = [v / total * 2 * pi for v in values]
percentages = [f"{v / total * 100:.1f}%" for v in values]
formatted_values = [f"${v:,}K" for v in values]
colors = IMPRINT[: len(categories)]

source = ColumnDataSource(
    data={
        "category": categories,
        "value": values,
        "angle": angles,
        "color": colors,
        "percentage": percentages,
        "formatted_value": formatted_values,
    }
)

# Contrast-adaptive percentage label colors (perceived brightness threshold 0.45)
label_colors = []
for c in colors:
    r, g, b = int(c[1:3], 16) / 255.0, int(c[3:5], 16) / 255.0, int(c[5:7], 16) / 255.0
    label_colors.append("#1A1A17" if 0.299 * r + 0.587 * g + 0.114 * b >= 0.45 else "#F0EFE8")

# Title — length-scaled fontsize (baseline 50pt for 67-char title)
title_str = "Budget by Department · donut-basic · python · bokeh · anyplot.ai"
n = len(title_str)
title_fontsize = f"{round(50 * (67 / n if n > 67 else 1.0))}pt"

# Plot — square canvas 2400×2400 for circular shapes
p = figure(
    width=2400,
    height=2400,
    title=title_str,
    toolbar_location=None,
    tools="",
    x_range=(-1.25, 1.25),
    y_range=(-1.25, 1.25),
    min_border_top=120,
    min_border_bottom=60,
    min_border_left=60,
    min_border_right=180,
)

# Donut ring
renderer = p.annular_wedge(
    x=0,
    y=0,
    inner_radius=0.62,
    outer_radius=1.0,
    start_angle=cumsum("angle", include_zero=True),
    end_angle=cumsum("angle"),
    line_color=PAGE_BG,
    line_width=5,
    fill_color="color",
    legend_field="category",
    source=source,
)

# HoverTool — Bokeh's signature interactive feature (active in HTML output)
hover = HoverTool(
    renderers=[renderer], tooltips=[("Category", "@category"), ("Budget", "@formatted_value"), ("Share", "@percentage")]
)
p.add_tools(hover)

# Percentage labels at ring midpoint — contrast-adaptive; dominant segment rendered larger
cumulative_starts = np.cumsum([0.0] + angles[:-1])
for i, (pct, start, ang, lc) in enumerate(zip(percentages, cumulative_starts, angles, label_colors, strict=True)):
    mid = start + ang / 2
    label_radius = 0.815
    lx = label_radius * cos(mid)
    ly = label_radius * sin(mid)
    # Engineering (i=0) gets a larger label to signal its dominance
    font_size = "52pt" if i == 0 else "34pt"
    p.add_layout(
        Label(
            x=lx,
            y=ly,
            text=pct,
            text_font_size=font_size,
            text_color=lc,
            text_font_style="bold",
            text_align="center",
            text_baseline="middle",
        )
    )

# Center metric — key summary in the hollow ring; Engineering callout for data storytelling
p.add_layout(
    Label(
        x=0,
        y=0.21,
        text="Total budget",
        text_font_size="34pt",
        text_color=INK_SOFT,
        text_align="center",
        text_baseline="middle",
    )
)
p.add_layout(
    Label(
        x=0,
        y=0.03,
        text=f"${total:,}K",
        text_font_size="72pt",
        text_color=INK,
        text_font_style="bold",
        text_align="center",
        text_baseline="middle",
    )
)
# Callout: name the dominant segment so the viewer's eye is guided
p.add_layout(
    Label(
        x=0,
        y=-0.22,
        text="Engineering leads · 46.8%",
        text_font_size="30pt",
        text_color=IMPRINT[0],
        text_font_style="bold",
        text_align="center",
        text_baseline="middle",
    )
)

# Style — theme-adaptive chrome
p.background_fill_color = PAGE_BG
p.border_fill_color = PAGE_BG
p.outline_line_color = None

p.title.text_font_size = title_fontsize
p.title.text_color = INK
p.title.align = "center"
p.title.text_font_style = "bold"

p.axis.visible = False
p.grid.visible = False

p.legend.background_fill_color = ELEVATED_BG
p.legend.border_line_color = INK_SOFT
p.legend.label_text_color = INK_SOFT
p.legend.label_text_font_size = "34pt"
p.legend.location = "top_right"
p.legend.spacing = 14
p.legend.padding = 18
p.legend.glyph_height = 40
p.legend.glyph_width = 40

# Save — interactive HTML + headless-Chrome screenshot (export_png unavailable in CI)
output_file(f"plot-{THEME}.html")
save(p)

W, H = 2400, 2400
opts = Options()
for arg in (
    "--headless=new",
    "--no-sandbox",
    "--disable-dev-shm-usage",
    "--disable-gpu",
    f"--window-size={W},{H}",
    "--hide-scrollbars",
):
    opts.add_argument(arg)
driver = webdriver.Chrome(options=opts)
driver.set_window_size(W, H)
driver.execute_cdp_cmd(
    "Emulation.setDeviceMetricsOverride", {"width": W, "height": H, "deviceScaleFactor": 1, "mobile": False}
)
driver.get(f"file://{Path(f'plot-{THEME}.html').resolve()}")
time.sleep(3)
driver.save_screenshot(f"plot-{THEME}.png")
driver.quit()

# Ensure exact canvas dimensions — pad/crop if browser clips or adds chrome
from PIL import Image as _PILImage


_img = _PILImage.open(f"plot-{THEME}.png").convert("RGB")
if _img.size != (W, H):
    _norm = _PILImage.new("RGB", (W, H), PAGE_BG)
    _norm.paste(_img, ((W - _img.size[0]) // 2, (H - _img.size[1]) // 2))
    _norm.save(f"plot-{THEME}.png")
Runnable source as JSON, for any HTTP client: https://api.anyplot.ai/specs/donut-basic/bokeh/code. Any spec id and library id listed in llms-full.txt fit the same URL shape; every URL below is complete and callable.
{
  "spec_id": "donut-basic",
  "language": "python",
  "library": "bokeh",
  "page": "https://anyplot.ai/donut-basic/python/bokeh",
  "hub": "https://anyplot.ai/donut-basic",
  "code_json": "https://api.anyplot.ai/specs/donut-basic/bokeh/code",
  "spec_json": "https://api.anyplot.ai/specs/donut-basic",
  "render_light_png": "https://storage.googleapis.com/anyplot-images/plots/donut-basic/python/bokeh/plot-light.png",
  "render_dark_png": "https://storage.googleapis.com/anyplot-images/plots/donut-basic/python/bokeh/plot-dark.png",
  "interactive_light_html": "https://storage.googleapis.com/anyplot-images/plots/donut-basic/python/bokeh/plot-light.html",
  "interactive_dark_html": "https://storage.googleapis.com/anyplot-images/plots/donut-basic/python/bokeh/plot-dark.html",
  "quality_score": 89.0,
  "license": "MIT",
  "guide": "https://anyplot.ai/llms.txt"
}
Part of Basic Donut Chart on anyplot.ai.