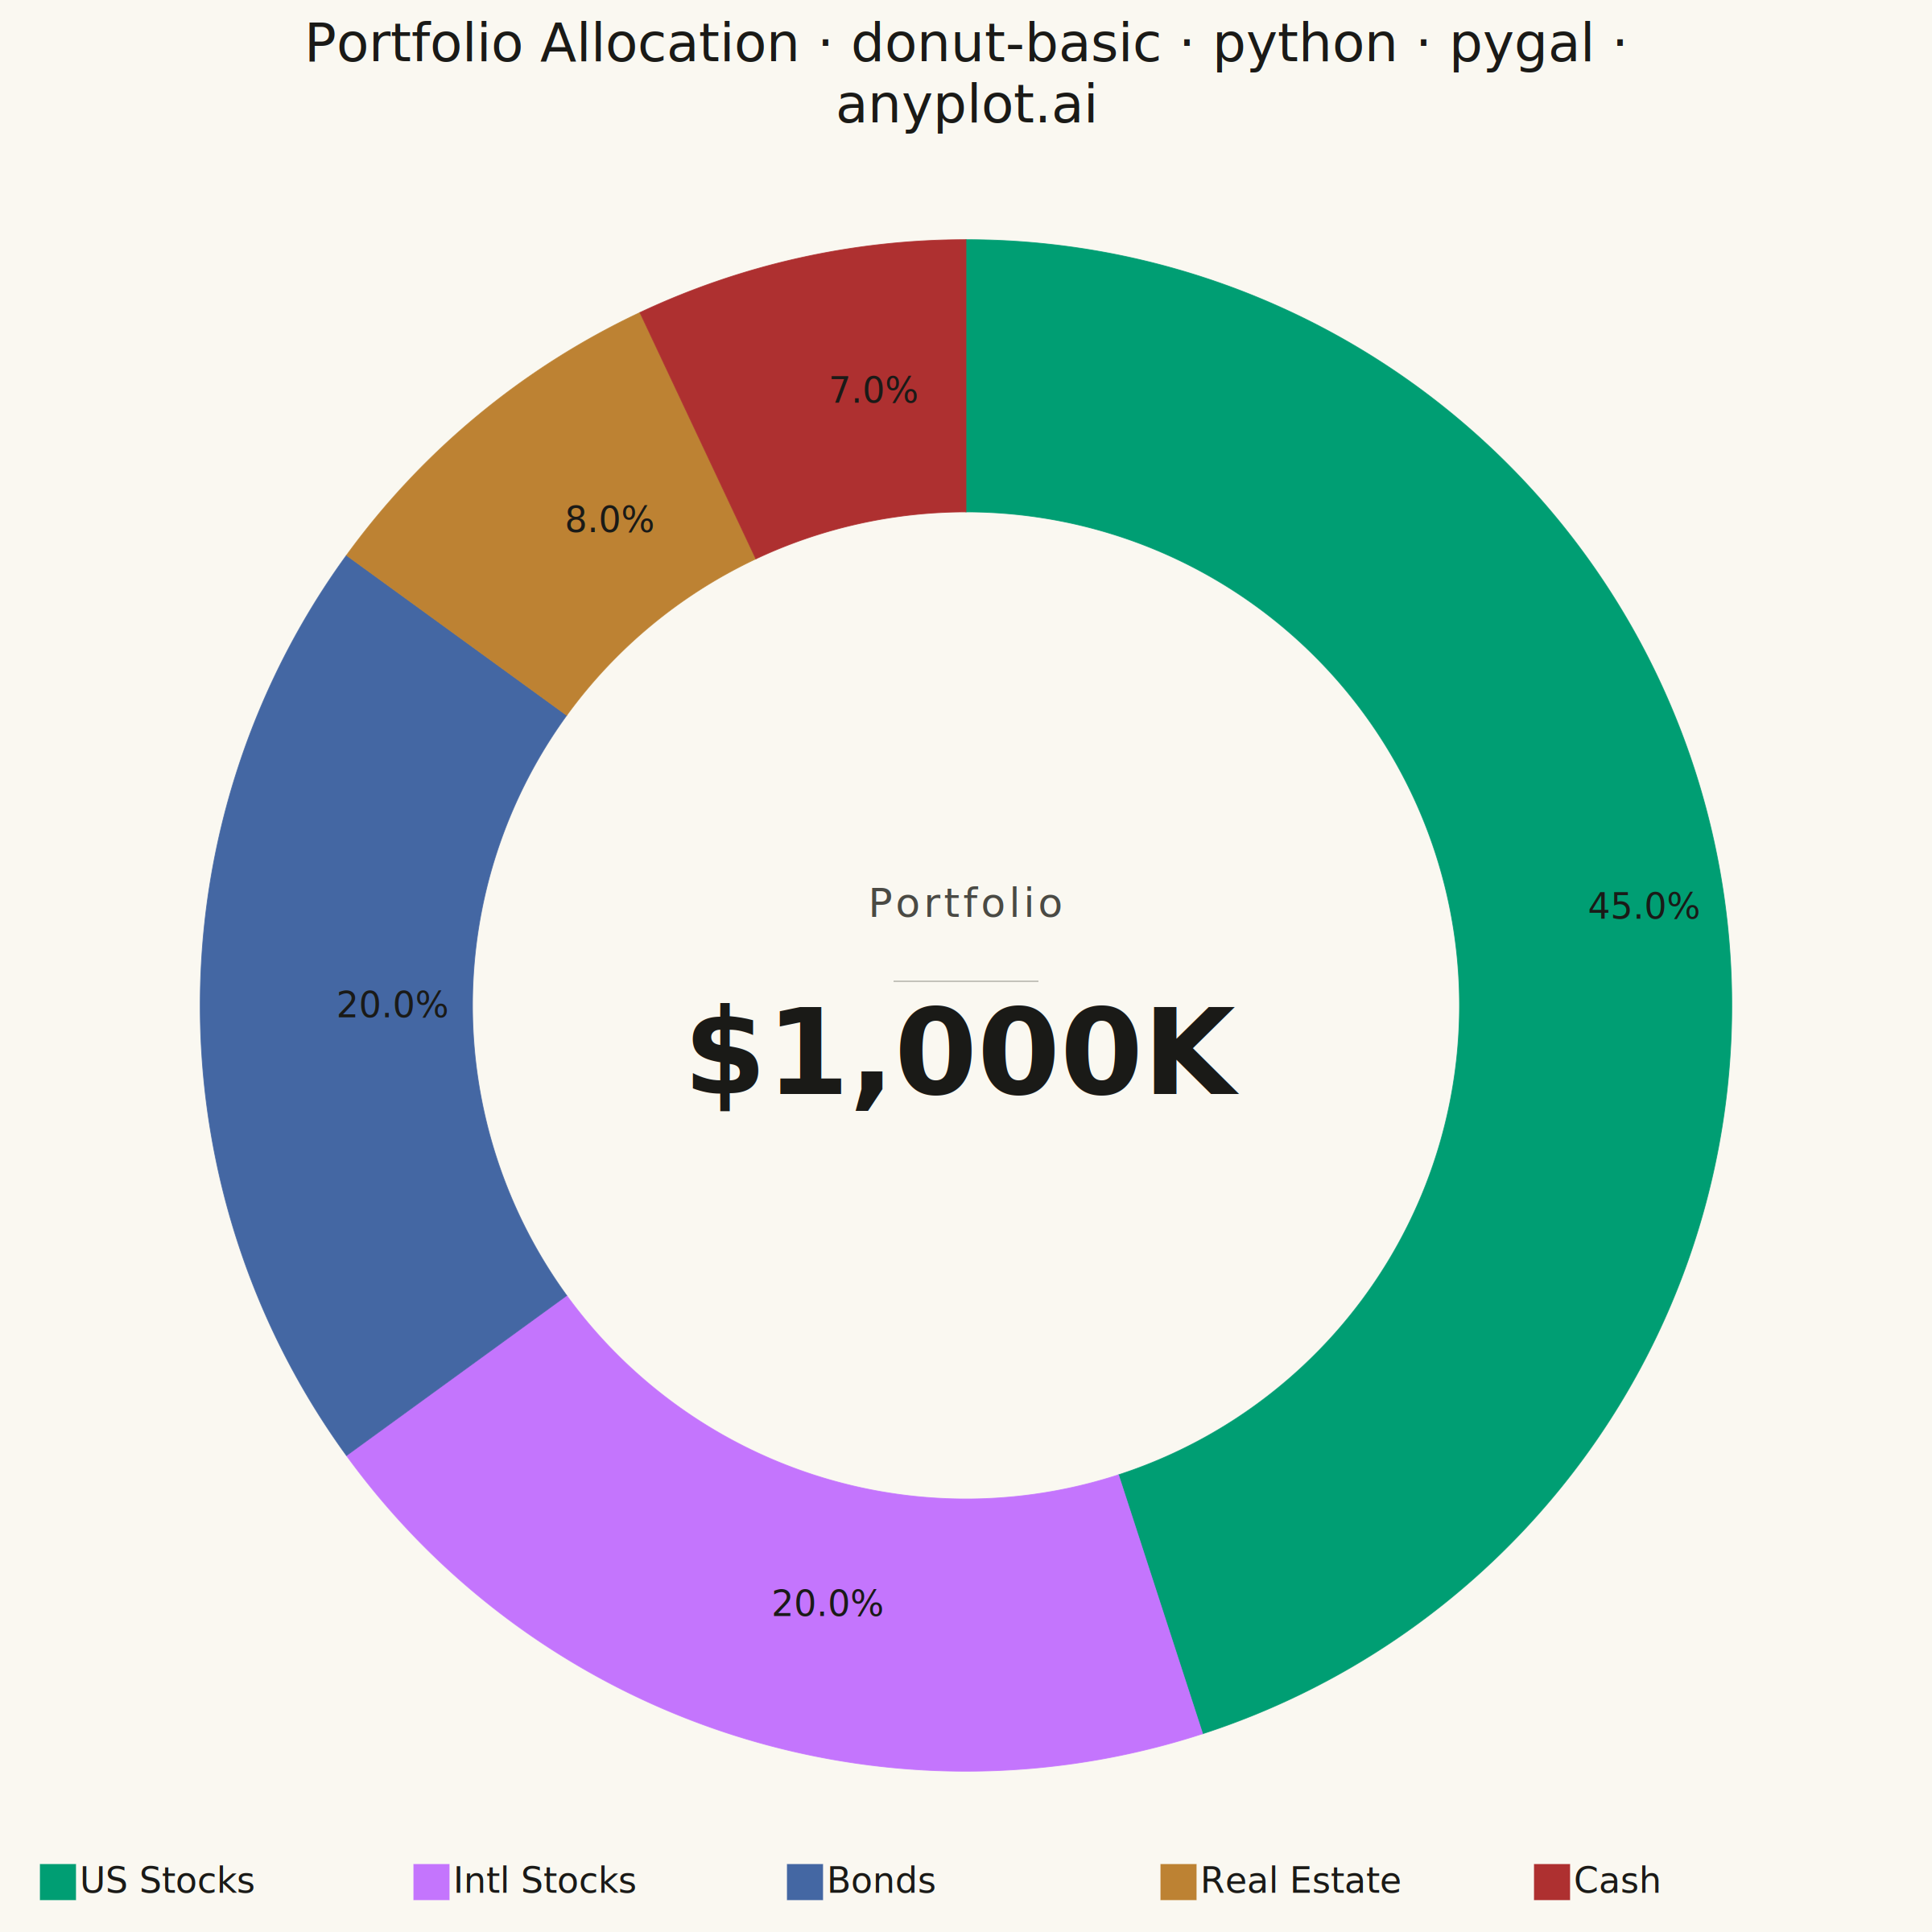
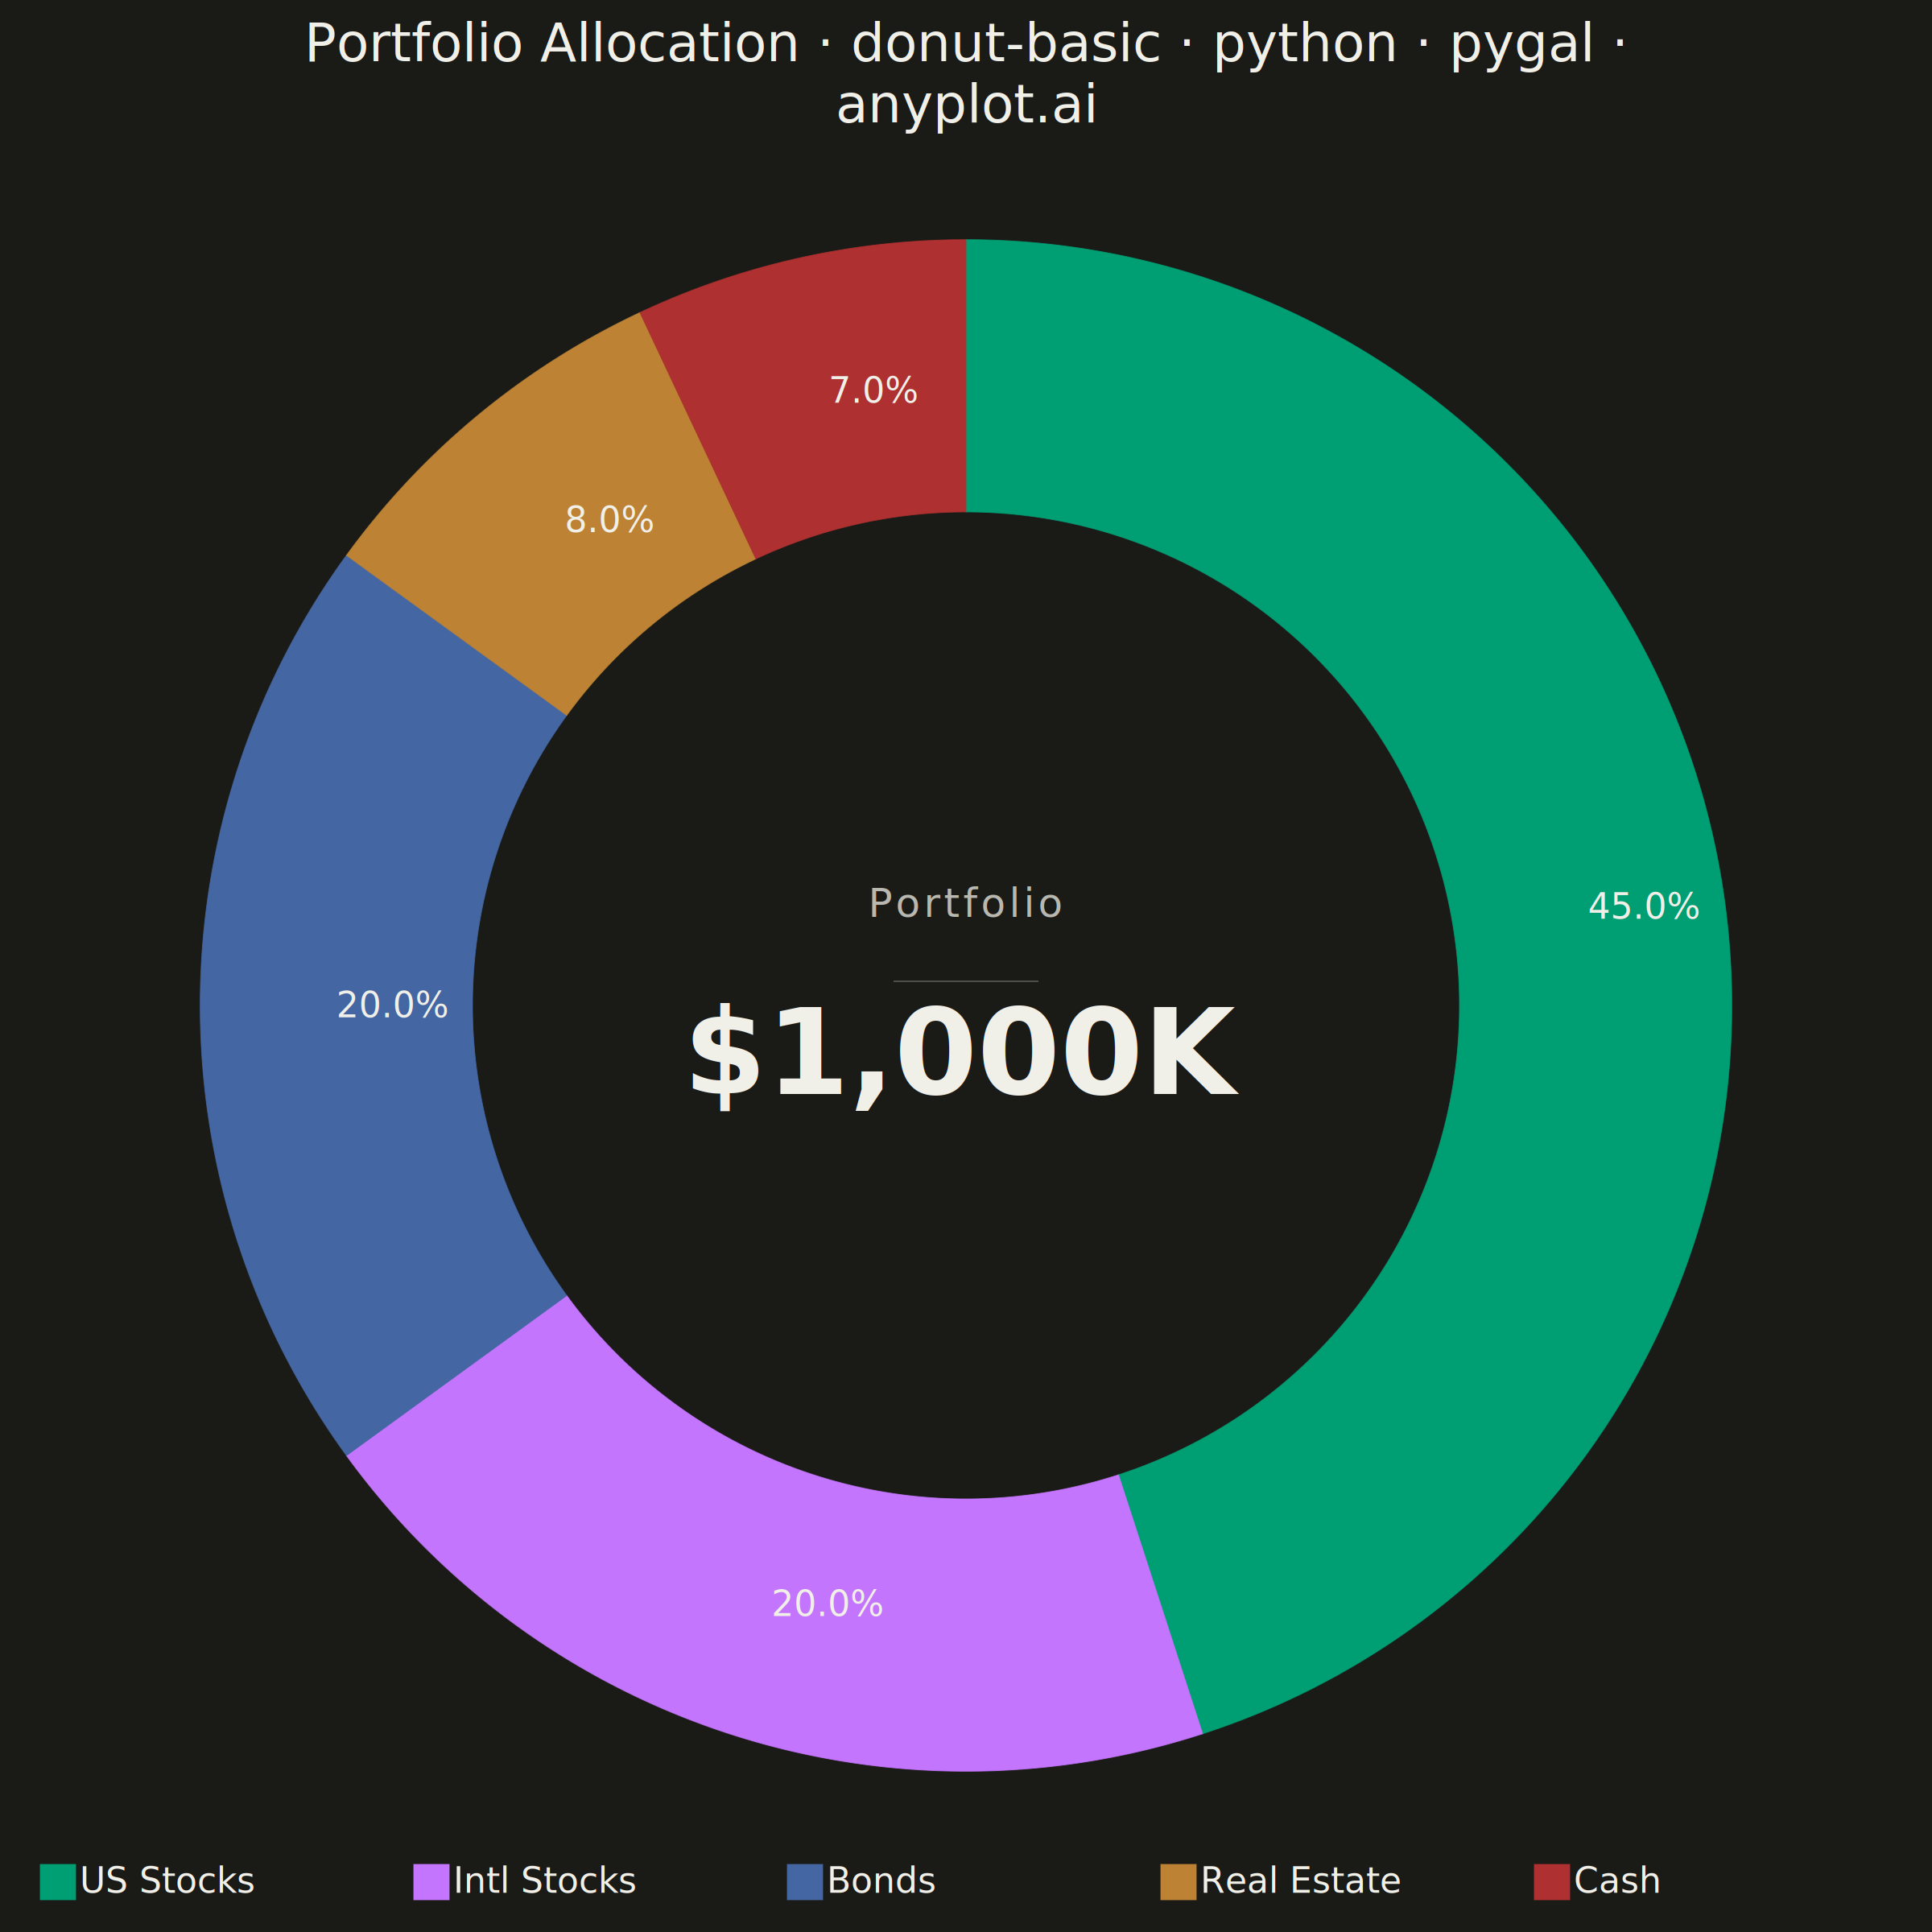
A donut chart (ring chart) showing proportions of categorical data as segments of a ring, with a hollow center. Similar to pie charts but the empty center can display summary statistics or additional information. The ring format can be easier to read when comparing segment sizes.
""" anyplot.ai
donut-basic: Basic Donut Chart
Library: pygal 3.1.3 | Python 3.13.14
Quality: 86/100 | Updated: 2026-06-25
"""

import os
import re
import sys


# Script filename shadows the installed `pygal` package when run as `python pygal.py`;
# dropping the script directory from sys.path lets the real package resolve.
sys.path.pop(0)

import cairosvg
import pygal
from pygal.style import Style


# Theme tokens
THEME = os.getenv("ANYPLOT_THEME", "light")
PAGE_BG = "#FAF8F1" if THEME == "light" else "#1A1A17"
INK = "#1A1A17" if THEME == "light" else "#F0EFE8"
INK_SOFT = "#4A4A44" if THEME == "light" else "#B8B7B0"
INK_MUTED = "#6B6A63" if THEME == "light" else "#A8A79F"

# Imprint categorical palette — first series is always brand green
IMPRINT = ("#009E73", "#C475FD", "#4467A3", "#BD8233", "#AE3030", "#2ABCCD", "#954477")

# Data — model portfolio allocation (USD thousands)
categories = ["US Stocks", "Intl Stocks", "Bonds", "Real Estate", "Cash"]
values = [450, 200, 200, 80, 70]
total = sum(values)

font = "DejaVu Sans, Helvetica, Arial, sans-serif"

title = "Portfolio Allocation · donut-basic · python · pygal · anyplot.ai"
n = len(title)
ratio = 67 / n if n > 67 else 1.0
title_font_size = max(44, round(66 * ratio))

custom_style = Style(
    background=PAGE_BG,
    plot_background=PAGE_BG,
    foreground=INK,
    foreground_strong=INK,
    foreground_subtle=INK_MUTED,
    colors=IMPRINT,
    font_family=font,
    title_font_family=font,
    label_font_family=font,
    major_label_font_family=font,
    legend_font_family=font,
    tooltip_font_family=font,
    value_font_family=font,
    title_font_size=title_font_size,
    label_font_size=56,
    major_label_font_size=44,
    legend_font_size=44,
    tooltip_font_size=36,
    value_font_size=44,
    value_colors=[INK] * len(categories),
    opacity=1,
    opacity_hover=0.85,
    transition="200ms ease-in",
)

# Square canvas — 2400 × 2400 px (canonical pygal square)
chart = pygal.Pie(
    width=2400,
    height=2400,
    style=custom_style,
    inner_radius=0.58,
    title=title,
    show_legend=True,
    legend_at_bottom=True,
    legend_at_bottom_columns=len(categories),
    legend_box_size=44,
    margin=40,
    print_values=True,
    print_values_position="inside",
    print_labels=False,
    value_formatter=lambda v: f"{v / total * 100:.1f}%",
    truncate_legend=-1,
)

for cat, val in zip(categories, values, strict=True):
    chart.add(cat, val)

# Render to SVG, then inject center-label text (pygal has no native donut-hole label).
svg_text = chart.render(is_unicode=True)

# Locate donut center from SVG; fall back to fixed geometric calculation.
plot_match = re.search(r'<g transform="translate\(([\d.\-]+),\s*([\d.\-]+)\)"\s+class="plot"', svg_text)
slice_match = re.search(r'<path d="M([\d.\-]+)\s+([\d.\-]+)\s+A([\d.\-]+)', svg_text)

if plot_match and slice_match:
    plot_x = float(plot_match.group(1))
    plot_y = float(plot_match.group(2))
    top_x = float(slice_match.group(1))
    top_y = float(slice_match.group(2))
    outer_r = float(slice_match.group(3))
    cx = plot_x + top_x
    cy = plot_y + top_y + outer_r
else:
    # Fixed geometric center for 2400×2400 canvas: title ~280px top, legend ~160px bottom
    cx = 2400 / 2
    cy = 280 + (2400 - 280 - 160) / 2

# Center metric: muted label + divider + bold headline value.
label_y = cy - 110
divider_y = cy - 30
value_y = cy + 110
divider_half = 90

center_text = (
    f'<g class="center-metric">'
    f'<text x="{cx:.2f}" y="{label_y:.2f}" text-anchor="middle" '
    f'fill="{INK_SOFT}" style="font-size:50px;letter-spacing:4px;'
    f'text-transform:uppercase;font-family:{font};">Portfolio</text>'
    f'<line x1="{cx - divider_half:.2f}" y1="{divider_y:.2f}" '
    f'x2="{cx + divider_half:.2f}" y2="{divider_y:.2f}" '
    f'stroke="{INK_MUTED}" stroke-width="1.5" opacity="0.5"/>'
    f'<text x="{cx:.2f}" y="{value_y:.2f}" text-anchor="middle" '
    f'fill="{INK}" style="font-size:148px;font-weight:700;font-family:{font};">${total:,}K</text>'
    f"</g>"
)

output_svg = svg_text.replace("</svg>", f"{center_text}</svg>")

cairosvg.svg2png(bytestring=output_svg.encode("utf-8"), write_to=f"plot-{THEME}.png", output_width=2400)

html_content = f"""<!DOCTYPE html>
<html>
<head>
    <meta charset="utf-8">
    <title>donut-basic · python · pygal · anyplot.ai</title>
    <style>
        body {{ margin: 0; background: {PAGE_BG}; display: flex;
                justify-content: center; align-items: center; min-height: 100vh; }}
        .chart {{ max-width: 100%; height: auto; }}
    </style>
</head>
<body>
    <figure class="chart">
        {output_svg}
    </figure>
</body>
</html>
"""

with open(f"plot-{THEME}.html", "w", encoding="utf-8") as f:
    f.write(html_content)
Runnable source as JSON, for any HTTP client: https://api.anyplot.ai/specs/donut-basic/pygal/code. Any spec id and library id listed in llms-full.txt fit the same URL shape; every URL below is complete and callable.
{
  "spec_id": "donut-basic",
  "language": "python",
  "library": "pygal",
  "page": "https://anyplot.ai/donut-basic/python/pygal",
  "hub": "https://anyplot.ai/donut-basic",
  "code_json": "https://api.anyplot.ai/specs/donut-basic/pygal/code",
  "spec_json": "https://api.anyplot.ai/specs/donut-basic",
  "render_light_png": "https://storage.googleapis.com/anyplot-images/plots/donut-basic/python/pygal/plot-light.png",
  "render_dark_png": "https://storage.googleapis.com/anyplot-images/plots/donut-basic/python/pygal/plot-dark.png",
  "interactive_light_html": "https://storage.googleapis.com/anyplot-images/plots/donut-basic/python/pygal/plot-light.html",
  "interactive_dark_html": "https://storage.googleapis.com/anyplot-images/plots/donut-basic/python/pygal/plot-dark.html",
  "quality_score": 86.0,
  "license": "MIT",
  "guide": "https://anyplot.ai/llms.txt"
}
Part of Basic Donut Chart on anyplot.ai.