The same plot in 14 other libraries — JavaScript: Chart.js, Apache ECharts, Highcharts, MUI X Charts; Python: Altair, Bokeh, lets-plot, Matplotlib, Plotly, plotnine, Pygal, Seaborn; R: ggplot2; Julia: Makie.jl. Compare all 15 side by side: Basic Donut Chart in Python, R, Julia and JavaScript.
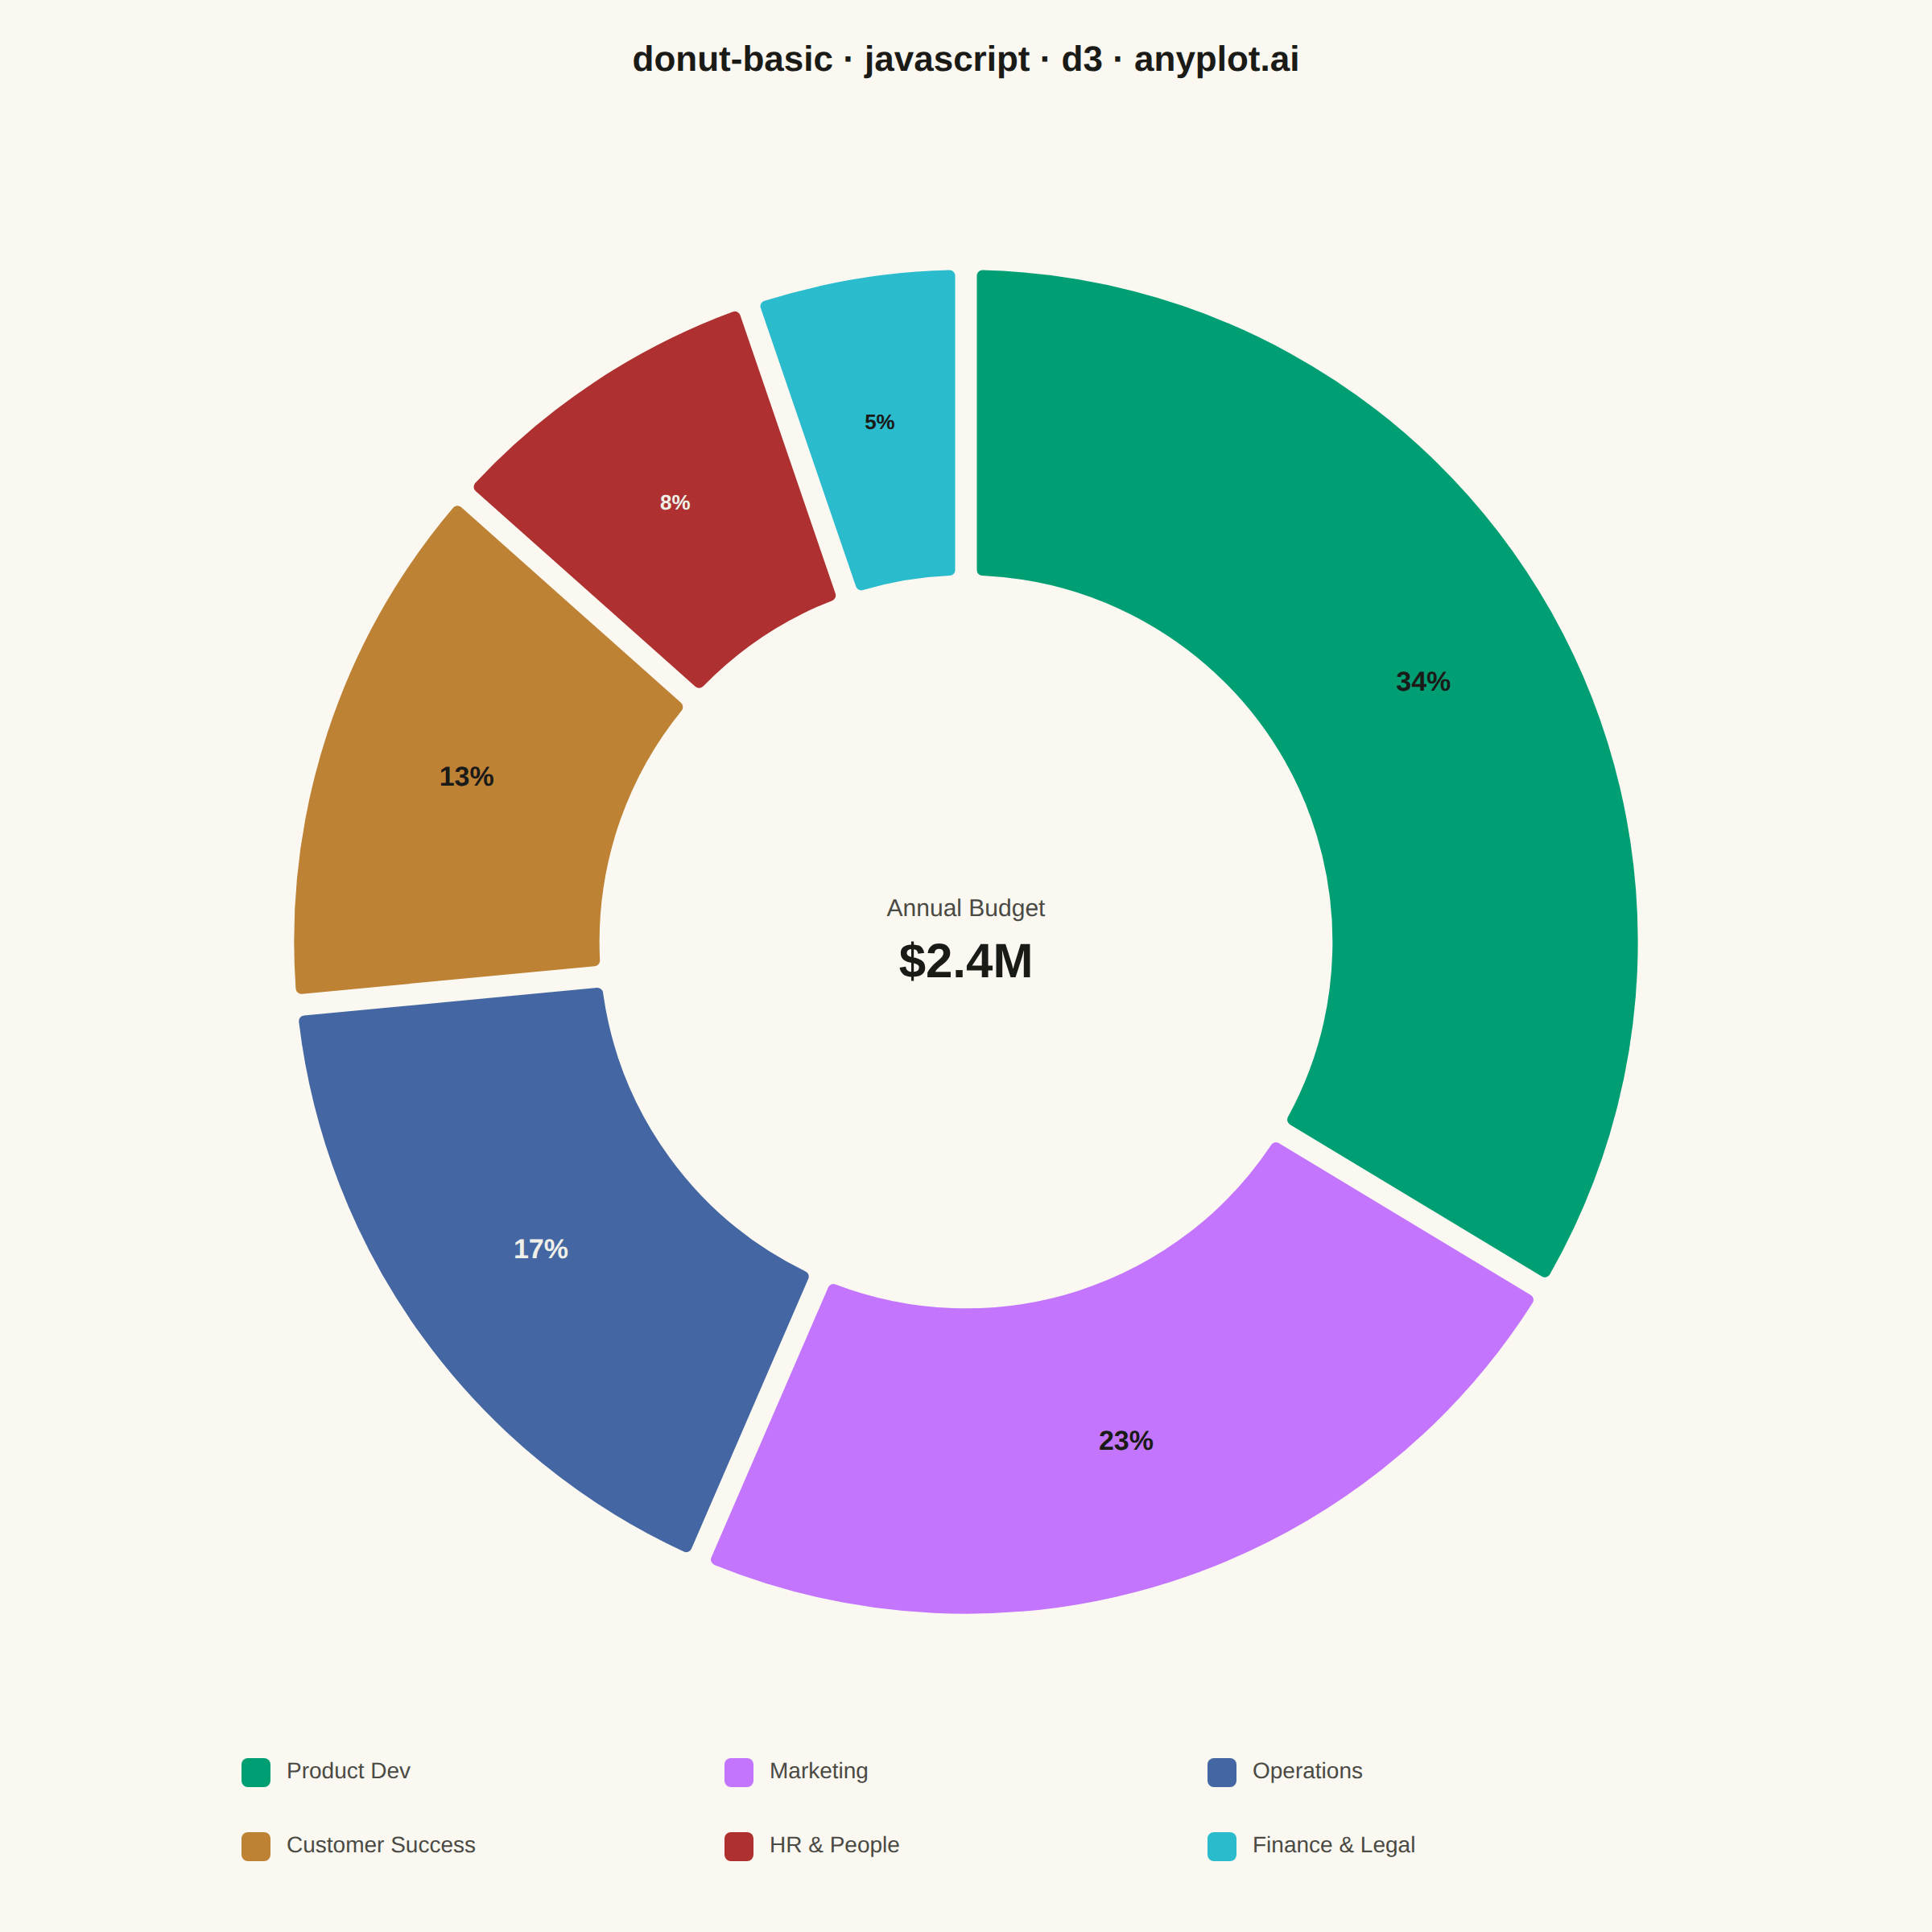
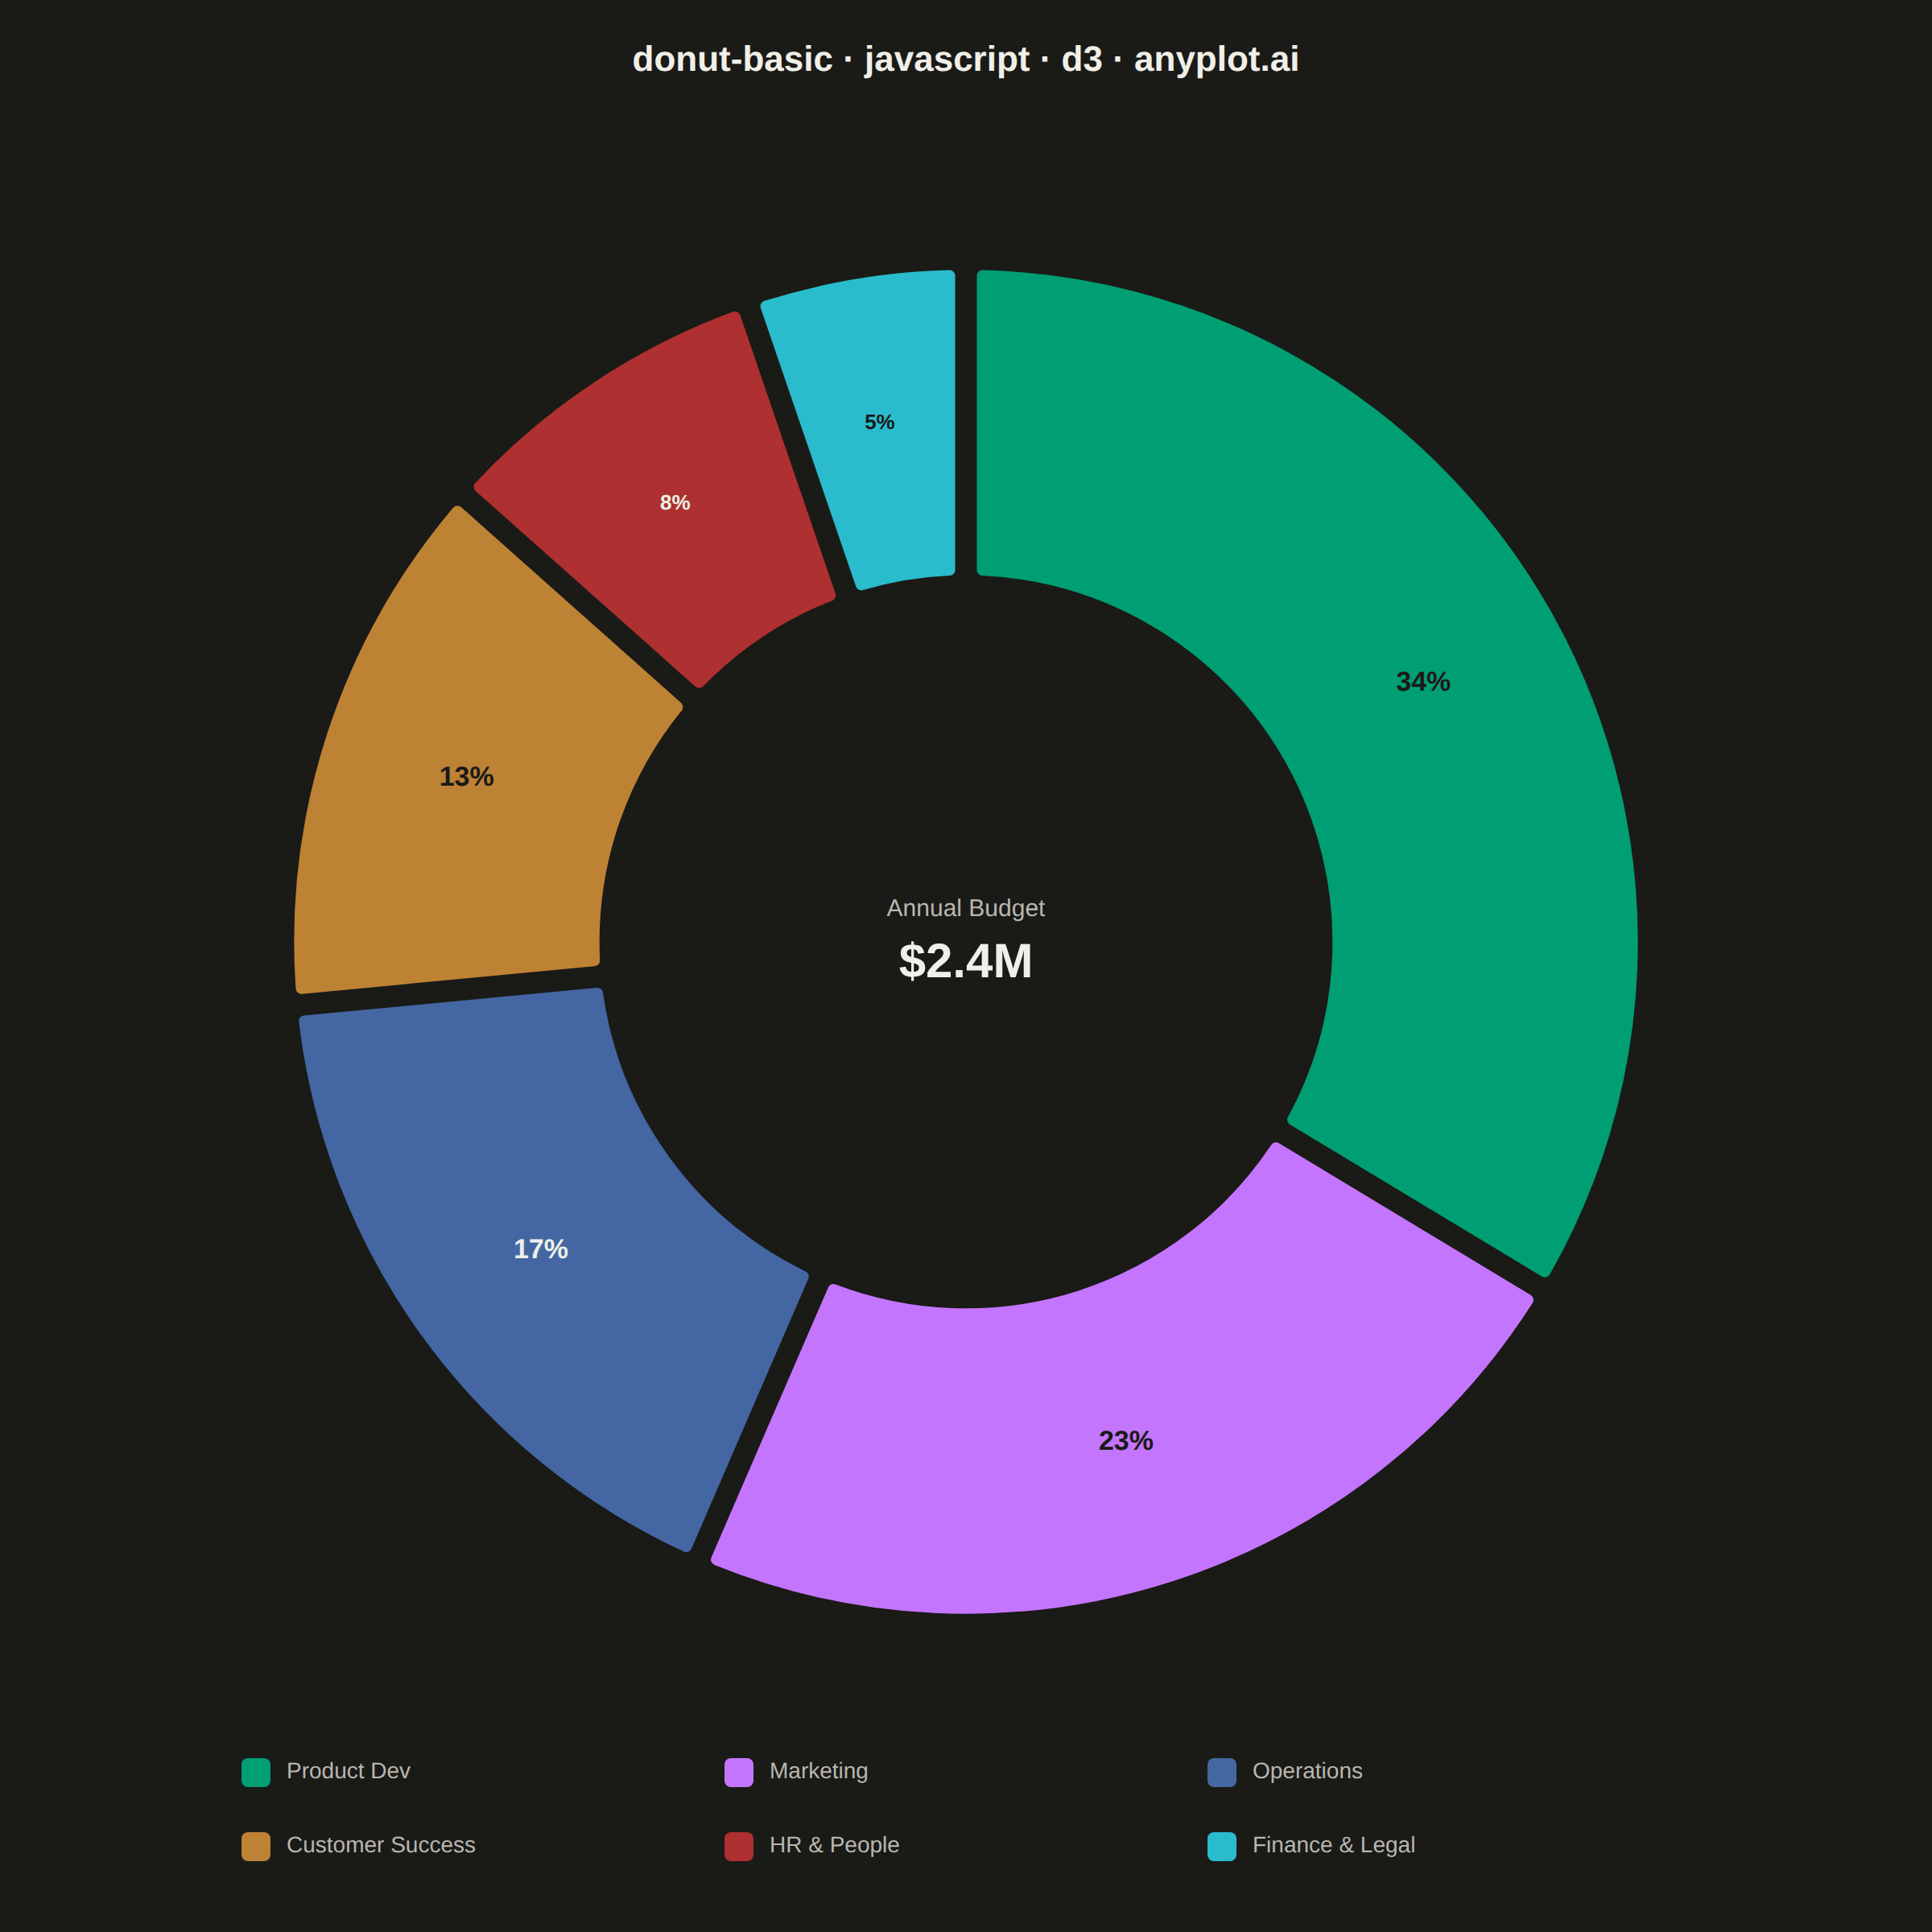
A donut chart (ring chart) showing proportions of categorical data as segments of a ring, with a hollow center. Similar to pie charts but the empty center can display summary statistics or additional information. The ring format can be easier to read when comparing segment sizes.
// anyplot.ai
// donut-basic: Basic Donut Chart
// Library: d3 7.9.0 | JavaScript 22.22.3
// Quality: 90/100 | Created: 2026-06-25

//# anyplot-orientation: square

const t = window.ANYPLOT_TOKENS;
const { width, height } = window.ANYPLOT_SIZE;

// Choose readable text color for a given fill hex (maximizes contrast)
function labelColor(hex) {
  const r = parseInt(hex.slice(1, 3), 16) / 255;
  const g = parseInt(hex.slice(3, 5), 16) / 255;
  const b = parseInt(hex.slice(5, 7), 16) / 255;
  const lin = (v) => (v <= 0.04045 ? v / 12.92 : ((v + 0.055) / 1.055) ** 2.4);
  const L = 0.2126 * lin(r) + 0.7152 * lin(g) + 0.0722 * lin(b);
  return L > 0.179 ? "#1A1A17" : "#F0EFE8";
}

// --- Data: Annual Budget Allocation by Department ---
const segments = [
  { label: "Product Dev",      value: 34 },
  { label: "Marketing",        value: 23 },
  { label: "Operations",       value: 17 },
  { label: "Customer Success", value: 13 },
  { label: "HR & People",      value: 8 },
  { label: "Finance & Legal",  value: 5 },
];

// --- Layout ---
const titleH     = 70;
const legendRowH = 46;
const legendPad  = 36;
const legendH    = 2 * legendRowH + legendPad;
const chartTop   = titleH + 28;
const chartH     = height - chartTop - legendH;
const cx         = width / 2;
const cy         = chartTop + chartH / 2;
const outerRadius = (Math.min(chartH, width) / 2) * 0.86;
const innerRadius = outerRadius * 0.54;

// --- SVG root ---
const svg = d3
  .select("#container")
  .append("svg")
  .attr("width", width)
  .attr("height", height);

// --- Pie + arc generators ---
const pie = d3.pie().value((d) => d.value).sort(null).padAngle(0.022);

const arc = d3.arc()
  .innerRadius(innerRadius)
  .outerRadius(outerRadius)
  .cornerRadius(5);

const midArc = d3.arc()
  .innerRadius(innerRadius + (outerRadius - innerRadius) * 0.52)
  .outerRadius(innerRadius + (outerRadius - innerRadius) * 0.52);

const slices = pie(segments);
const g = svg.append("g").attr("transform", `translate(${cx},${cy})`);

// --- Donut segments ---
g.selectAll("path")
  .data(slices)
  .join("path")
  .attr("d", arc)
  .attr("fill", (d, i) => t.palette[i])
  .attr("stroke", t.pageBg)
  .attr("stroke-width", 3);

// --- Percentage labels inside each segment ---
g.selectAll(".pct")
  .data(slices)
  .join("text")
  .attr("class", "pct")
  .attr("transform", (d) => `translate(${midArc.centroid(d)})`)
  .attr("text-anchor", "middle")
  .attr("dominant-baseline", "middle")
  .attr("fill", (d, i) => labelColor(t.palette[i]))
  .style("font-size", (d) => (d.data.value >= 10 ? "17px" : "13px"))
  .style("font-weight", "600")
  .text((d) => `${d.data.value}%`);

// --- Center annotation ---
g.append("text")
  .attr("text-anchor", "middle")
  .attr("y", -16)
  .attr("fill", t.inkSoft)
  .style("font-size", "15px")
  .text("Annual Budget");

g.append("text")
  .attr("text-anchor", "middle")
  .attr("y", 22)
  .attr("fill", t.ink)
  .style("font-size", "30px")
  .style("font-weight", "700")
  .text("$2.4M");

// --- Title ---
svg
  .append("text")
  .attr("x", width / 2)
  .attr("y", 44)
  .attr("text-anchor", "middle")
  .attr("fill", t.ink)
  .style("font-size", "22px")
  .style("font-weight", "600")
  .text("donut-basic · javascript · d3 · anyplot.ai");

// --- Legend: 2 rows × 3 columns ---
const swatchW   = 18;
const swatchGap = 10;
const legendW   = width * 0.75;
const colW      = legendW / 3;
const lgX0      = (width - legendW) / 2;
const lgY0      = height - legendH + 20;

segments.forEach((seg, i) => {
  const col = i % 3;
  const row = Math.floor(i / 3);
  const lx  = lgX0 + col * colW;
  const ly  = lgY0 + row * legendRowH;

  const item = svg.append("g").attr("transform", `translate(${lx},${ly})`);

  item
    .append("rect")
    .attr("width", swatchW)
    .attr("height", swatchW)
    .attr("rx", 4)
    .attr("fill", t.palette[i]);

  item
    .append("text")
    .attr("x", swatchW + swatchGap)
    .attr("y", swatchW / 2)
    .attr("dominant-baseline", "middle")
    .attr("fill", t.inkSoft)
    .style("font-size", "14px")
    .text(seg.label);
});
Runnable source as JSON, for any HTTP client: https://api.anyplot.ai/specs/donut-basic/d3/code. Any spec id and library id listed in llms-full.txt fit the same URL shape; every URL below is complete and callable.
{
  "spec_id": "donut-basic",
  "language": "javascript",
  "library": "d3",
  "page": "https://anyplot.ai/donut-basic/javascript/d3",
  "hub": "https://anyplot.ai/donut-basic",
  "code_json": "https://api.anyplot.ai/specs/donut-basic/d3/code",
  "spec_json": "https://api.anyplot.ai/specs/donut-basic",
  "render_light_png": "https://storage.googleapis.com/anyplot-images/plots/donut-basic/javascript/d3/plot-light.png",
  "render_dark_png": "https://storage.googleapis.com/anyplot-images/plots/donut-basic/javascript/d3/plot-dark.png",
  "interactive_light_html": "https://storage.googleapis.com/anyplot-images/plots/donut-basic/javascript/d3/plot-light.html",
  "interactive_dark_html": "https://storage.googleapis.com/anyplot-images/plots/donut-basic/javascript/d3/plot-dark.html",
  "quality_score": 90.0,
  "license": "MIT",
  "guide": "https://anyplot.ai/llms.txt"
}
Part of Basic Donut Chart on anyplot.ai.