The same plot in 14 other libraries — JavaScript: Chart.js, D3.js, Apache ECharts, Highcharts; Python: Altair, Bokeh, lets-plot, Matplotlib, Plotly, plotnine, Pygal, Seaborn; R: ggplot2; Julia: Makie.jl. Compare all 15 side by side: Basic Donut Chart in Python, R, Julia and JavaScript.
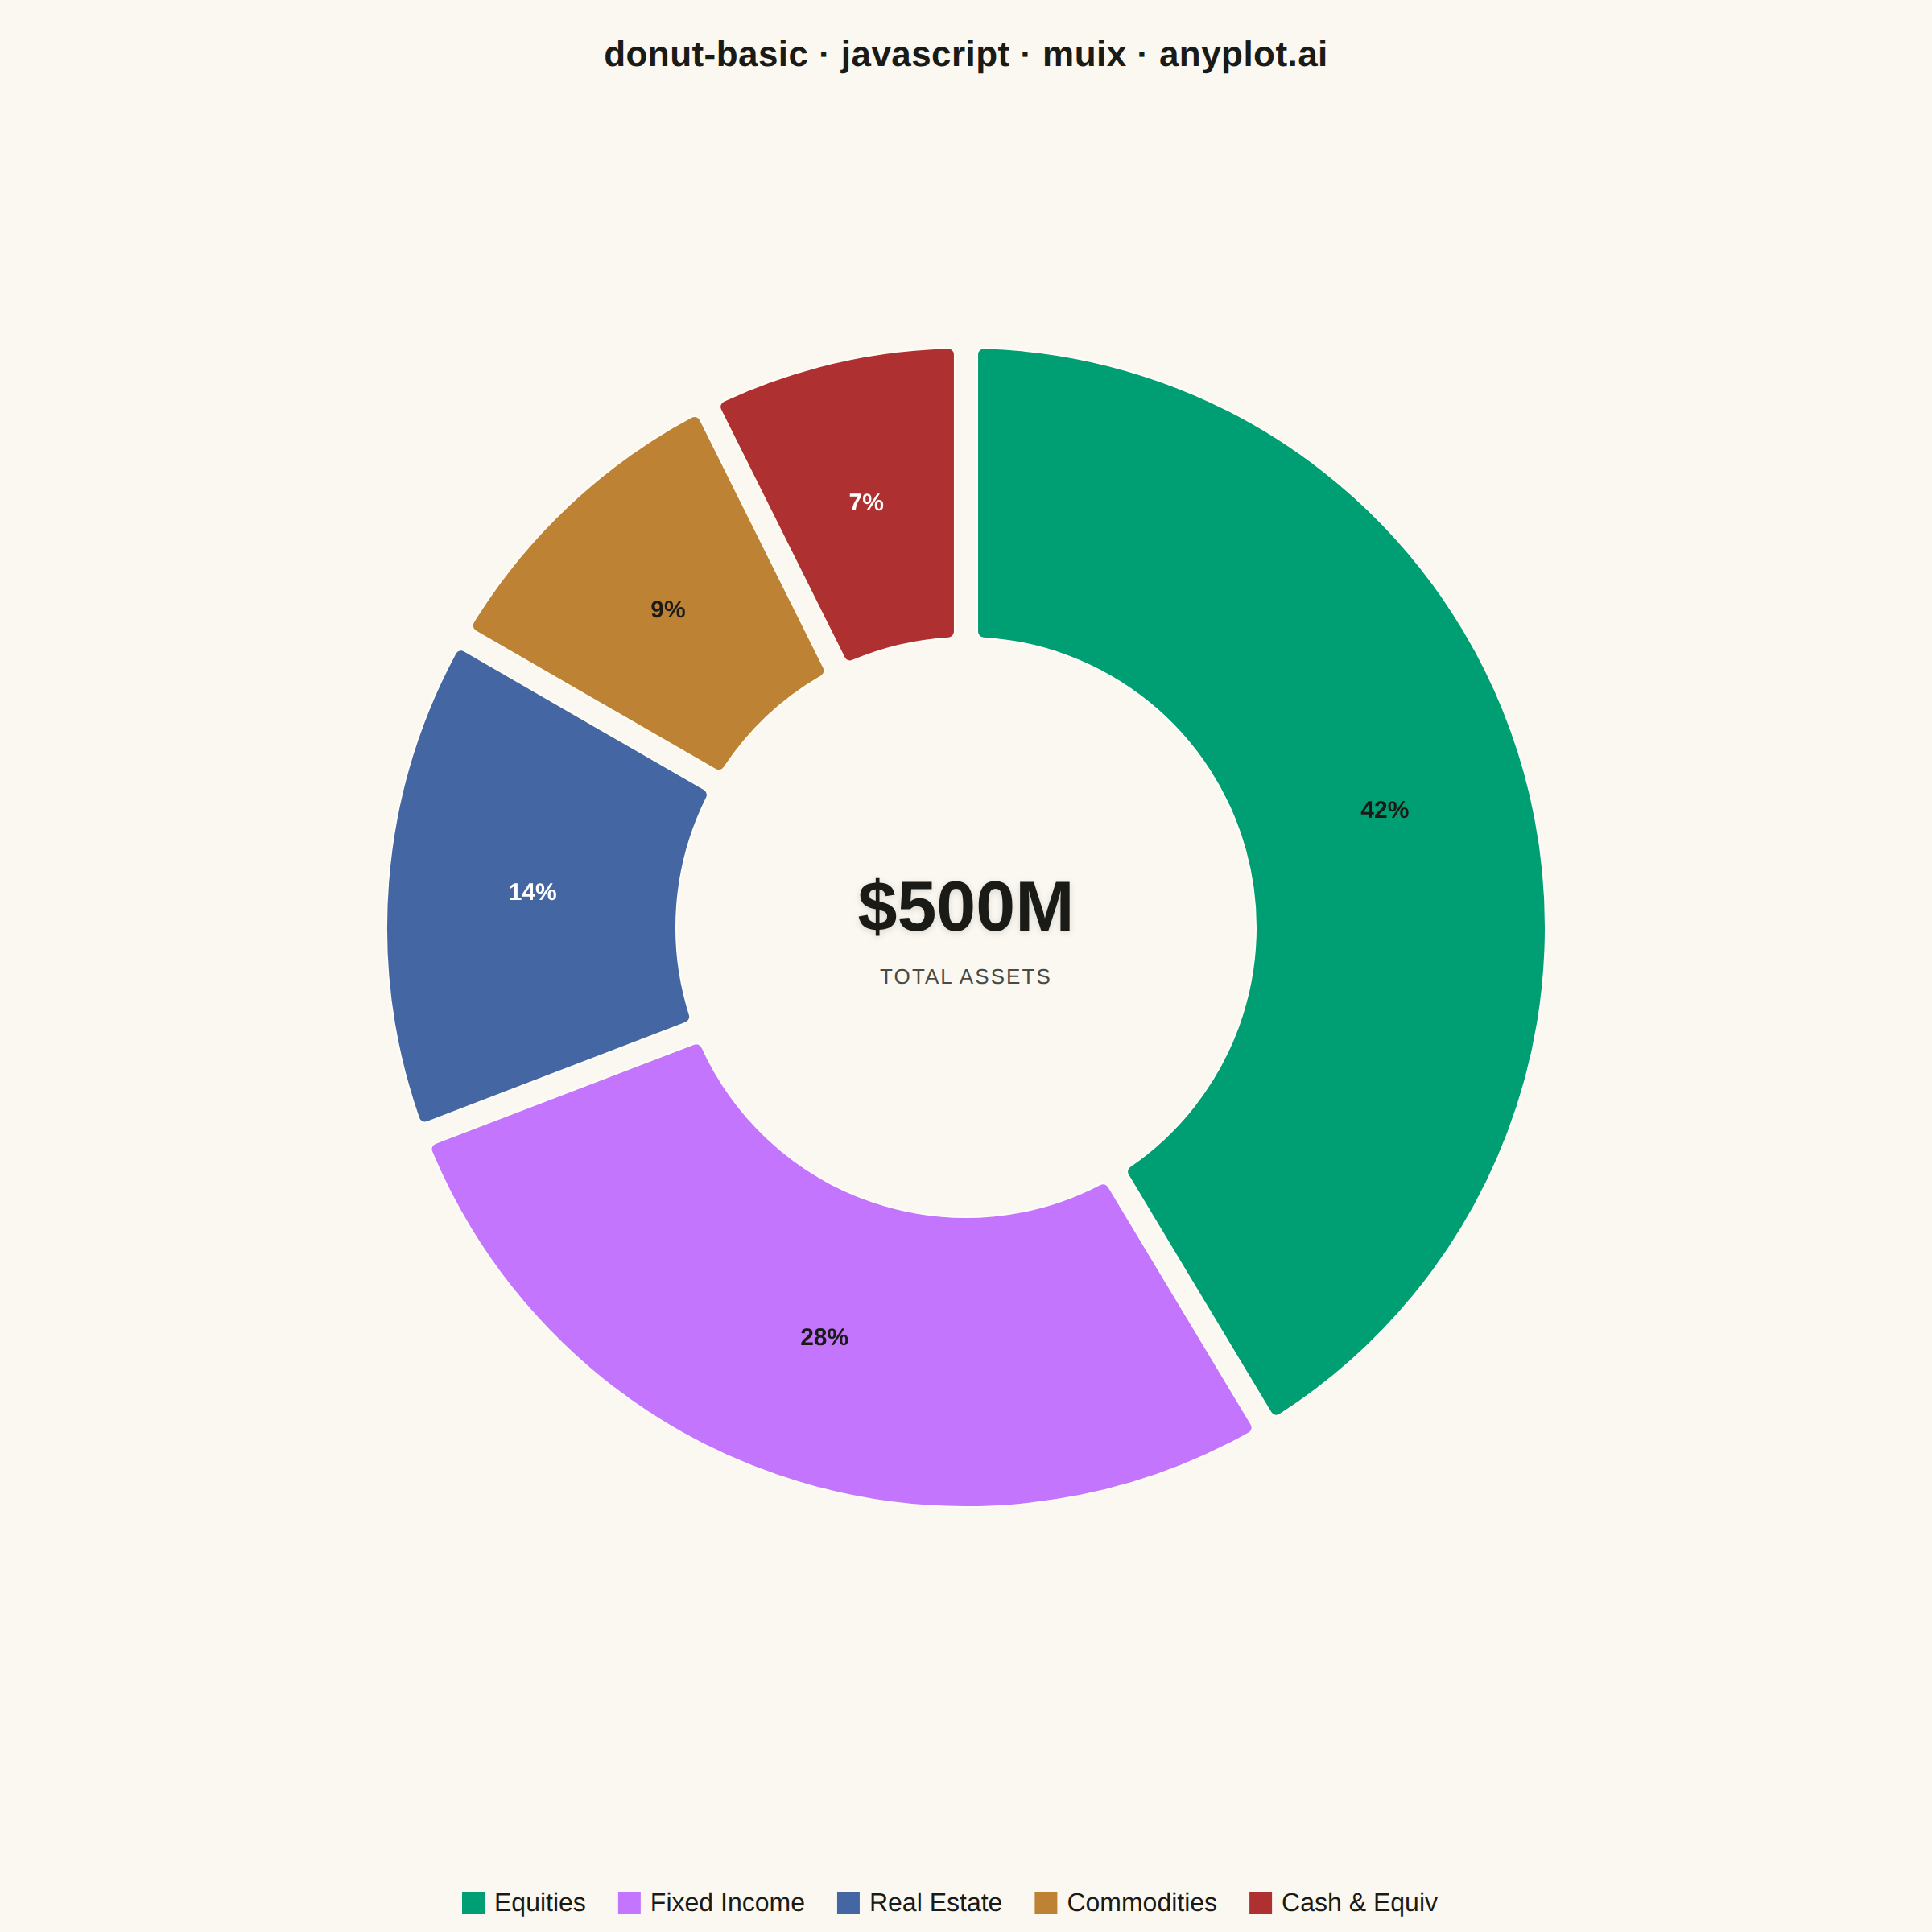
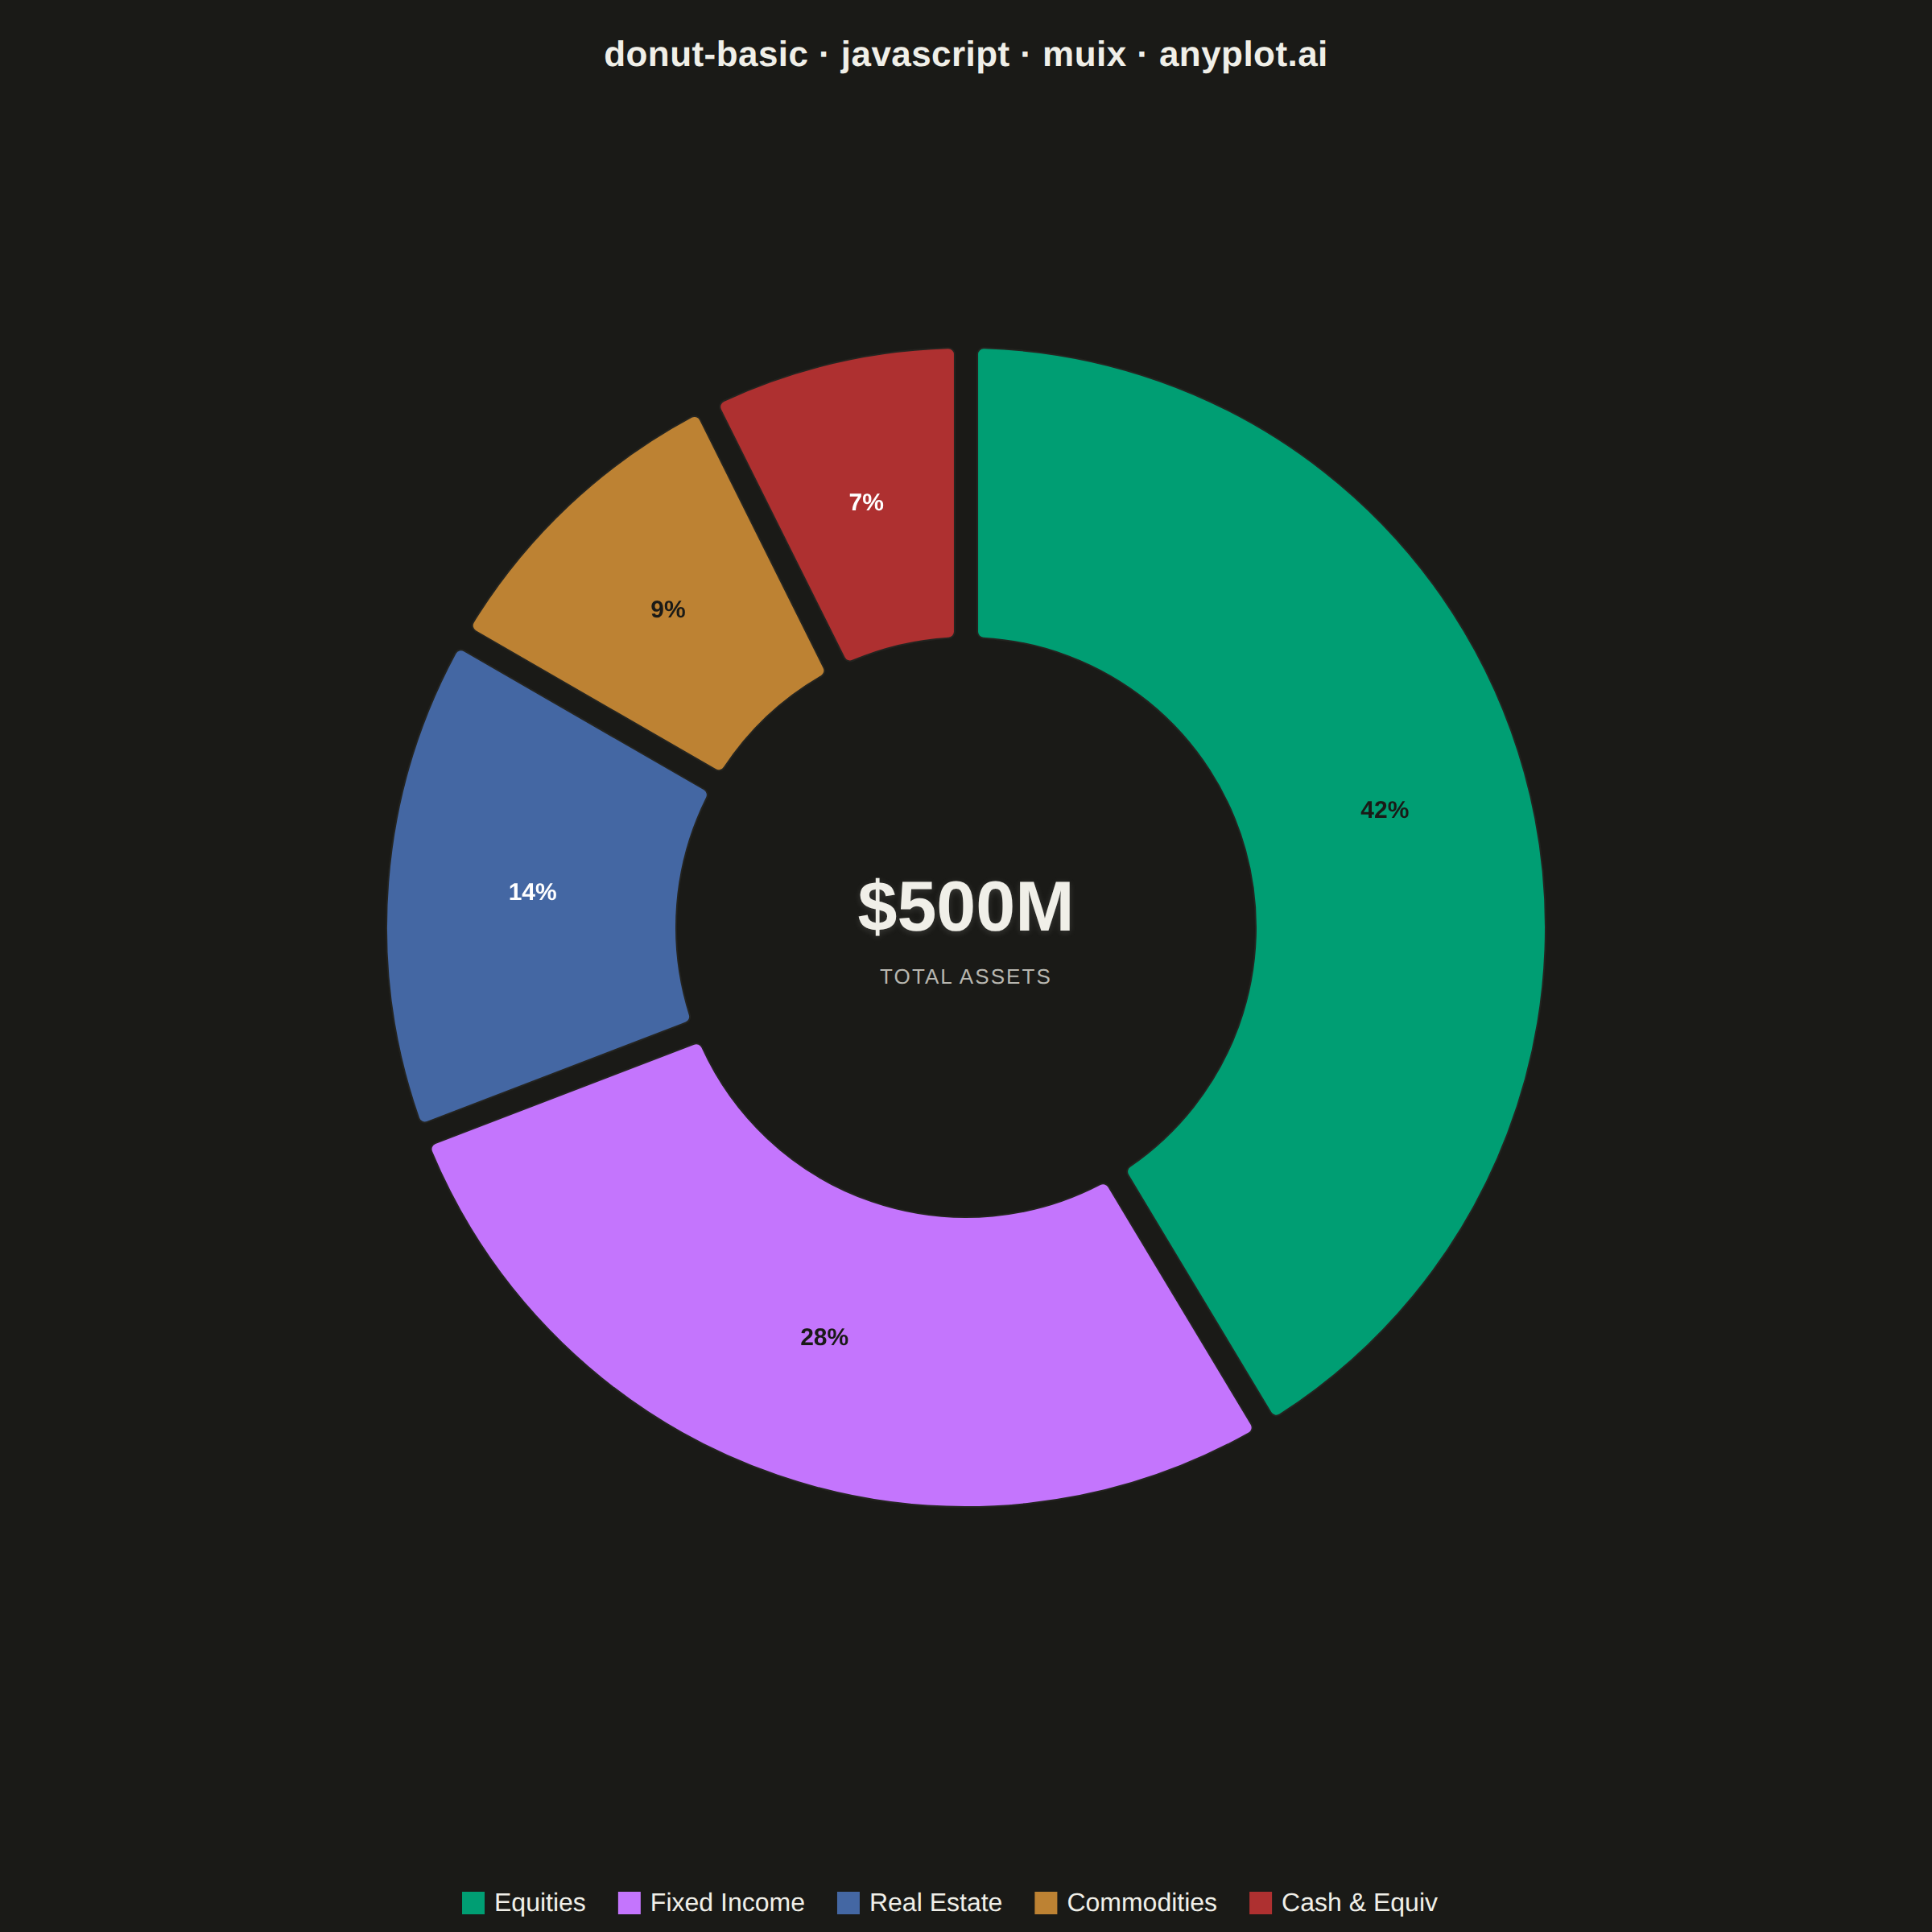
A donut chart (ring chart) showing proportions of categorical data as segments of a ring, with a hollow center. Similar to pie charts but the empty center can display summary statistics or additional information. The ring format can be easier to read when comparing segment sizes.
// anyplot.ai
// donut-basic: Basic Donut Chart
// Library: muix 7.29.1 | JavaScript 22.23.0
// Quality: 89/100 | Created: 2026-06-25
//# anyplot-orientation: square
// anyplot.ai
// donut-basic: Basic Donut Chart
// Library: MUI X Charts | React | Node 22
// License: @mui/x-charts — MIT (community). Pro/Premium are out of scope.
// Quality: pending | Created: 2026-06-25

import { PieChart } from "@mui/x-charts/PieChart";

const t = window.ANYPLOT_TOKENS;

// Portfolio allocation by asset class (values are percentages, sum = 100)
const portfolioData = [
  { id: 0, value: 42, label: "Equities" },
  { id: 1, value: 28, label: "Fixed Income" },
  { id: 2, value: 14, label: "Real Estate" },
  { id: 3, value: 9, label: "Commodities" },
  { id: 4, value: 7, label: "Cash & Equiv" },
];

const TITLE = "donut-basic · javascript · muix · anyplot.ai";
const MARGIN = { top: 72, bottom: 120, left: 60, right: 60 };
const INNER_RADIUS = 180;
const OUTER_RADIUS = 360;

// Per-segment label fill chosen for maximum WCAG contrast against each Imprint color.
// Luminance (WCAG rel. lum.): green 0.26, lavender 0.31, ochre 0.27 → dark text wins;
// blue 0.13, red 0.11 → white text wins. Fixed hex works in both light and dark themes
// because segment colors are theme-invariant.
const LABEL_FILLS = ["#1A1A17", "#1A1A17", "#FFFFFF", "#1A1A17", "#FFFFFF"];

export default function Chart() {
  const { width, height } = window.ANYPLOT_SIZE;

  // MUI X centers the pie in the drawing area; compute that center for the overlay
  const pieCy = (MARGIN.top + height - MARGIN.bottom) / 2;

  return (
    <div
      style={{
        position: "relative",
        width,
        height,
        fontFamily: "'Segoe UI', Roboto, 'Helvetica Neue', Arial, sans-serif",
      }}
    >
      {/* Title */}
      <div
        style={{
          position: "absolute",
          top: 20,
          left: 0,
          right: 0,
          textAlign: "center",
          fontSize: 22,
          fontWeight: 600,
          color: t.ink,
          letterSpacing: "0.01em",
          lineHeight: 1.3,
        }}
      >
        {TITLE}
      </div>

      {/* Donut chart — Imprint palette, animation off */}
      <PieChart
        width={width}
        height={height}
        colors={t.palette}
        skipAnimation
        margin={MARGIN}
        series={[
          {
            data: portfolioData,
            innerRadius: INNER_RADIUS,
            outerRadius: OUTER_RADIUS,
            paddingAngle: 2,
            cornerRadius: 4,
            arcLabel: (item) => `${item.value}%`,
            arcLabelMinAngle: 18,
          },
        ]}
        slotProps={{
          legend: {
            direction: "row",
            position: { vertical: "bottom", horizontal: "middle" },
            padding: 0,
            itemMarkWidth: 14,
            itemMarkHeight: 14,
            markGap: 6,
            itemGap: 20,
          },
        }}
        sx={{
          "& .MuiPieArcLabel-root": { fontSize: 15, fontWeight: "bold" },
          // Per-segment contrast-optimal fills — nth-child matches data render order
          "& .MuiPieArcLabel-root:nth-child(1)": { fill: LABEL_FILLS[0] },
          "& .MuiPieArcLabel-root:nth-child(2)": { fill: LABEL_FILLS[1] },
          "& .MuiPieArcLabel-root:nth-child(3)": { fill: LABEL_FILLS[2] },
          "& .MuiPieArcLabel-root:nth-child(4)": { fill: LABEL_FILLS[3] },
          "& .MuiPieArcLabel-root:nth-child(5)": { fill: LABEL_FILLS[4] },
        }}
      />

      {/* Center overlay — total portfolio value */}
      <div
        style={{
          position: "absolute",
          top: pieCy,
          left: width / 2,
          transform: "translate(-50%, -50%)",
          textAlign: "center",
          pointerEvents: "none",
          lineHeight: 1.2,
        }}
      >
        <div
          style={{
            fontSize: 44,
            fontWeight: 700,
            color: t.ink,
            textShadow: `0 1px 4px ${t.grid}`,
          }}
        >
          $500M
        </div>
        <div
          style={{
            fontSize: 13,
            color: t.inkSoft,
            marginTop: 8,
            letterSpacing: "0.08em",
            textTransform: "uppercase",
          }}
        >
          Total Assets
        </div>
      </div>
    </div>
  );
}
Runnable source as JSON, for any HTTP client: https://api.anyplot.ai/specs/donut-basic/muix/code. Any spec id and library id listed in llms-full.txt fit the same URL shape; every URL below is complete and callable.
{
  "spec_id": "donut-basic",
  "language": "javascript",
  "library": "muix",
  "page": "https://anyplot.ai/donut-basic/javascript/muix",
  "hub": "https://anyplot.ai/donut-basic",
  "code_json": "https://api.anyplot.ai/specs/donut-basic/muix/code",
  "spec_json": "https://api.anyplot.ai/specs/donut-basic",
  "render_light_png": "https://storage.googleapis.com/anyplot-images/plots/donut-basic/javascript/muix/plot-light.png",
  "render_dark_png": "https://storage.googleapis.com/anyplot-images/plots/donut-basic/javascript/muix/plot-dark.png",
  "interactive_light_html": "https://storage.googleapis.com/anyplot-images/plots/donut-basic/javascript/muix/plot-light.html",
  "interactive_dark_html": "https://storage.googleapis.com/anyplot-images/plots/donut-basic/javascript/muix/plot-dark.html",
  "quality_score": 89.0,
  "license": "MIT",
  "guide": "https://anyplot.ai/llms.txt"
}
Part of Basic Donut Chart on anyplot.ai.