The same plot in 14 other libraries — JavaScript: D3.js, Apache ECharts, Highcharts, MUI X Charts; Python: Altair, Bokeh, lets-plot, Matplotlib, Plotly, plotnine, Pygal, Seaborn; R: ggplot2; Julia: Makie.jl. Compare all 15 side by side: Nested Donut Chart in Python, R, Julia and JavaScript.
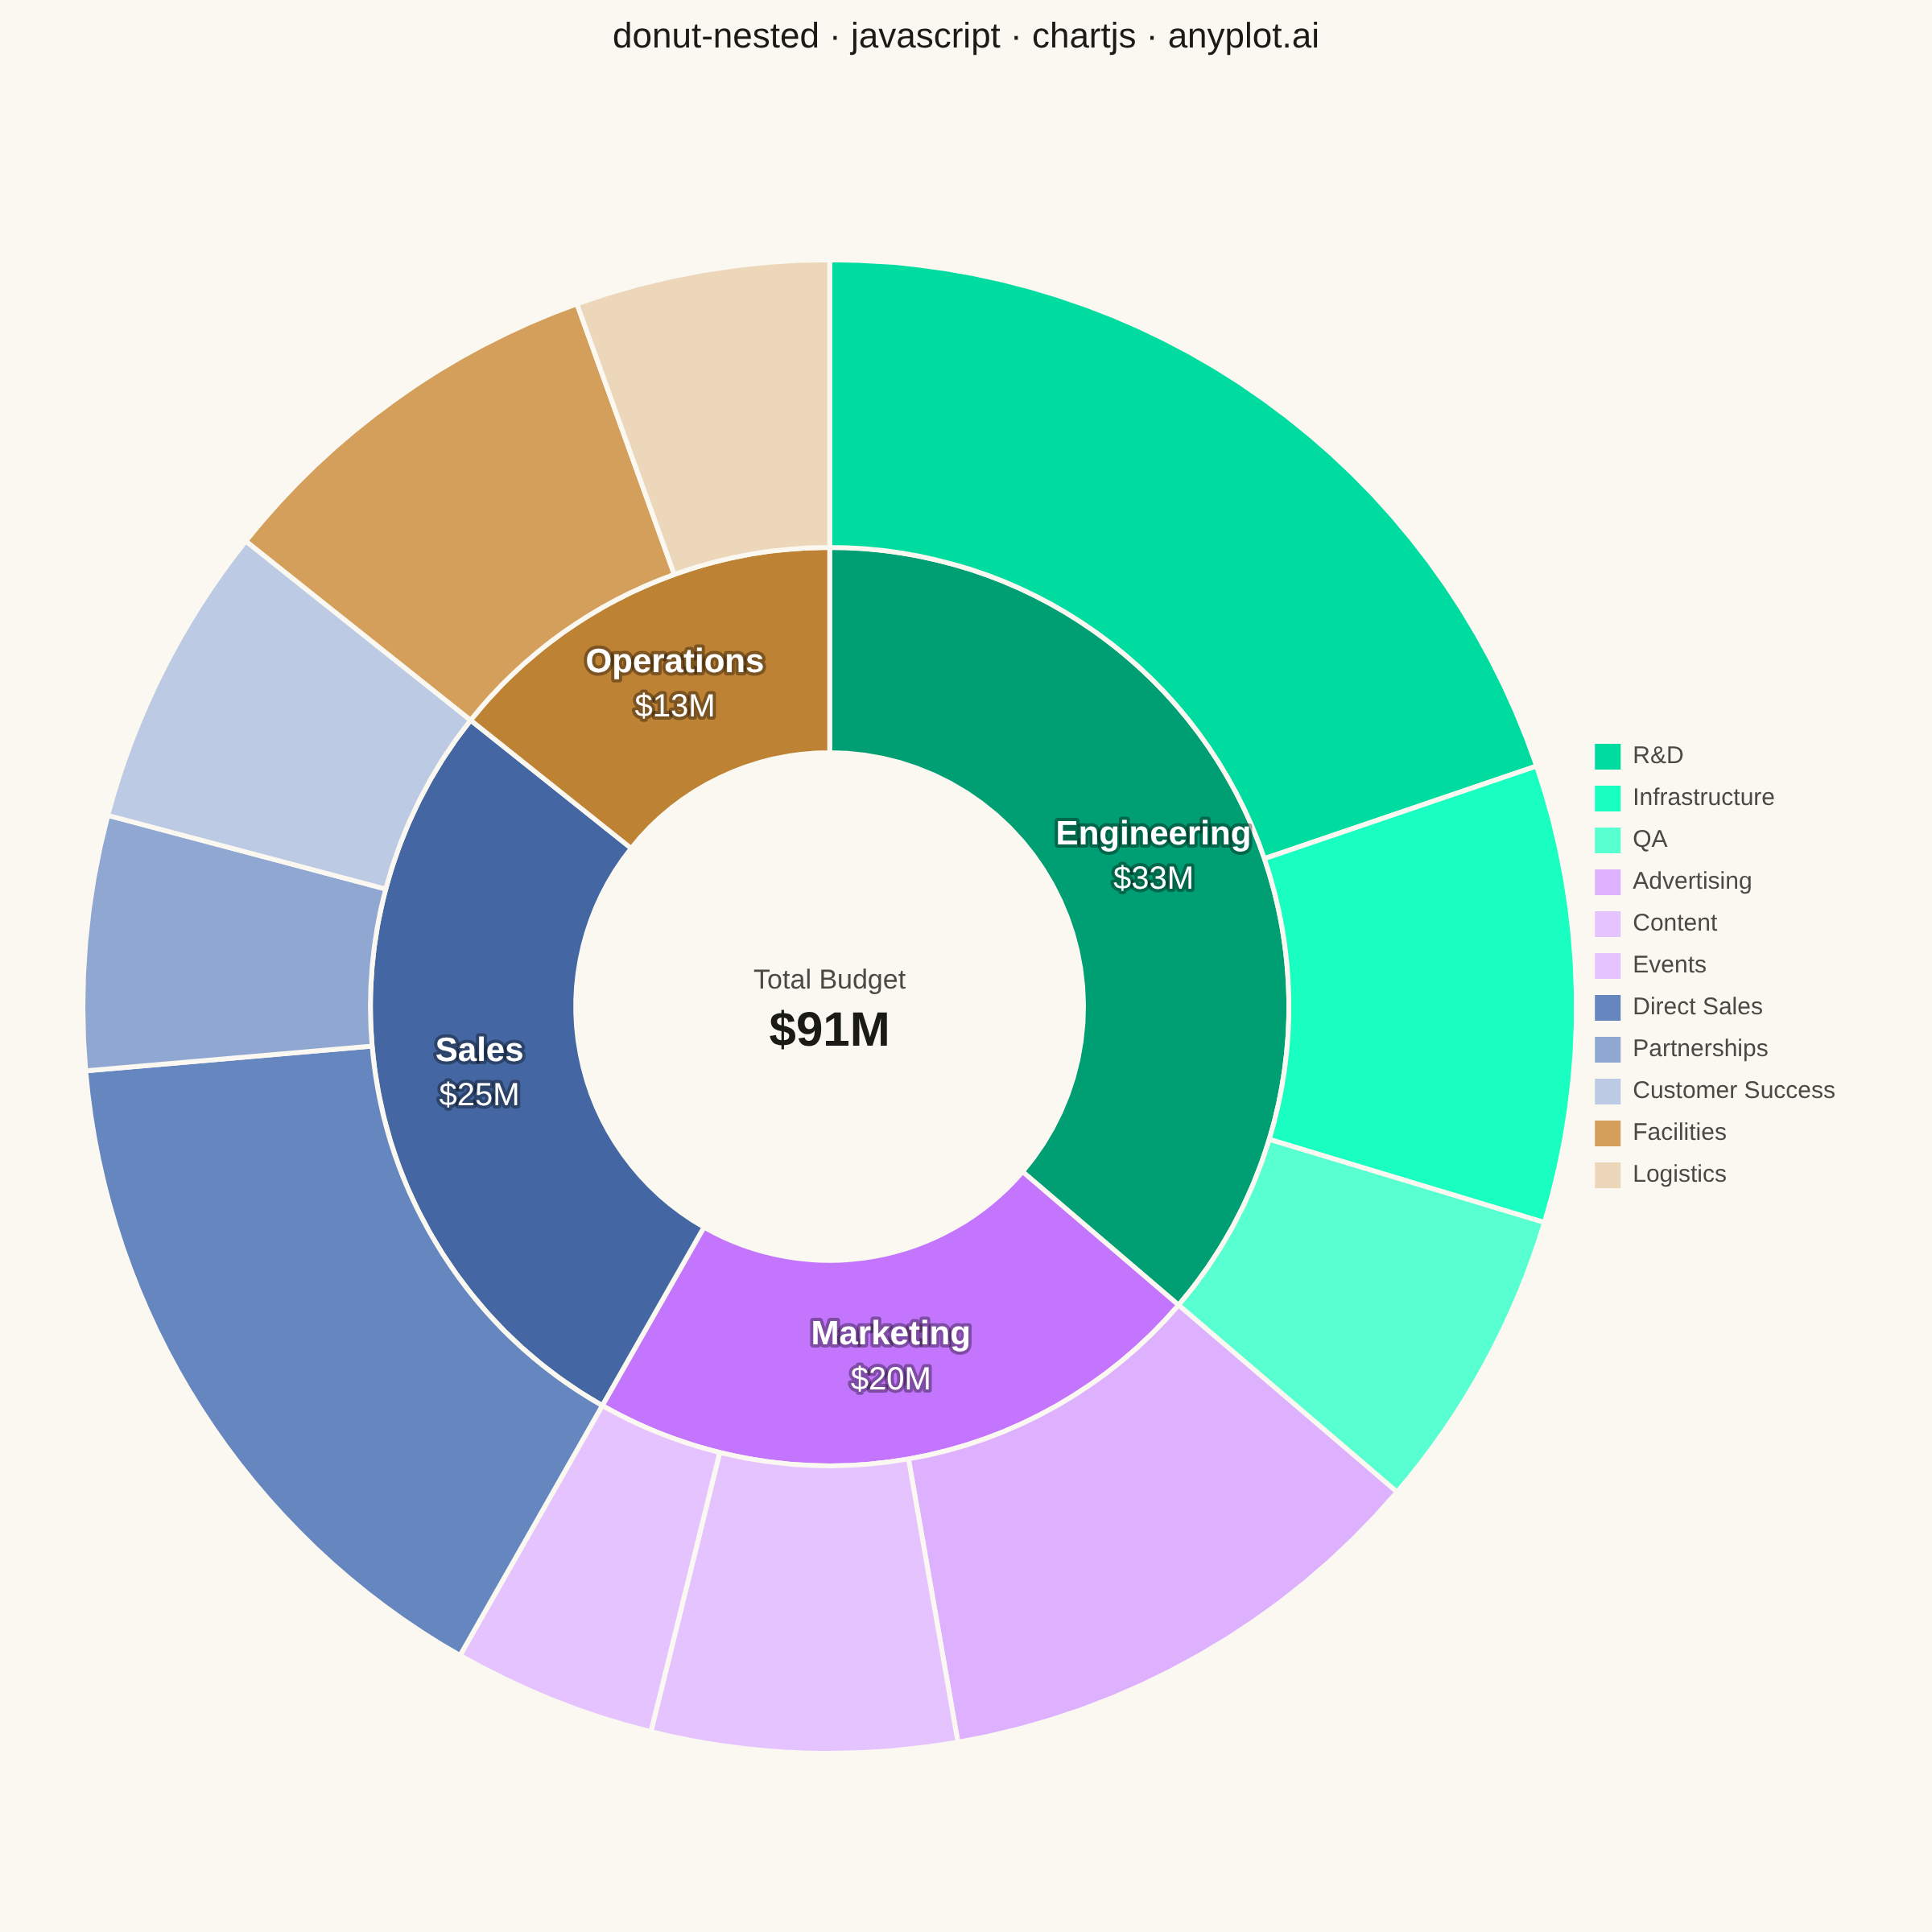
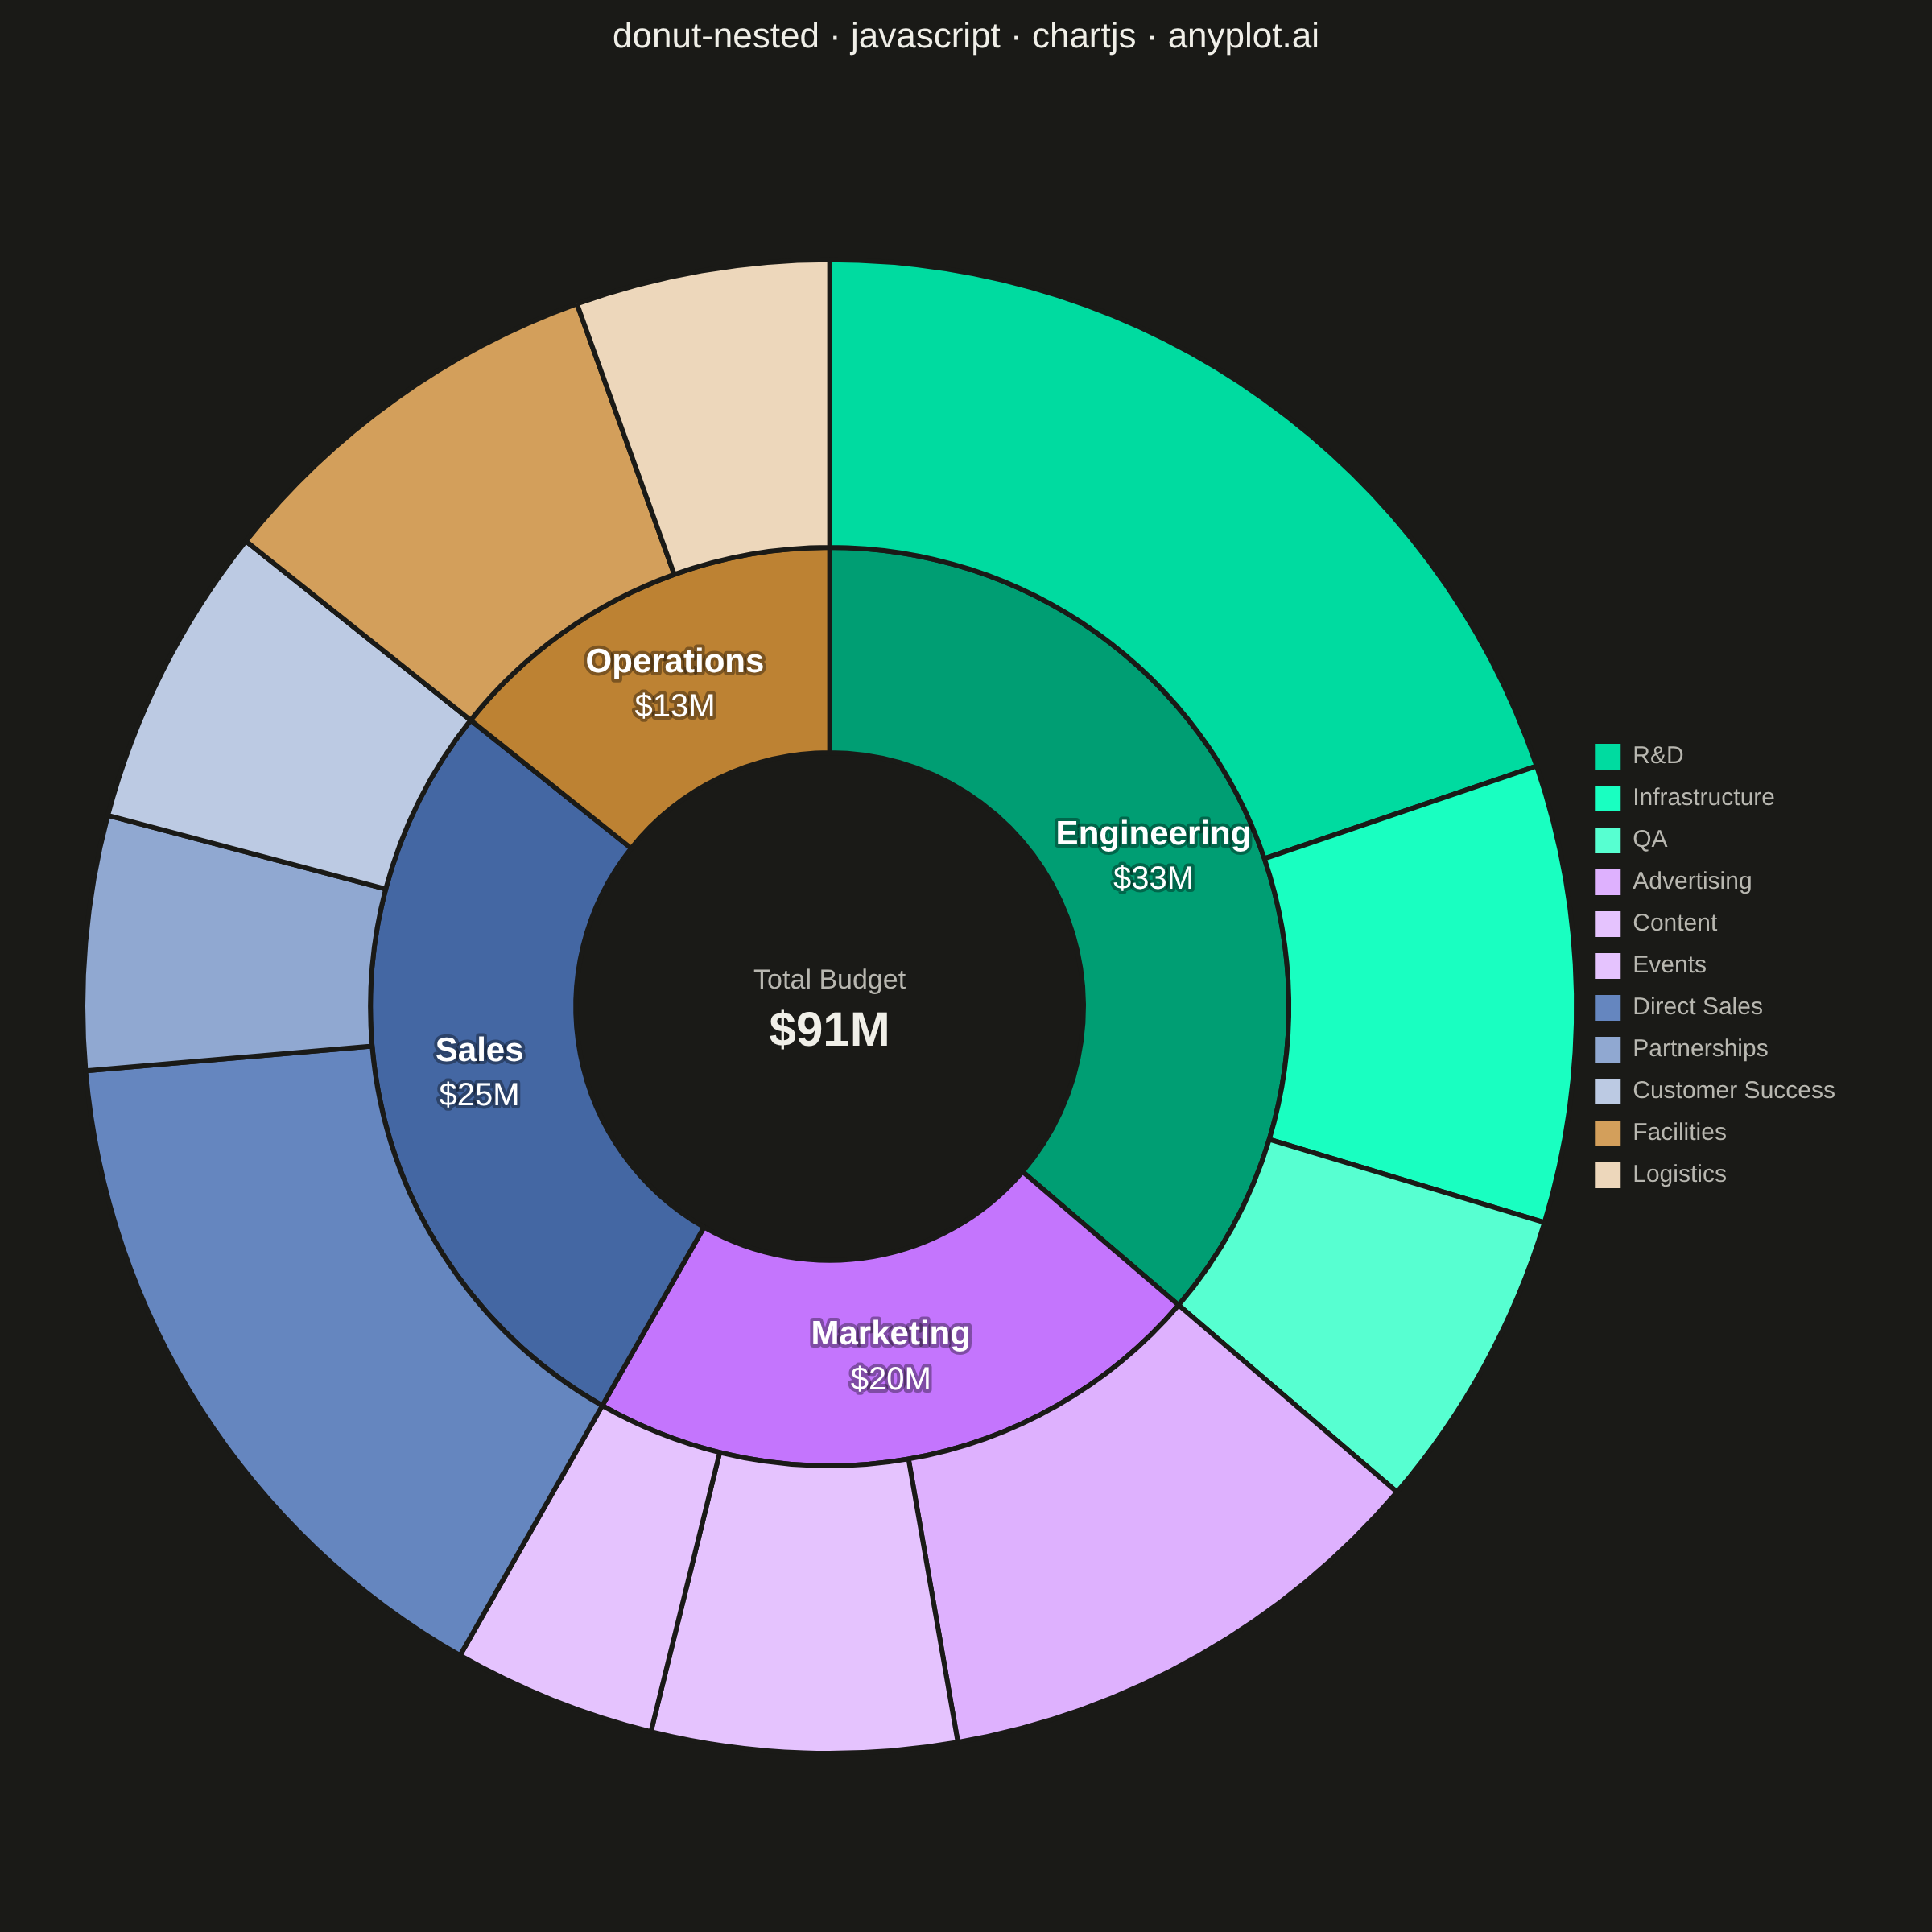
A nested donut chart displays hierarchical data as multiple concentric rings, where each ring represents a level of the hierarchy. Inner rings show parent categories while outer rings show their subdivisions. This visualization effectively reveals part-to-whole relationships across multiple levels while maintaining the familiar donut format.
// anyplot.ai
// donut-nested: Nested Donut Chart
// Library: chartjs 4.4.7 | JavaScript 22.23.2
// Quality: 93/100 | Created: 2026-08-18

//# anyplot-orientation: square
const t = window.ANYPLOT_TOKENS;

// --- Data (in-memory, deterministic) ----------------------------------------
// Company budget: department totals (inner ring) split into expense
// categories (outer ring). Category values sum exactly to their parent's
// total, and children are listed grouped by department in the same order as
// the departments array, so the two rings' arc boundaries line up radially.
const departments = [
  {
    name: "Engineering",
    color: t.palette[0],
    children: [
      { name: "R&D", value: 18 },
      { name: "Infrastructure", value: 9 },
      { name: "QA", value: 6 },
    ],
  },
  {
    name: "Marketing",
    color: t.palette[1],
    children: [
      { name: "Advertising", value: 10 },
      { name: "Content", value: 6 },
      { name: "Events", value: 4 },
    ],
  },
  {
    name: "Sales",
    color: t.palette[2],
    children: [
      { name: "Direct Sales", value: 14 },
      { name: "Partnerships", value: 5 },
      { name: "Customer Success", value: 6 },
    ],
  },
  {
    name: "Operations",
    color: t.palette[3],
    children: [
      { name: "Facilities", value: 8 },
      { name: "Logistics", value: 5 },
    ],
  },
];

// --- Color families: children share their parent's hue at rising lightness -
function hexToHsl(hex) {
  const r = parseInt(hex.slice(1, 3), 16) / 255;
  const g = parseInt(hex.slice(3, 5), 16) / 255;
  const b = parseInt(hex.slice(5, 7), 16) / 255;
  const max = Math.max(r, g, b);
  const min = Math.min(r, g, b);
  let h = 0;
  let s = 0;
  const l = (max + min) / 2;
  if (max !== min) {
    const d = max - min;
    s = l > 0.5 ? d / (2 - max - min) : d / (max + min);
    if (max === r) h = (g - b) / d + (g < b ? 6 : 0);
    else if (max === g) h = (b - r) / d + 2;
    else h = (r - g) / d + 4;
    h /= 6;
  }
  return [h * 360, s * 100, l * 100];
}

function hslToHex(h, s, l) {
  const sf = s / 100;
  const lf = l / 100;
  const c = (1 - Math.abs(2 * lf - 1)) * sf;
  const x = c * (1 - Math.abs(((h / 60) % 2) - 1));
  const m = lf - c / 2;
  let rgb;
  if (h < 60) rgb = [c, x, 0];
  else if (h < 120) rgb = [x, c, 0];
  else if (h < 180) rgb = [0, c, x];
  else if (h < 240) rgb = [0, x, c];
  else if (h < 300) rgb = [x, 0, c];
  else rgb = [c, 0, x];
  const toHex = (v) =>
    Math.round((v + m) * 255)
      .toString(16)
      .padStart(2, "0");
  return `#${toHex(rgb[0])}${toHex(rgb[1])}${toHex(rgb[2])}`;
}

function childShade(baseHex, index, count) {
  const [h, s, l] = hexToHsl(baseHex);
  const step = count > 1 ? 24 / (count - 1) : 0;
  const lightness = Math.min(l + 12 + step * index, 88);
  return hslToHex(h, s, lightness);
}

// --- Flatten into the two rings ---------------------------------------------
const departmentLabels = departments.map((d) => d.name);
const departmentTotals = departments.map((d) =>
  d.children.reduce((sum, c) => sum + c.value, 0),
);
const departmentColors = departments.map((d) => d.color);

const categoryLabels = departments.flatMap((d) => d.children.map((c) => c.name));
const categoryValues = departments.flatMap((d) => d.children.map((c) => c.value));
const categoryColors = departments.flatMap((d) =>
  d.children.map((c, i) => childShade(d.color, i, d.children.length)),
);
const grandTotal = departmentTotals.reduce((sum, v) => sum + v, 0);

// --- Mount -------------------------------------------------------------------
const canvas = document.createElement("canvas");
document.getElementById("container").appendChild(canvas);

// --- Plugin: direct labels on the department ring's large segments ---------
// (Chart.js draws dataset 0 as the outermost ring, working inward, so dataset
// index 1 — the department ring — is the one with enough radial room and few
// enough segments for on-arc labels; the finer category ring gets a legend.)
const ringLabelsPlugin = {
  id: "ringLabels",
  afterDatasetsDraw(chart) {
    const { ctx } = chart;
    const meta = chart.getDatasetMeta(1);
    ctx.save();
    ctx.textAlign = "center";
    ctx.textBaseline = "middle";
    ctx.lineJoin = "round";
    meta.data.forEach((arc, i) => {
      const angle = (arc.startAngle + arc.endAngle) / 2;
      const radius = (arc.innerRadius + arc.outerRadius) / 2;
      const x = arc.x + Math.cos(angle) * radius;
      const y = arc.y + Math.sin(angle) * radius;

      ctx.font = "600 21px sans-serif";
      ctx.strokeStyle = "rgba(0,0,0,0.35)";
      ctx.lineWidth = 4;
      ctx.strokeText(departmentLabels[i], x, y - 14);
      ctx.fillStyle = "#FFFFFF";
      ctx.fillText(departmentLabels[i], x, y - 14);

      ctx.font = "400 20px sans-serif";
      ctx.strokeText(`$${departmentTotals[i]}M`, x, y + 14);
      ctx.fillText(`$${departmentTotals[i]}M`, x, y + 14);
    });

    // Center label in the donut hole: the grand total ties the two rings
    // together into one headline number rather than a plain breakdown.
    const center = meta.data[0];
    ctx.font = "400 17px sans-serif";
    ctx.fillStyle = t.inkSoft;
    ctx.strokeStyle = "transparent";
    ctx.lineWidth = 0;
    ctx.fillText("Total Budget", center.x, center.y - 16);
    ctx.font = "700 30px sans-serif";
    ctx.fillStyle = t.ink;
    ctx.fillText(`$${grandTotal}M`, center.x, center.y + 16);
    ctx.restore();
  },
};

// --- Chart -------------------------------------------------------------------
new Chart(canvas, {
  type: "doughnut",
  data: {
    labels: categoryLabels,
    datasets: [
      {
        label: "Expense Category",
        data: categoryValues,
        backgroundColor: categoryColors,
        borderColor: t.pageBg,
        borderWidth: 3,
        weight: 1.4,
      },
      {
        label: "Department",
        data: departmentTotals,
        backgroundColor: departmentColors,
        borderColor: t.pageBg,
        borderWidth: 3,
        weight: 1,
      },
    ],
  },
  options: {
    responsive: true,
    maintainAspectRatio: false,
    animation: false,
    cutout: "34%",
    layout: {
      padding: { left: 50, right: 50, top: 10, bottom: 10 },
    },
    plugins: {
      title: {
        display: true,
        text: "donut-nested · javascript · chartjs · anyplot.ai",
        color: t.ink,
        font: { size: 22, weight: "500" },
        padding: { bottom: 24 },
      },
      legend: {
        position: "right",
        labels: {
          color: t.inkSoft,
          font: { size: 15 },
          boxWidth: 16,
          boxHeight: 16,
          padding: 10,
          generateLabels() {
            return categoryLabels.map((text, i) => ({
              text,
              fillStyle: categoryColors[i],
              strokeStyle: categoryColors[i],
              fontColor: t.inkSoft,
              lineWidth: 0,
              index: i,
              datasetIndex: 0,
            }));
          },
        },
      },
      tooltip: {
        callbacks: {
          title: () => "",
          label(ctx) {
            const label =
              ctx.datasetIndex === 0
                ? categoryLabels[ctx.dataIndex]
                : departmentLabels[ctx.dataIndex];
            return `${label}: $${ctx.parsed}M`;
          },
        },
      },
    },
  },
  plugins: [ringLabelsPlugin],
});
Runnable source as JSON, for any HTTP client: https://api.anyplot.ai/specs/donut-nested/chartjs/code. Any spec id and library id listed in llms-full.txt fit the same URL shape; every URL below is complete and callable.
{
  "spec_id": "donut-nested",
  "language": "javascript",
  "library": "chartjs",
  "page": "https://anyplot.ai/donut-nested/javascript/chartjs",
  "hub": "https://anyplot.ai/donut-nested",
  "code_json": "https://api.anyplot.ai/specs/donut-nested/chartjs/code",
  "spec_json": "https://api.anyplot.ai/specs/donut-nested",
  "render_light_png": "https://storage.googleapis.com/anyplot-images/plots/donut-nested/javascript/chartjs/plot-light.png",
  "render_dark_png": "https://storage.googleapis.com/anyplot-images/plots/donut-nested/javascript/chartjs/plot-dark.png",
  "interactive_light_html": "https://storage.googleapis.com/anyplot-images/plots/donut-nested/javascript/chartjs/plot-light.html",
  "interactive_dark_html": "https://storage.googleapis.com/anyplot-images/plots/donut-nested/javascript/chartjs/plot-dark.html",
  "quality_score": 93.0,
  "license": "MIT",
  "guide": "https://anyplot.ai/llms.txt"
}
Part of Nested Donut Chart on anyplot.ai.