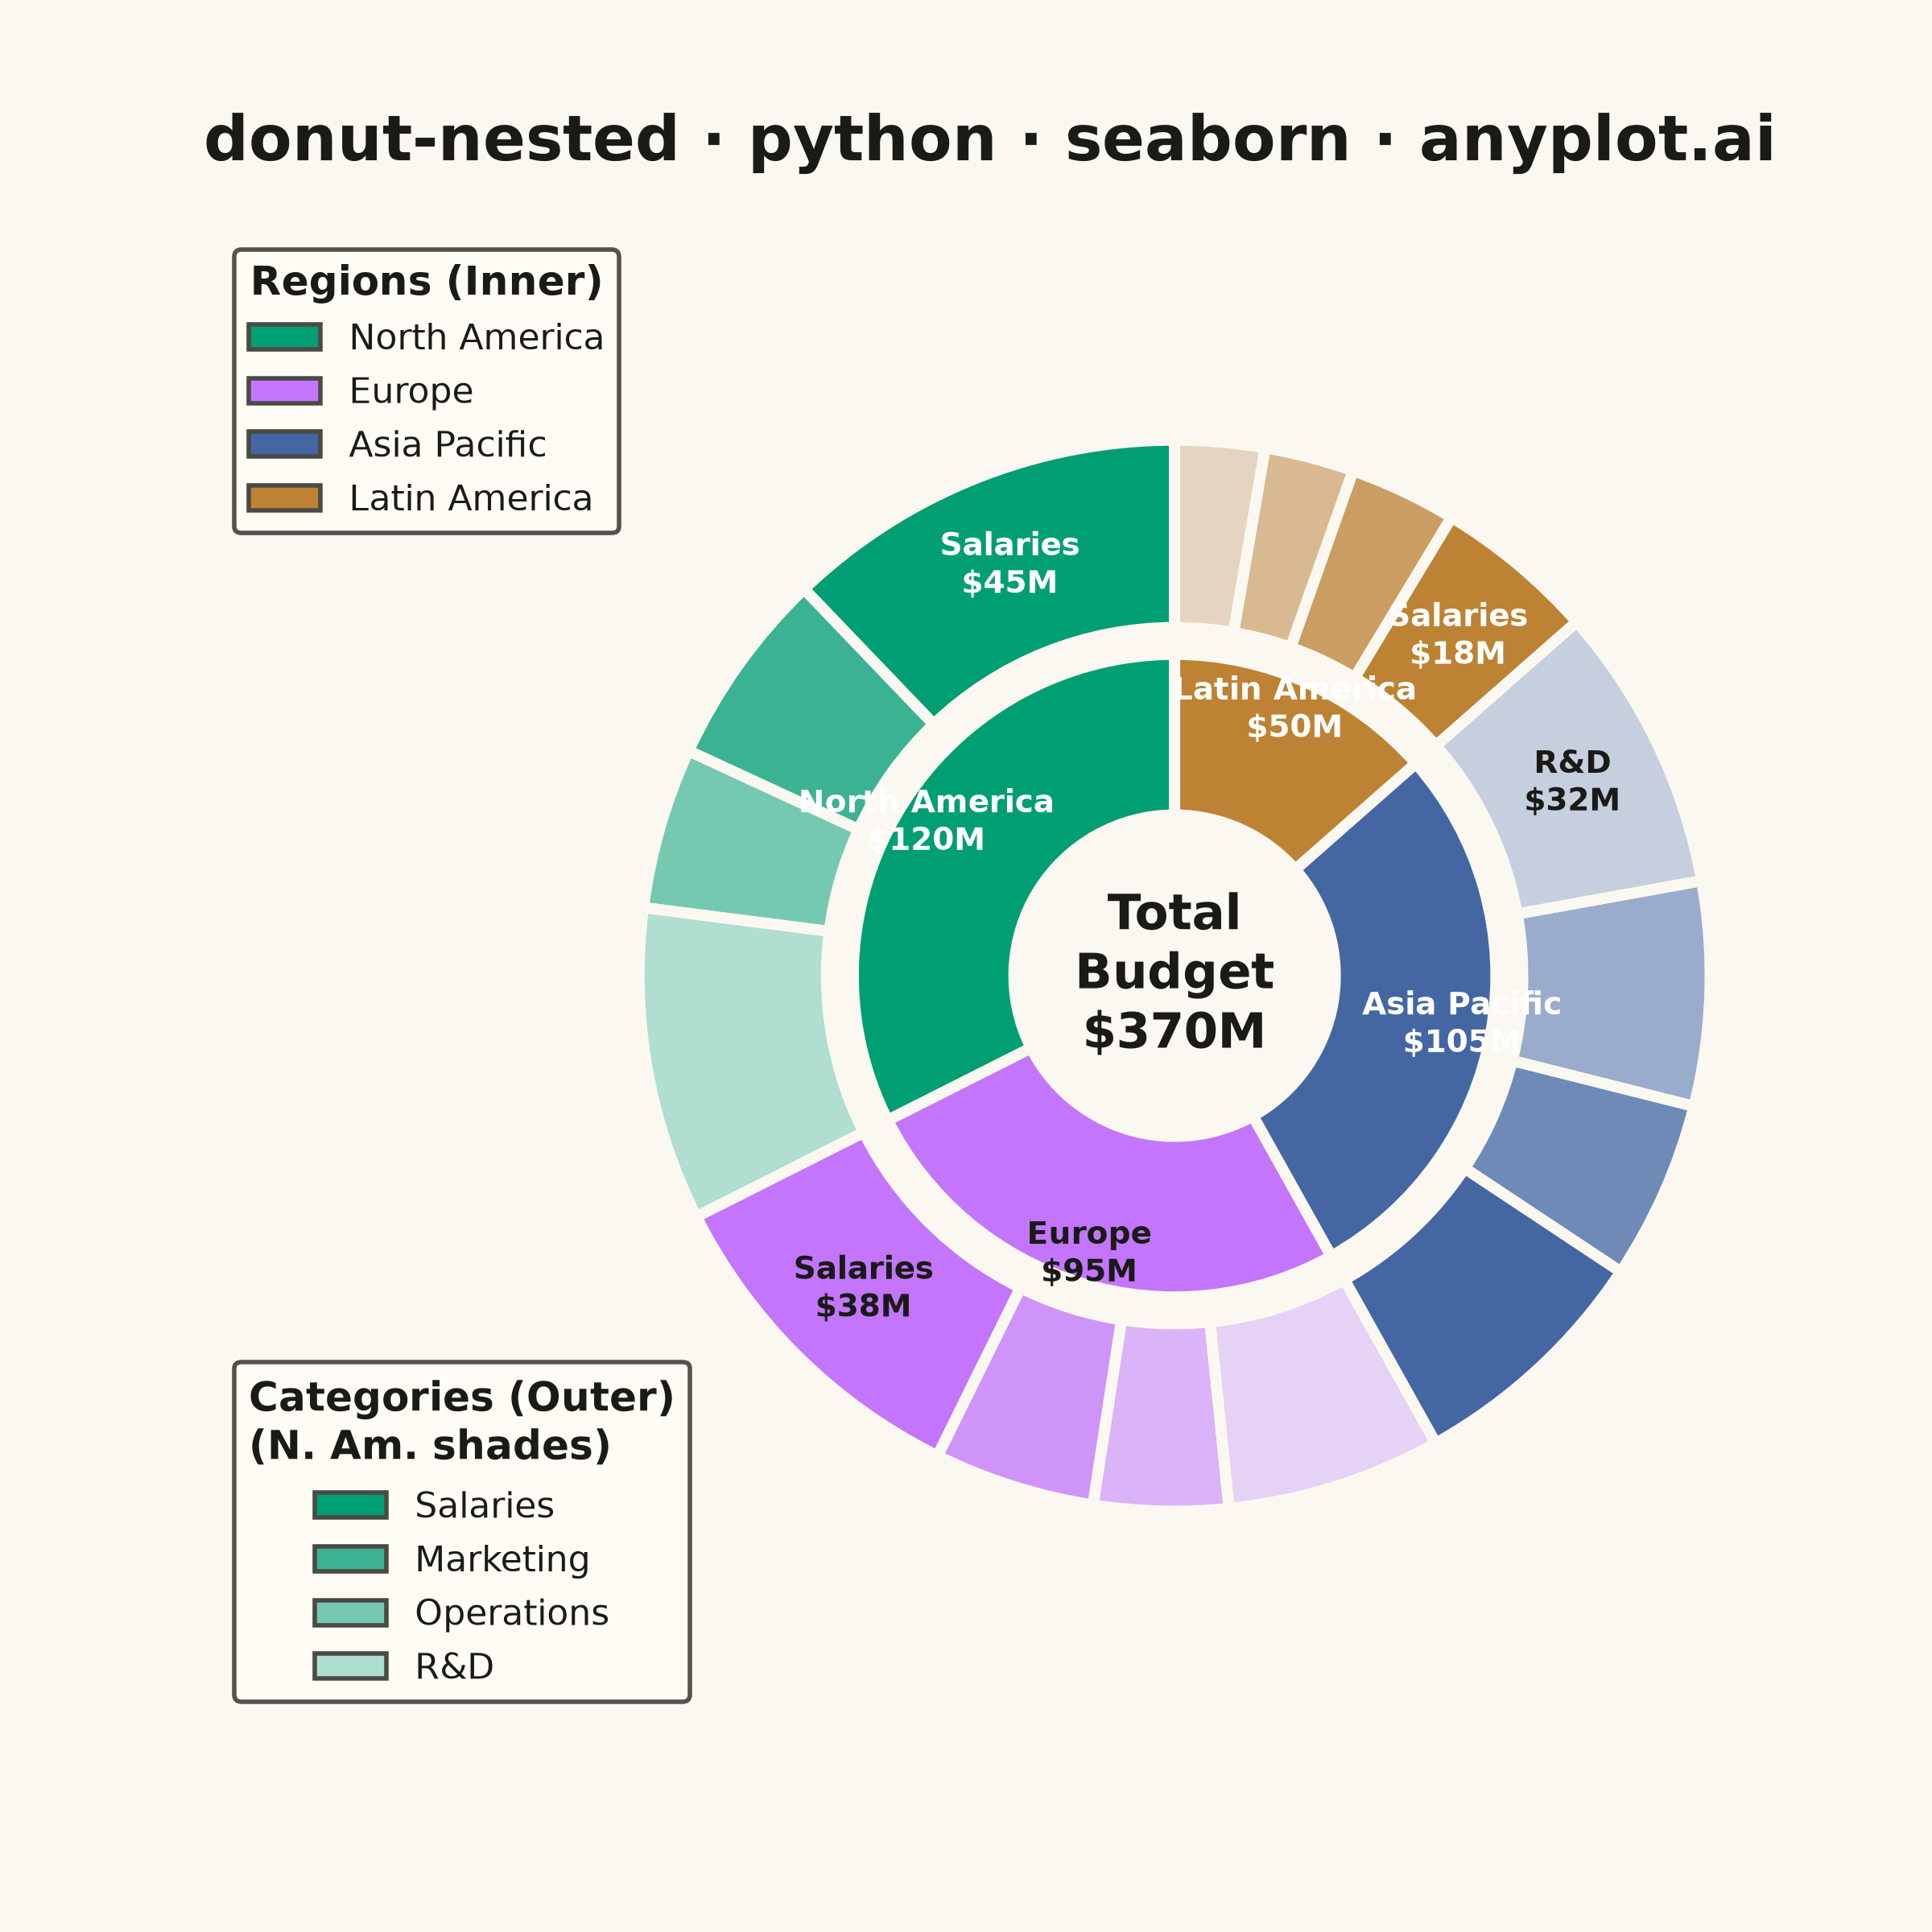
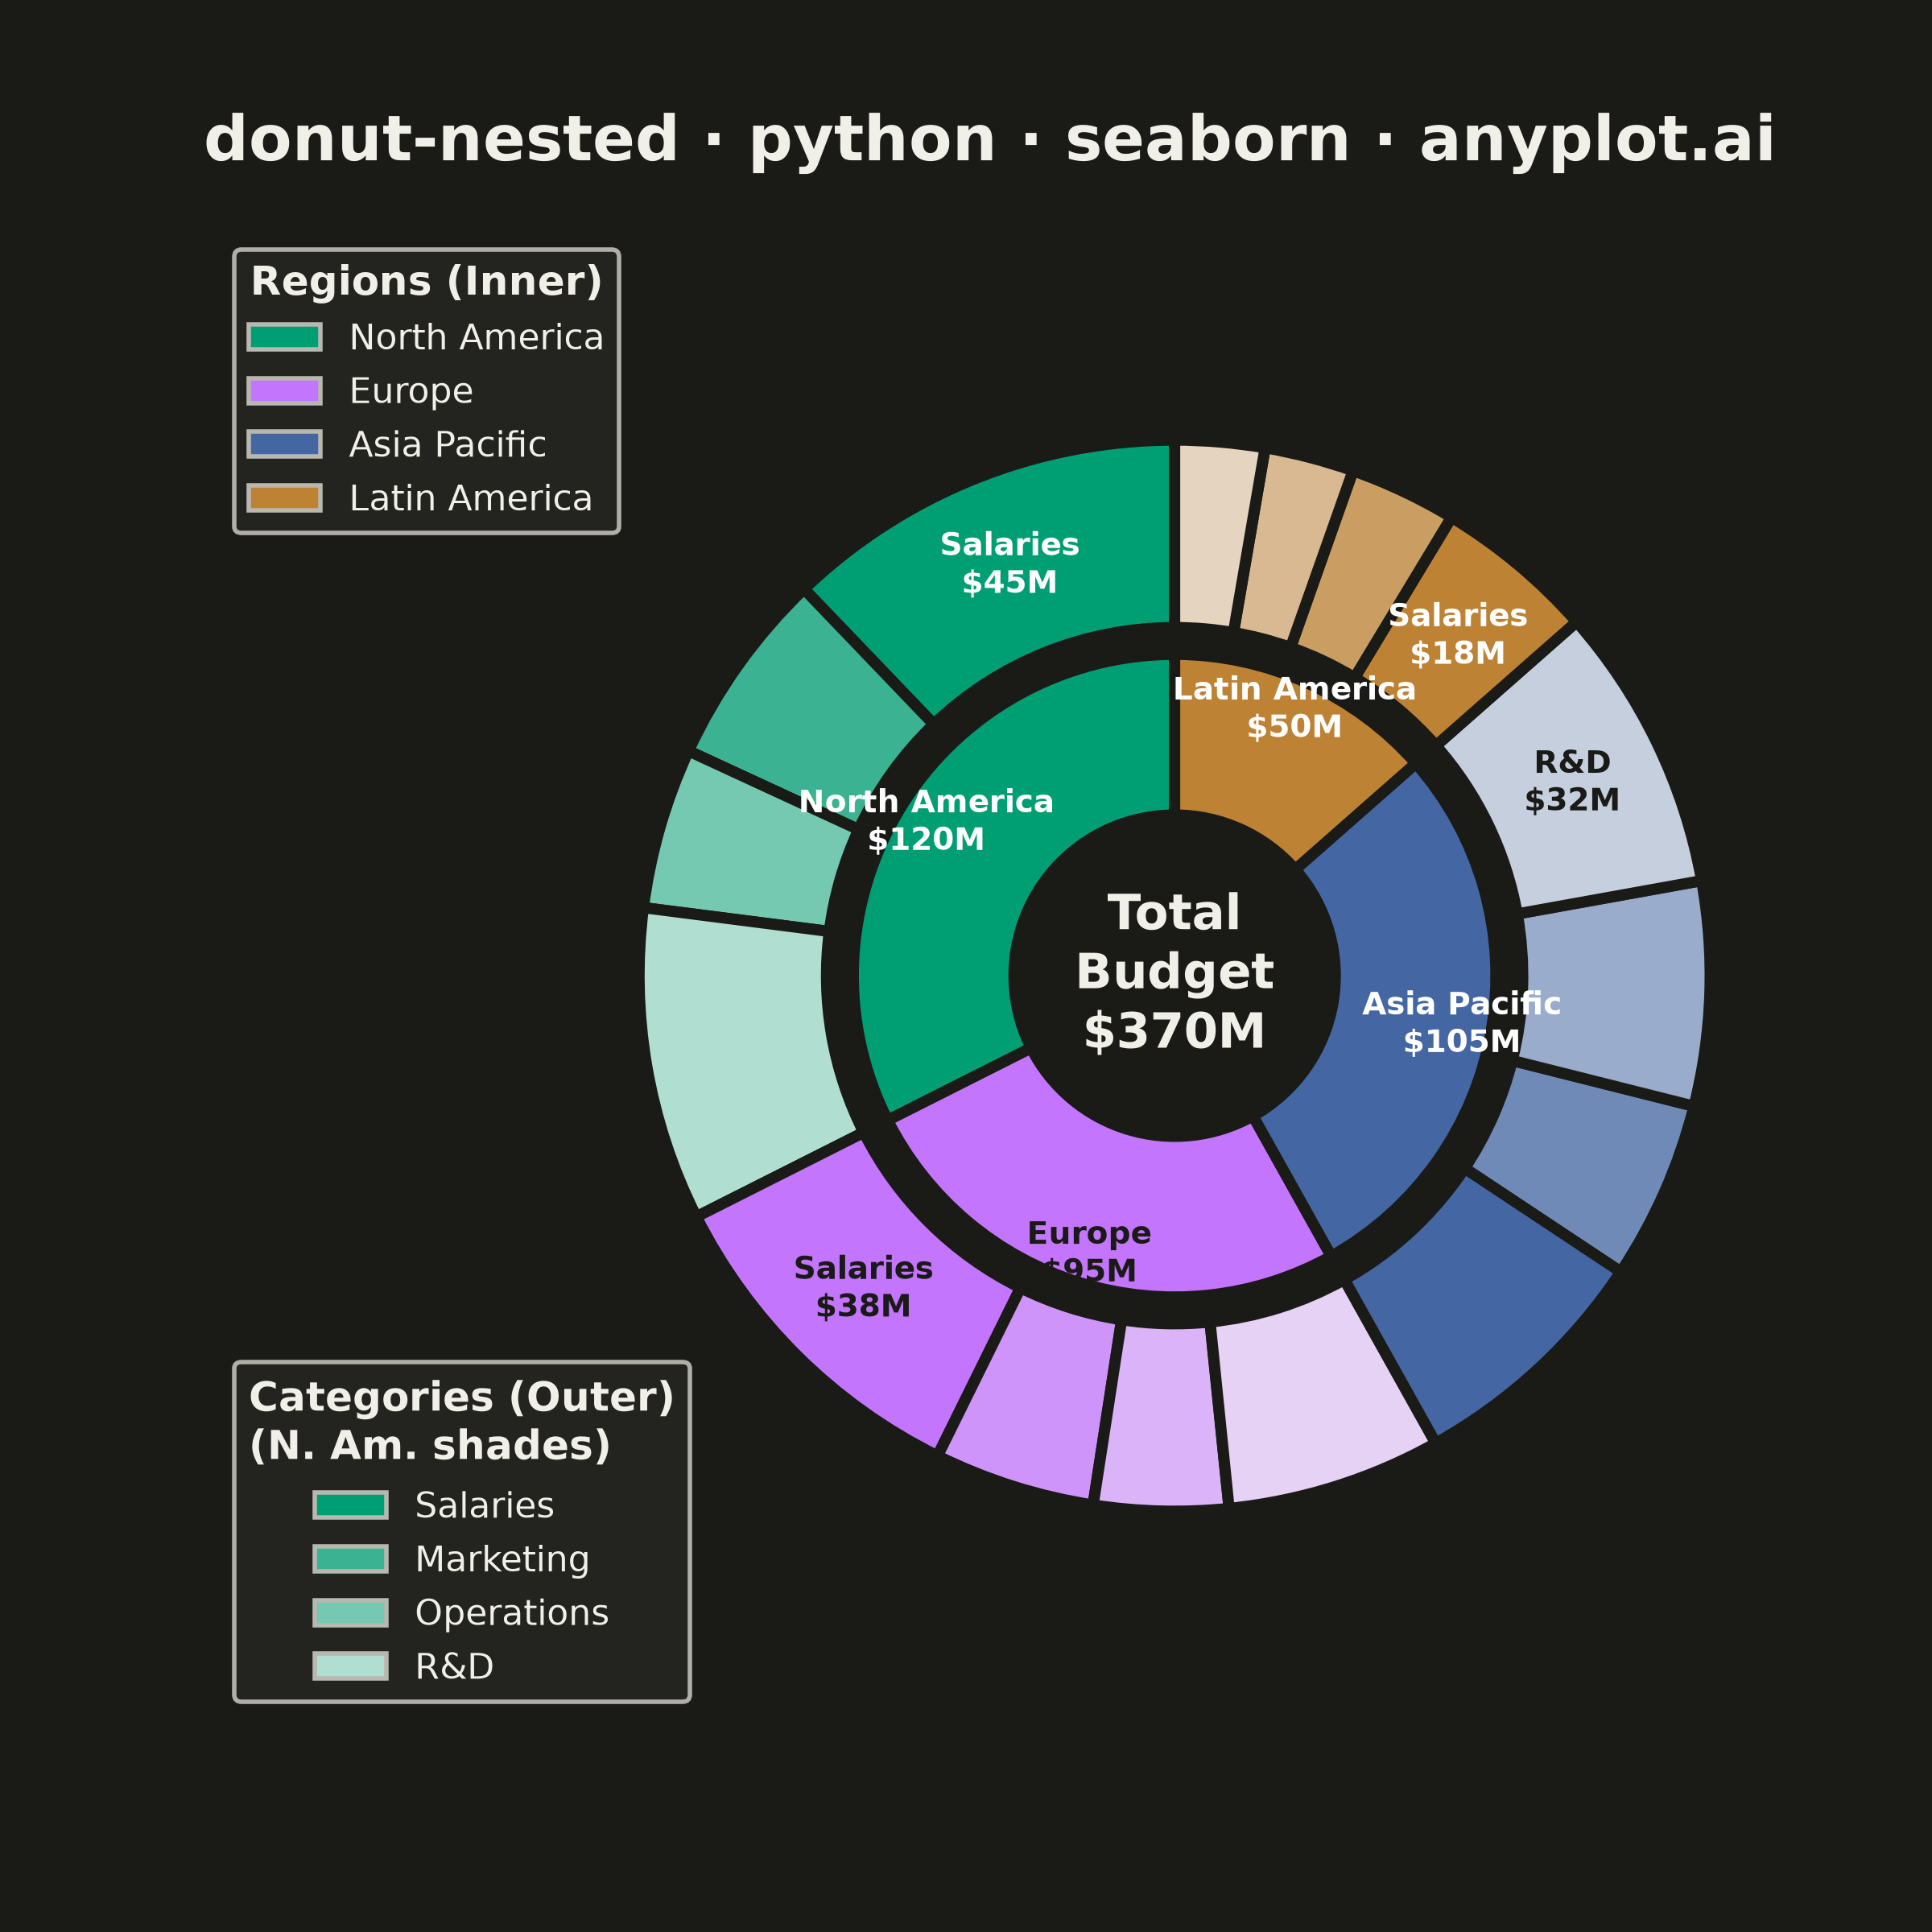
A nested donut chart displays hierarchical data as multiple concentric rings, where each ring represents a level of the hierarchy. Inner rings show parent categories while outer rings show their subdivisions. This visualization effectively reveals part-to-whole relationships across multiple levels while maintaining the familiar donut format.
""" anyplot.ai
donut-nested: Nested Donut Chart
Library: seaborn 0.13.2 | Python 3.13.15
Quality: 84/100 | Updated: 2026-08-18
"""

import os
import sys


sys.path.pop(0)

import matplotlib.pyplot as plt
import numpy as np
import seaborn as sns
from matplotlib.colors import to_rgb
from matplotlib.patches import Patch


# Theme tokens
THEME = os.getenv("ANYPLOT_THEME", "light")
PAGE_BG = "#FAF8F1" if THEME == "light" else "#1A1A17"
ELEVATED_BG = "#FFFDF6" if THEME == "light" else "#242420"
INK = "#1A1A17" if THEME == "light" else "#F0EFE8"
INK_SOFT = "#4A4A44" if THEME == "light" else "#B8B7B0"

# Imprint palette - positions 1-4 for parent categories
IMPRINT = ["#009E73", "#C475FD", "#4467A3", "#BD8233"]
DARK_TEXT = (
    "#1A1A17"  # fixed ink for label text on light wedges - data colors don't flip with theme, so neither should this
)


def _luminance(color):
    """Relative (WCAG) luminance of a matplotlib color spec."""
    r, g, b = to_rgb(color)

    def channel(c):
        return c / 12.92 if c <= 0.03928 else ((c + 0.055) / 1.055) ** 2.4

    r, g, b = channel(r), channel(g), channel(b)
    return 0.2126 * r + 0.7152 * g + 0.0722 * b


def _label_color(wedge_color):
    """White reads well on most Imprint hues, but lighter wedges (e.g. lavender) need dark text for AA contrast."""
    return DARK_TEXT if _luminance(wedge_color) > 0.3 else "white"


# Data: Regional budget allocation with expense categories
regions = ["North America", "Europe", "Asia Pacific", "Latin America"]
categories = ["Salaries", "Marketing", "Operations", "R&D"]

data = {
    "North America": [45, 22, 18, 35],
    "Europe": [38, 18, 15, 24],
    "Asia Pacific": [28, 20, 25, 32],
    "Latin America": [18, 12, 10, 10],
}

# Calculate totals for inner ring
inner_values = [sum(data[r]) for r in regions]
outer_values = []
for r in regions:
    outer_values.extend(data[r])

total_budget = sum(inner_values)

# Set seaborn style with theme-adaptive colors (Imprint chrome mapping)
sns.set_theme(
    style="ticks",
    rc={
        "figure.facecolor": PAGE_BG,
        "axes.facecolor": PAGE_BG,
        "axes.edgecolor": INK_SOFT,
        "axes.labelcolor": INK,
        "text.color": INK,
        "xtick.color": INK_SOFT,
        "ytick.color": INK_SOFT,
        "grid.color": INK,
        "grid.alpha": 0.15,
        "legend.facecolor": ELEVATED_BG,
        "legend.edgecolor": INK_SOFT,
    },
)

# Create figure (square for symmetric donut) — canonical 2400x2400 px
fig, ax = plt.subplots(figsize=(6, 6), dpi=400, facecolor=PAGE_BG)
ax.set_facecolor(PAGE_BG)

# Create outer colors - lighter shades of each parent category color
outer_colors = []
for i, _region in enumerate(regions):
    parent_color = IMPRINT[i]
    shades = sns.light_palette(parent_color, n_colors=5, reverse=True)[:-1]
    outer_colors.extend(shades)

# Donut geometry - shrunk 10% from a full radius=1.0 ring to leave clearance
# between the outer wedges and the "Categories (Outer)" legend box
OUTER_RADIUS = 0.9
OUTER_WIDTH = 0.315
INNER_RADIUS = 0.54
INNER_WIDTH = 0.27
INNER_LABEL_R = 0.49  # biased toward the outer edge of the inner ring for center-text clearance
OUTER_LABEL_R = OUTER_RADIUS - OUTER_WIDTH / 2  # midpoint of the outer ring

# The legend column occupies the axes' left margin, so the donut is shifted right
# of the data origin to balance the canvas whitespace evenly left-to-right.
CX, CY = 0.31, 0.0

# Outer ring (categories within regions)
outer_wedges, _ = ax.pie(
    outer_values,
    radius=OUTER_RADIUS,
    colors=outer_colors,
    wedgeprops={"width": OUTER_WIDTH, "edgecolor": PAGE_BG, "linewidth": 2.5},
    startangle=90,
    center=(CX, CY),
)

# Inner ring (regions)
inner_wedges, inner_texts = ax.pie(
    inner_values,
    radius=INNER_RADIUS,
    colors=IMPRINT,
    wedgeprops={"width": INNER_WIDTH, "edgecolor": PAGE_BG, "linewidth": 2.5},
    startangle=90,
    labels=None,
    center=(CX, CY),
)

# Pin the viewport to the un-shifted symmetric range so the CX offset above
# actually moves the donut within the axes instead of being auto-recentered.
ax.set_xlim(-1.25, 1.25)
ax.set_ylim(-1.25, 1.25)

# Add center text
ax.text(CX, CY, f"Total\nBudget\n${total_budget}M", ha="center", va="center", fontsize=11, fontweight="bold", color=INK)

# Add labels for inner ring (regions with values)
cumsum = 0
for region, val, color in zip(regions, inner_values, IMPRINT, strict=True):
    # matplotlib pie() sweeps counterclockwise from startangle by default — match that direction
    angle = 90 + (cumsum + val / 2) / total_budget * 360
    angle_rad = np.radians(angle)
    x = CX + INNER_LABEL_R * np.cos(angle_rad)
    y = CY + INNER_LABEL_R * np.sin(angle_rad)
    ax.text(
        x, y, f"{region}\n${val}M", ha="center", va="center", fontsize=7, fontweight="bold", color=_label_color(color)
    )
    cumsum += val

# Add a direct label to the single largest outer (category) wedge per region,
# so viewers aren't limited to the legend/position-parity to read the biggest segments
cumsum = 0
for r_idx, region in enumerate(regions):
    region_values = data[region]
    max_idx = region_values.index(max(region_values))
    for c_idx, val in enumerate(region_values):
        mid_angle = 90 + (cumsum + val / 2) / total_budget * 360
        if c_idx == max_idx:
            angle_rad = np.radians(mid_angle)
            x = CX + OUTER_LABEL_R * np.cos(angle_rad)
            y = CY + OUTER_LABEL_R * np.sin(angle_rad)
            wedge_color = outer_colors[r_idx * len(categories) + c_idx]
            ax.text(
                x,
                y,
                f"{categories[c_idx]}\n${val}M",
                ha="center",
                va="center",
                fontsize=7,
                fontweight="bold",
                color=_label_color(wedge_color),
            )
        cumsum += val

# Create legend for regions (inner ring)
region_patches = [
    Patch(facecolor=IMPRINT[i], label=f"{regions[i]}", edgecolor=INK_SOFT, linewidth=1) for i in range(len(regions))
]

# Create legend for categories, shown in the North America shade family
# (each region's outer wedges use its own tint of the same 4 categories, in this order)
category_patches = [
    Patch(
        facecolor=sns.light_palette(IMPRINT[0], n_colors=5, reverse=True)[:-1][i],
        label=categories[i],
        edgecolor=INK_SOFT,
        linewidth=1,
    )
    for i in range(len(categories))
]

# Add legends
legend1 = ax.legend(
    handles=region_patches,
    title="Regions (Inner)",
    loc="upper left",
    bbox_to_anchor=(-0.02, 1.0),
    fontsize=8,
    title_fontsize=9,
    framealpha=0.95,
    edgecolor=INK_SOFT,
    facecolor=ELEVATED_BG,
    labelcolor=INK,
)
for text in legend1.get_texts():
    text.set_color(INK)
legend1.get_title().set_fontsize(9)
legend1.get_title().set_weight("bold")
legend1.get_title().set_color(INK)
ax.add_artist(legend1)

legend2 = ax.legend(
    handles=category_patches,
    title="Categories (Outer)\n(N. Am. shades)",
    loc="lower left",
    bbox_to_anchor=(-0.02, 0.0),
    fontsize=8,
    title_fontsize=9,
    framealpha=0.95,
    edgecolor=INK_SOFT,
    facecolor=ELEVATED_BG,
    labelcolor=INK,
)
for text in legend2.get_texts():
    text.set_color(INK)
legend2.get_title().set_fontsize(9)
legend2.get_title().set_weight("bold")
legend2.get_title().set_color(INK)

# Title
ax.set_title("donut-nested · python · seaborn · anyplot.ai", fontsize=14, fontweight="bold", pad=16, color=INK)

ax.set_aspect("equal")
plt.savefig(f"plot-{THEME}.png", dpi=400, facecolor=PAGE_BG)
Runnable source as JSON, for any HTTP client: https://api.anyplot.ai/specs/donut-nested/seaborn/code. Any spec id and library id listed in llms-full.txt fit the same URL shape; every URL below is complete and callable.
{
  "spec_id": "donut-nested",
  "language": "python",
  "library": "seaborn",
  "page": "https://anyplot.ai/donut-nested/python/seaborn",
  "hub": "https://anyplot.ai/donut-nested",
  "code_json": "https://api.anyplot.ai/specs/donut-nested/seaborn/code",
  "spec_json": "https://api.anyplot.ai/specs/donut-nested",
  "render_light_png": "https://storage.googleapis.com/anyplot-images/plots/donut-nested/python/seaborn/plot-light.png",
  "render_dark_png": "https://storage.googleapis.com/anyplot-images/plots/donut-nested/python/seaborn/plot-dark.png",
  "quality_score": 84.0,
  "license": "MIT",
  "guide": "https://anyplot.ai/llms.txt"
}
Part of Nested Donut Chart on anyplot.ai.