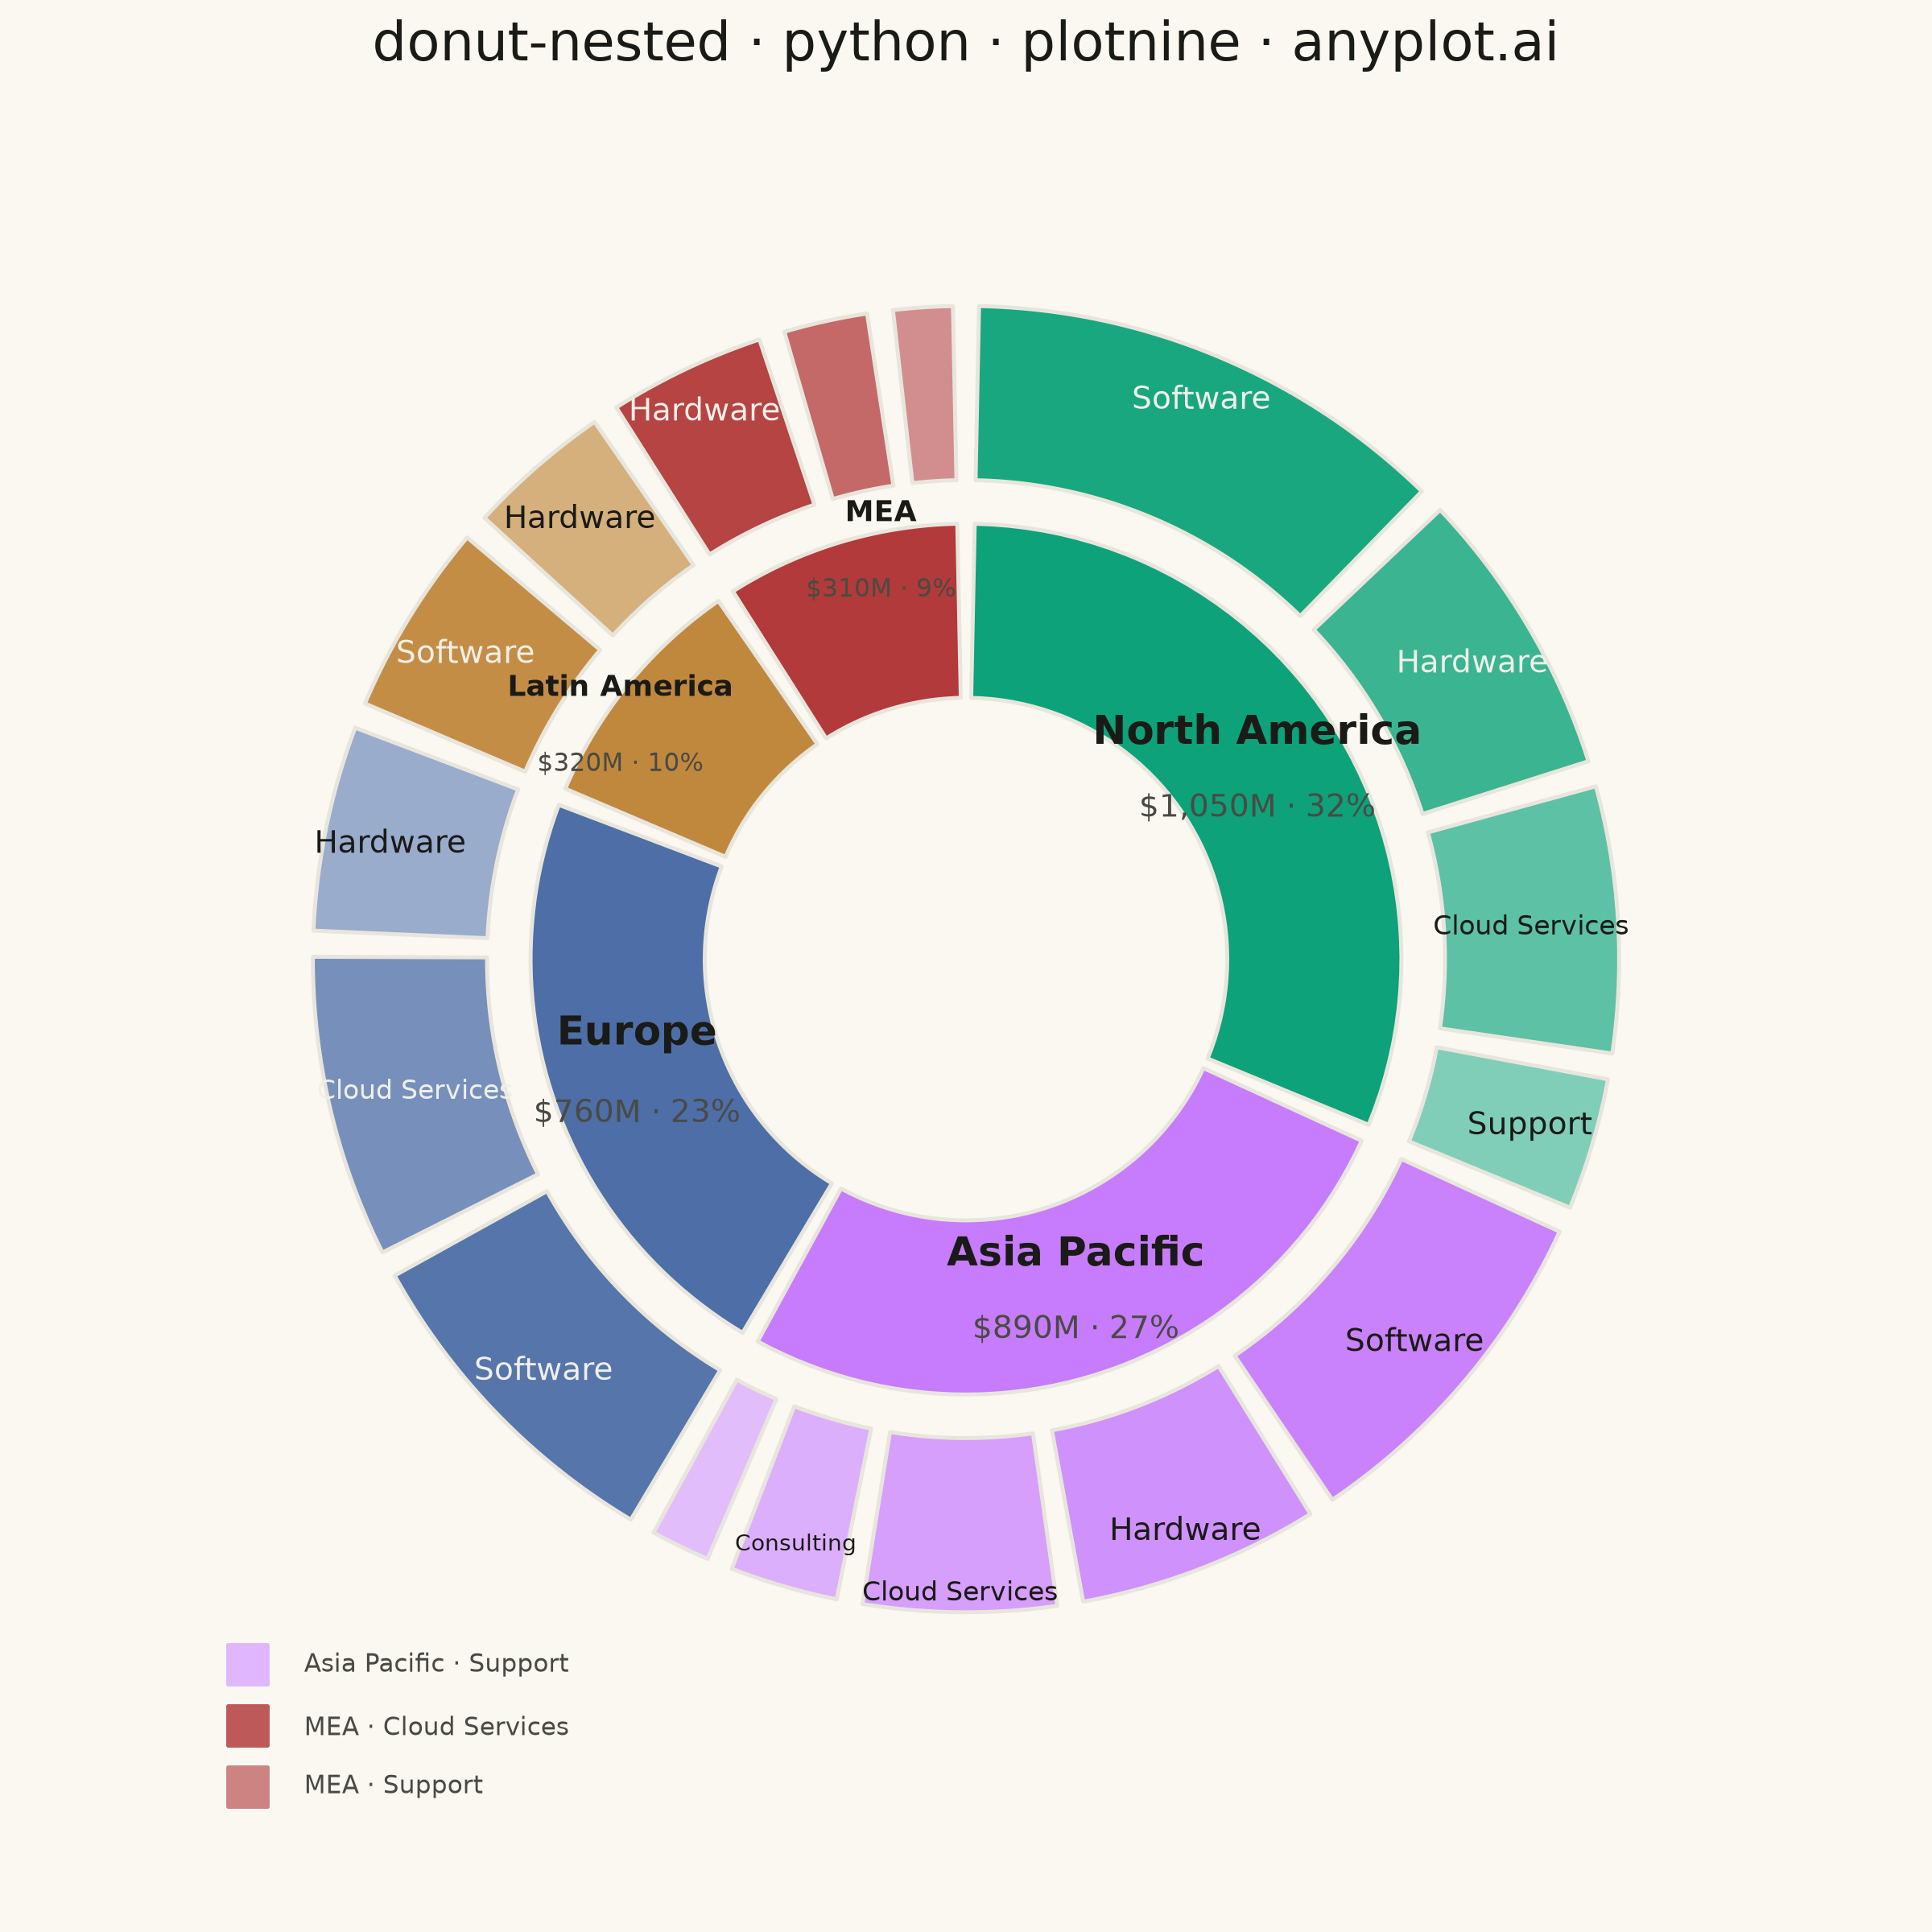
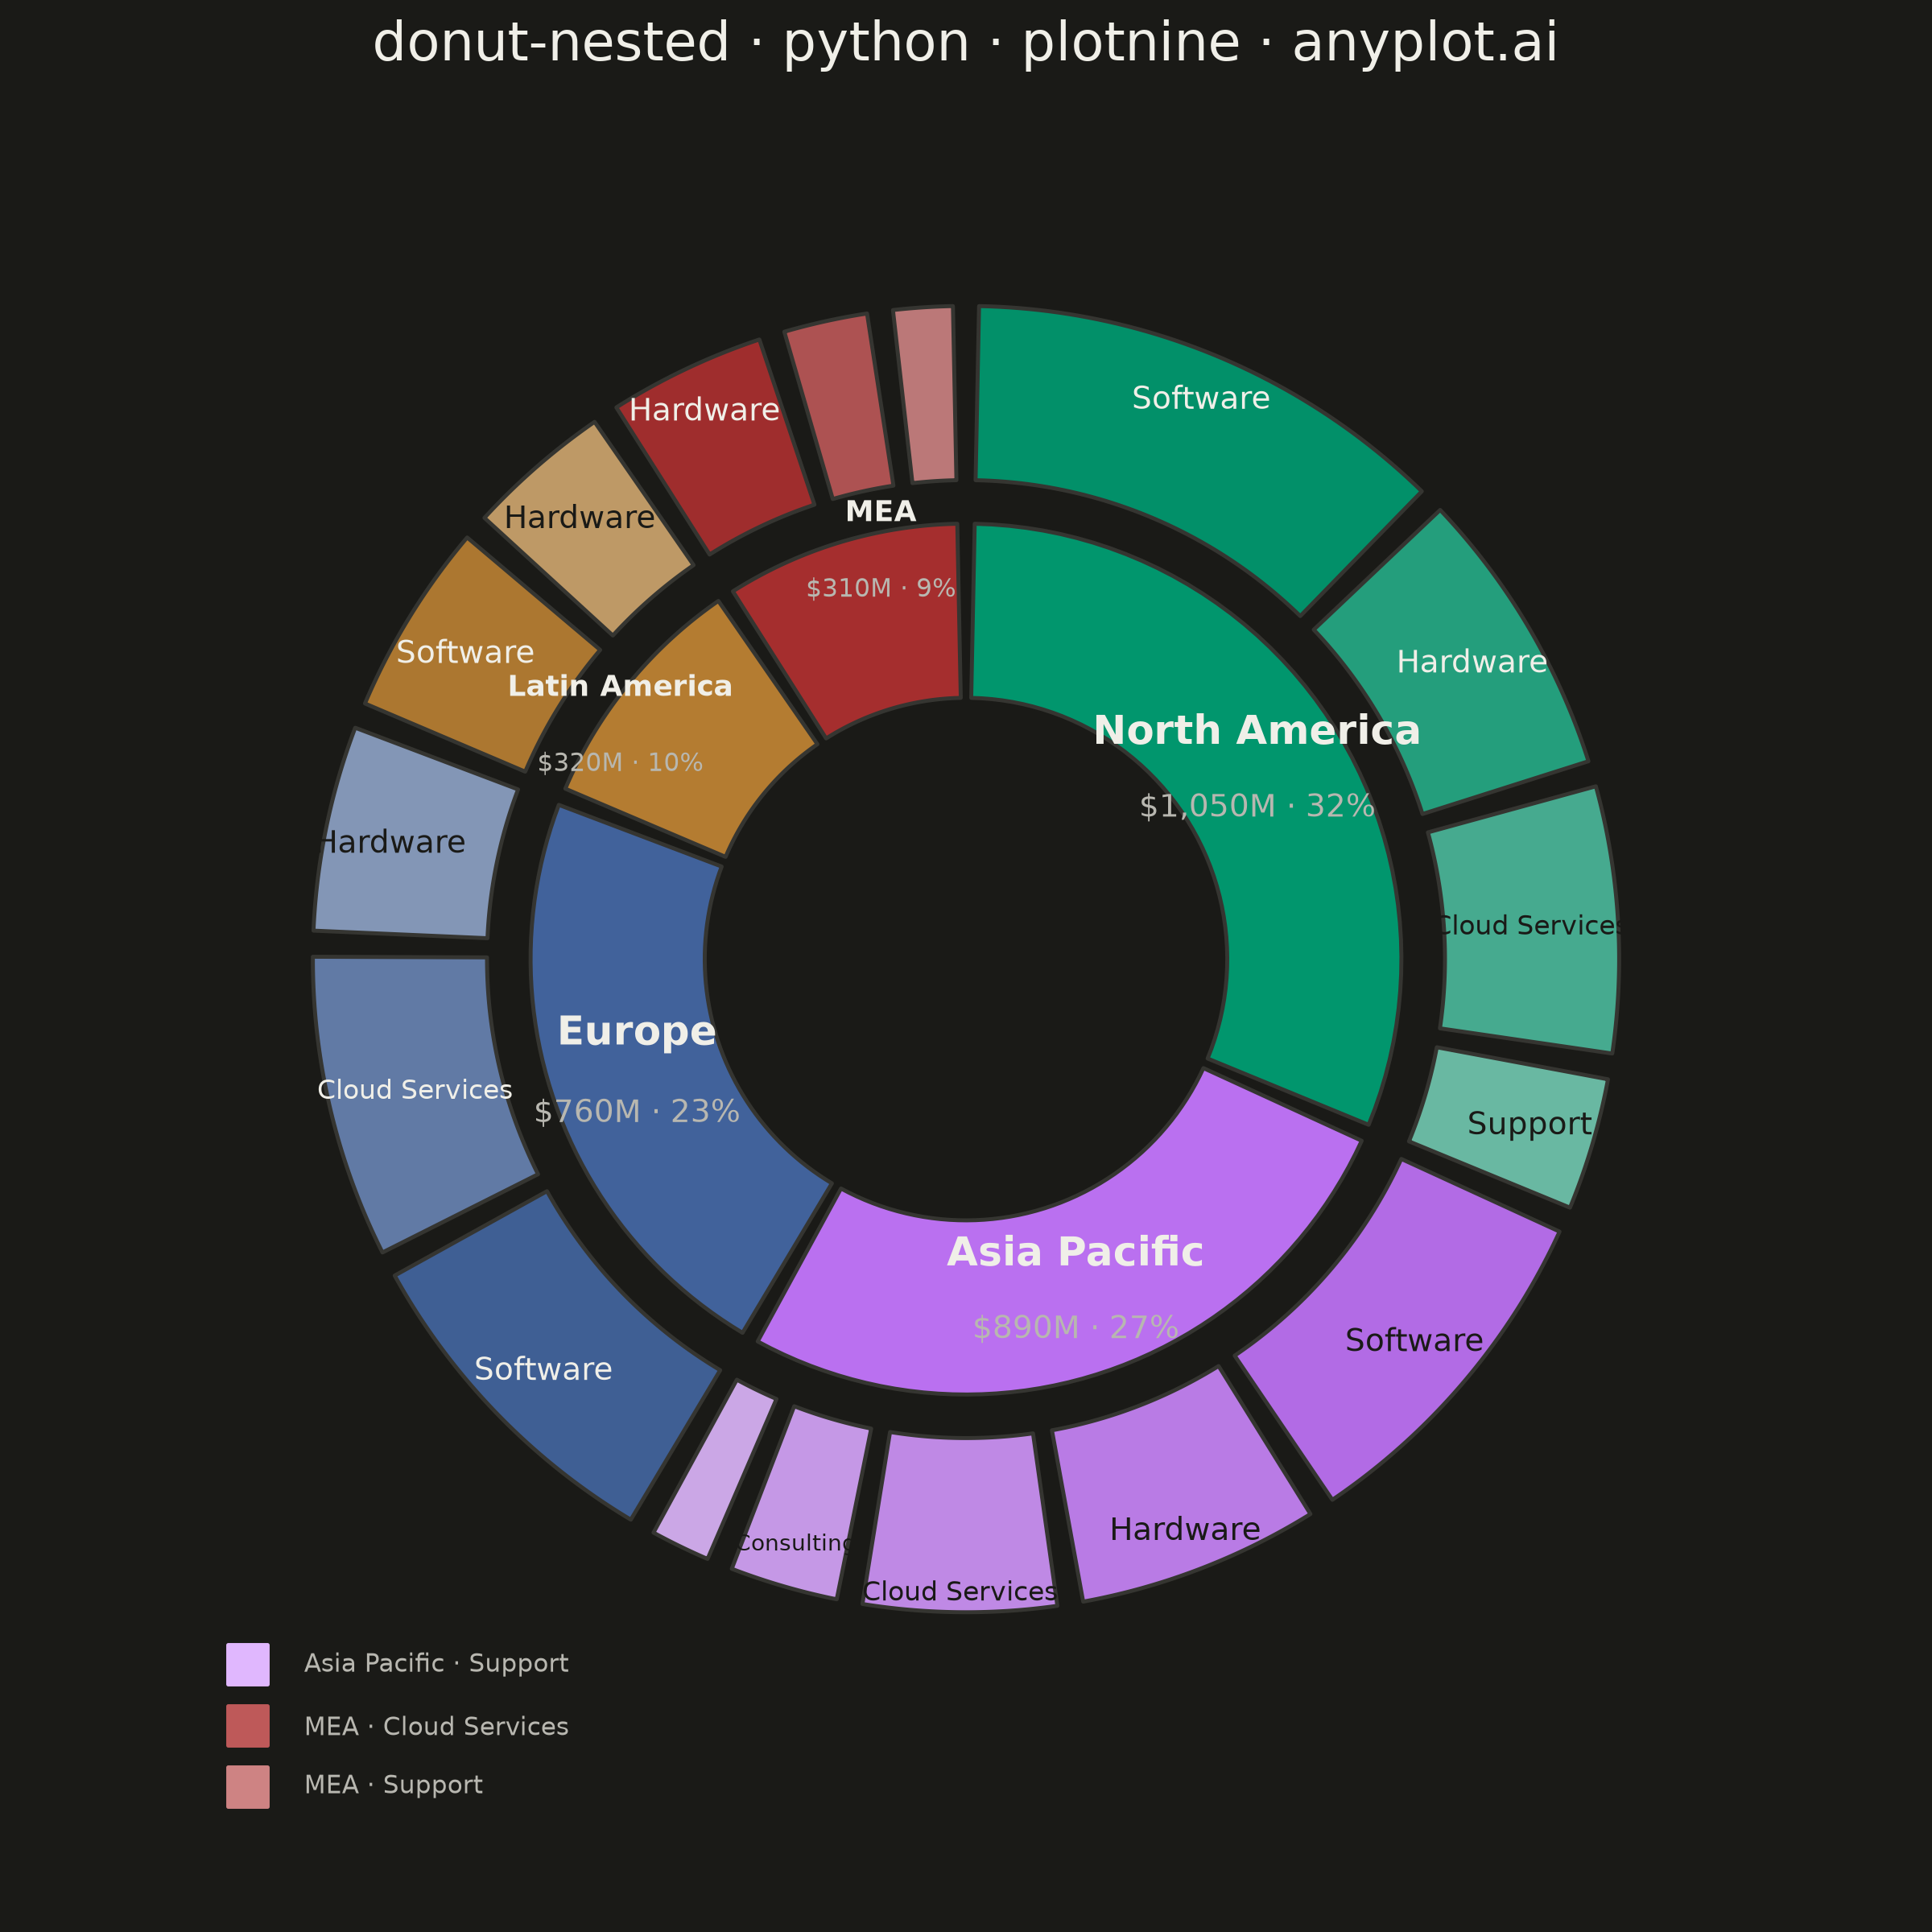
A nested donut chart displays hierarchical data as multiple concentric rings, where each ring represents a level of the hierarchy. Inner rings show parent categories while outer rings show their subdivisions. This visualization effectively reveals part-to-whole relationships across multiple levels while maintaining the familiar donut format.
""" anyplot.ai
donut-nested: Nested Donut Chart
Library: plotnine 0.15.8 | Python 3.13.15
Quality: 88/100 | Updated: 2026-08-18
"""

import os
import sys


# Remove the script's directory from sys.path to avoid circular imports
script_dir = os.path.dirname(os.path.abspath(__file__))
sys.path = [p for p in sys.path if os.path.abspath(p) != script_dir]

import math

import pandas as pd
from matplotlib.font_manager import FontProperties
from matplotlib.path import Path as MplPath
from matplotlib.textpath import TextPath
from plotnine import (
    aes,
    coord_fixed,
    element_blank,
    element_rect,
    element_text,
    geom_point,
    geom_polygon,
    geom_text,
    ggplot,
    labs,
    scale_color_identity,
    scale_fill_identity,
    scale_size_identity,
    scale_x_continuous,
    scale_y_continuous,
    theme,
)


THEME = os.getenv("ANYPLOT_THEME", "light")
PAGE_BG = "#FAF8F1" if THEME == "light" else "#1A1A17"
INK = "#1A1A17" if THEME == "light" else "#F0EFE8"
INK_SOFT = "#4A4A44" if THEME == "light" else "#B8B7B0"
BORDER_COLOR = "#E8E6DC" if THEME == "light" else "#353531"

# Imprint categorical palette (positions 1-5) — regions are an abstract
# category, so canonical ordinal order applies (default-style-guide.md
# "Semantic Exception": abstract categories keep canonical order).
IMPRINT_PALETTE = ["#009E73", "#C475FD", "#4467A3", "#BD8233", "#AE3030"]

# Data - Global technology revenue ($M) by region (inner ring) and product
# line (outer ring). Region count (5) and children-per-region (2-5) diverge
# from the 4-department budget scenario used by sibling library implementations.
data = {
    "North America": [("Software", 420), ("Hardware", 260), ("Cloud Services", 240), ("Support", 130)],
    "Asia Pacific": [
        ("Software", 310),
        ("Hardware", 220),
        ("Cloud Services", 180),
        ("Consulting", 110),
        ("Support", 70),
    ],
    "Europe": [("Software", 300), ("Cloud Services", 270), ("Hardware", 190)],
    "Latin America": [("Software", 180), ("Hardware", 140)],
    "Middle East & Africa": [("Hardware", 150), ("Cloud Services", 90), ("Support", 70)],
}

# Shortened form used wherever a small-share region's full name would crowd
# its neighbor (inner-ring label, legend entry) — only "Middle East & Africa"
# is long enough to need it.
short_names = {"Middle East & Africa": "MEA"}


def lighten_hex(hex_color, amount):
    """Blend a hex color toward white by `amount` (0-1) for a tonal family member."""
    r, g, b = (int(hex_color[i : i + 2], 16) for i in (1, 3, 5))
    r = round(r + (255 - r) * amount)
    g = round(g + (255 - g) * amount)
    b = round(b + (255 - b) * amount)
    return f"#{r:02X}{g:02X}{b:02X}"


def contrast_text_color(hex_color):
    """Pick dark or light ink for legibility against a specific wedge fill —
    based on that fill's own brightness, independent of the page theme, since
    the palest tonal tints need dark text in both themes."""
    r, g, b = (int(hex_color[i : i + 2], 16) for i in (1, 3, 5))
    brightness = (0.299 * r + 0.587 * g + 0.114 * b) / 255
    return "#1A1A17" if brightness > 0.55 else "#F0EFE8"


# Imprint families - each parent's Imprint hue plus lighter tonal shades for
# its own children in the outer ring (consistent hue, varying lightness).
color_families = {}
for parent, base_color in zip(data.keys(), IMPRINT_PALETTE, strict=True):
    children = data[parent]
    n_children = len(children)
    tints = [lighten_hex(base_color, (i / n_children) * 0.6) for i in range(n_children)]
    color_families[parent] = (base_color, tints)

# Calculate totals for each parent
parent_totals = {parent: sum(v for _, v in children) for parent, children in data.items()}
grand_total = sum(parent_totals.values())

# Ring dimensions
inner_ring_inner = 60  # Inner donut hole
inner_ring_outer = 100  # Inner ring outer radius
outer_ring_inner = 110  # Outer ring inner radius (gap for separation)
outer_ring_outer = 150  # Outer ring outer radius

label_threshold = 100  # $M — outer segments below this get a legend entry instead

# Coordinate-to-inch conversion for measuring real rendered text width: the
# panel spans FIGURE_WIDTH_IN inches across X_RANGE_UNITS data units (see
# scale_x_continuous below), so a font-metric extent in points converts to
# data units via points -> inches -> data units.
FIGURE_WIDTH_IN = 6
X_RANGE_UNITS = 380  # matches scale_x_continuous limits=(-190, 190)
UNITS_PER_INCH = X_RANGE_UNITS / FIGURE_WIDTH_IN


def text_extents_units(text, font_size_pt, bold=False):
    """Rendered (width, height) of a label in plot data-coordinate units,
    from actual font metrics rather than a guessed char-count heuristic — so
    label-fit checks match what will really be rasterized."""
    prop = FontProperties(size=font_size_pt, weight="bold" if bold else "normal")
    extents = TextPath((0, 0), text, size=font_size_pt, prop=prop).get_extents()
    return (extents.width / 72) * UNITS_PER_INCH, (extents.height / 72) * UNITS_PER_INCH


def label_fits(center_x, center_y, width, height, segment_path):
    """Whether a horizontal label's bounding box stays inside a wedge polygon.

    A wedge's angular sweep translates to horizontal room very unevenly: near
    the top/bottom of the ring a wide angle gives lots of horizontal space,
    but the same angle near the left/right of the ring gives almost none
    (there the sweep is mostly vertical) — so comparing text width against
    the tangential arc length alone is unreliable. Sampling the label's
    bounding-box edges against the real polygon (inner/outer arcs and the two
    radial edges) via matplotlib's point-in-path test catches that directly.
    """
    half_w, half_h = width / 2, height / 2
    fracs = (-1, -0.5, 0, 0.5, 1)
    corners = [(center_x + fx * half_w, center_y + fy * half_h) for fx in fracs for fy in fracs]
    return bool(segment_path.contains_points(corners).all())


def create_annular_segment(start_angle, end_angle, inner_radius, outer_radius, n_points=50):
    """Create polygon points for an annular (donut) segment."""
    # Add small gap between segments
    gap = 0.02
    start_angle += gap
    end_angle -= gap

    points = []
    # Inner arc (from start to end)
    for angle in [start_angle + (end_angle - start_angle) * i / (n_points - 1) for i in range(n_points)]:
        points.append((inner_radius * math.cos(angle), inner_radius * math.sin(angle)))

    # Outer arc (from end back to start)
    for angle in [end_angle + (start_angle - end_angle) * i / (n_points - 1) for i in range(n_points)]:
        points.append((outer_radius * math.cos(angle), outer_radius * math.sin(angle)))

    # Close the polygon
    points.append(points[0])
    return points


# Build polygon data for inner ring (regions)
inner_rows = []
current_angle = math.pi / 2  # Start at top (12 o'clock)

parent_angles = {}  # Track start/end angles for each parent

for parent in data.keys():
    parent_total = parent_totals[parent]
    sweep = (parent_total / grand_total) * 2 * math.pi
    end_angle = current_angle - sweep  # Clockwise

    parent_angles[parent] = (current_angle, end_angle)

    points = create_annular_segment(end_angle, current_angle, inner_ring_inner, inner_ring_outer)
    for order, (x, y) in enumerate(points):
        inner_rows.append({"x": x, "y": y, "segment": parent, "order": order, "fill": color_families[parent][0]})

    current_angle = end_angle

inner_df = pd.DataFrame(inner_rows)

# Build polygon data for outer ring (product lines). Outer-ring labels and
# legend entries are collected in the same loop since both need the per-child
# color already computed here: segments >= label_threshold get an inline
# label; smaller ones fall back to a legend entry per the spec's "labels on
# larger segments, use legend for smaller ones" guidance.
outer_rows = []
outer_labels = []
legend_entries = []

# Font sizes tried in order (largest first), each checked at several radii
# (outermost first, for maximum separation from the inner ring's labels)
# before falling back to the legend. A label that doesn't fit at any
# size/radius combination would either spill into a neighboring segment's
# label (as seen with Asia Pacific's Consulting/Cloud Services collision) or
# overflow its own wedge onto the page background — where, because
# contrast_text_color picks ink from the wedge fill only, dark text chosen
# for a light tint can land on the dark-theme page and become invisible (the
# North America "Cloud Services" clipping seen in dark only).
outer_label_font_sizes = [7, 6, 5.5, 5]
outer_label_radius_candidates = list(range(outer_ring_outer - 5, outer_ring_inner + 5, -5)) + [outer_ring_inner + 6]

for parent, children in data.items():
    parent_start, parent_end = parent_angles[parent]
    parent_total = parent_totals[parent]

    child_current_angle = parent_start
    child_colors = color_families[parent][1]

    for i, (child_name, child_value) in enumerate(children):
        child_sweep = (child_value / parent_total) * (parent_start - parent_end)
        child_end_angle = child_current_angle - child_sweep
        color = child_colors[i]

        points = create_annular_segment(child_end_angle, child_current_angle, outer_ring_inner, outer_ring_outer)
        segment_id = f"{parent}_{child_name}"

        for order, (x, y) in enumerate(points):
            outer_rows.append({"x": x, "y": y, "segment": segment_id, "order": order, "fill": color})

        if child_value >= label_threshold:
            mid_angle = (child_current_angle + child_end_angle) / 2
            segment_path = MplPath(points)

            placement = None
            for font_size in outer_label_font_sizes:
                text_w, text_h = text_extents_units(child_name, font_size)
                for radius in outer_label_radius_candidates:
                    cx, cy = radius * math.cos(mid_angle), radius * math.sin(mid_angle)
                    if label_fits(cx, cy, text_w, text_h, segment_path):
                        placement = (cx, cy, font_size)
                        break
                if placement is not None:
                    break

            if placement is None:
                legend_entries.append({"parent": parent, "child": child_name, "color": color})
            else:
                label_x, label_y, fitted_size = placement
                outer_labels.append(
                    {
                        "x": label_x,
                        "y": label_y,
                        "label": child_name,
                        "label_color": contrast_text_color(color),
                        "size": fitted_size,
                    }
                )
        else:
            legend_entries.append({"parent": parent, "child": child_name, "color": color})

        child_current_angle = child_end_angle

outer_df = pd.DataFrame(outer_rows)
outer_label_df = pd.DataFrame(outer_labels)

# Create labels for inner ring (region name + revenue share). Name and value
# are nudged apart by a fixed cartesian dy (screen-space stacking) rather than
# a radius difference — a radius-based offset collapses to near-zero vertical
# separation for segments near the 3/9 o'clock angle, since it projects mostly
# horizontally there. `dy` shifts every segment's pair by the same vector, so
# it can't add breathing room *between* two adjacent small segments (Latin
# America / Middle East & Africa) — what actually collided there was the
# long "Middle East & Africa" name text outrunning its narrow angular slice.
# Segments below small_share_threshold get a smaller font, the short name
# form, and their mid-angle nudged away from any small-share neighbor, so the
# two label blocks pull apart instead of converging on the shared boundary.
inner_label_radius = (inner_ring_inner + inner_ring_outer) / 2
label_dy = 9
small_share_threshold = 0.15
small_share_label_radius = inner_ring_outer - 4
small_share_name_size = 6.5
small_share_value_size = 5.5
small_share_angle_nudge = math.radians(5)

parent_list = list(data.keys())
n_parents = len(parent_list)
parent_shares = {p: parent_totals[p] / grand_total for p in parent_list}

inner_name_labels = []
inner_value_labels = []
for idx, parent in enumerate(parent_list):
    start_angle, end_angle = parent_angles[parent]
    mid_angle = (start_angle + end_angle) / 2
    share = parent_shares[parent]
    is_small = share < small_share_threshold
    if is_small:
        next_parent = parent_list[(idx + 1) % n_parents]
        prev_parent = parent_list[(idx - 1) % n_parents]
        if parent_shares[next_parent] < small_share_threshold:
            mid_angle += small_share_angle_nudge  # pull toward own start, away from the next small segment
        if parent_shares[prev_parent] < small_share_threshold:
            mid_angle -= small_share_angle_nudge  # pull toward own end, away from the previous small segment
    this_radius = small_share_label_radius if is_small else inner_label_radius
    label_x = this_radius * math.cos(mid_angle)
    label_y = this_radius * math.sin(mid_angle)
    name_text = short_names.get(parent, parent) if is_small else parent
    inner_name_labels.append({"x": label_x, "y": label_y + label_dy, "label": name_text, "small": is_small})
    inner_value_labels.append(
        {
            "x": label_x,
            "y": label_y - label_dy,
            "label": f"${parent_totals[parent]:,}M · {share * 100:.0f}%",
            "small": is_small,
        }
    )

inner_name_df_all = pd.DataFrame(inner_name_labels)
inner_value_df_all = pd.DataFrame(inner_value_labels)
inner_name_df = inner_name_df_all[~inner_name_df_all["small"]]
inner_name_small_df = inner_name_df_all[inner_name_df_all["small"]]
inner_value_df = inner_value_df_all[~inner_value_df_all["small"]]
inner_value_small_df = inner_value_df_all[inner_value_df_all["small"]]

# Legend for outer-ring segments below label_threshold, or whose label didn't
# fit its arc even at the smallest font (spec: "use legend for smaller ones")
# — a manually drawn swatch + text row per entry, placed in the canvas margin
# below the donut. Row height shrinks (down to a legible floor) instead of a
# fixed 14 so the legend can grow to accommodate more fallback entries while
# always staying within legend_bottom_y, matching the fixed y-axis limit below.
legend_swatch_x = -165
legend_text_x = -152
legend_start_y = -162
legend_bottom_y = -196
legend_row_height = (
    min(14, (legend_start_y - legend_bottom_y) / (len(legend_entries) - 1)) if len(legend_entries) > 1 else 14
)

legend_swatch_rows = [
    {"x": legend_swatch_x, "y": legend_start_y - i * legend_row_height, "color": entry["color"]}
    for i, entry in enumerate(legend_entries)
]
legend_text_rows = [
    {
        "x": legend_text_x,
        "y": legend_start_y - i * legend_row_height,
        "label": f"{short_names.get(entry['parent'], entry['parent'])} · {entry['child']}",
    }
    for i, entry in enumerate(legend_entries)
]
legend_swatch_df = pd.DataFrame(legend_swatch_rows)
legend_text_df = pd.DataFrame(legend_text_rows)

# Title — mandated format only; the region/revenue story is already told by
# the inner-ring labels, so no descriptive prefix is needed here.
title_text = "donut-nested · python · plotnine · anyplot.ai"
title_ratio = 67 / len(title_text) if len(title_text) > 67 else 1.0
title_fontsize = max(round(12 * title_ratio), 8)

# Plot
plot = (
    ggplot()
    # Inner ring (regions)
    + geom_polygon(
        aes(x="x", y="y", group="segment", fill="fill"), data=inner_df, color=BORDER_COLOR, size=0.5, alpha=0.95
    )
    # Outer ring (product lines)
    + geom_polygon(
        aes(x="x", y="y", group="segment", fill="fill"), data=outer_df, color=BORDER_COLOR, size=0.5, alpha=0.9
    )
    # Inner ring labels (region name + revenue share, as two independently
    # positioned rows rather than a multi-line string). Small-share segments
    # (Latin America, Middle East & Africa) use a smaller font so their
    # longer/narrower slices don't collide with each other.
    + geom_text(aes(x="x", y="y", label="label"), data=inner_name_df, size=9, fontweight="bold", color=INK)
    + geom_text(aes(x="x", y="y", label="label"), data=inner_value_df, size=7, color=INK_SOFT)
    + geom_text(
        aes(x="x", y="y", label="label"),
        data=inner_name_small_df,
        size=small_share_name_size,
        fontweight="bold",
        color=INK,
    )
    + geom_text(
        aes(x="x", y="y", label="label"), data=inner_value_small_df, size=small_share_value_size, color=INK_SOFT
    )
    # Outer ring labels (product line names for large-enough segments); text
    # color adapts per-wedge (contrast_text_color) rather than one fixed ink,
    # since the palest tonal tints need dark text even in dark theme. Font
    # size is per-row (shrunk to whatever fit the segment's arc — see
    # outer_label_font_sizes above), mapped through scale_size_identity().
    + geom_text(aes(x="x", y="y", label="label", color="label_color", size="size"), data=outer_label_df)
    # Legend for the outer-ring segments below label_threshold — swatch +
    # name, since scale_fill_identity() precludes an automatic ggplot legend.
    + geom_point(aes(x="x", y="y", color="color"), data=legend_swatch_df, size=4.5, shape="s")
    + geom_text(aes(x="x", y="y", label="label"), data=legend_text_df, size=5.5, color=INK_SOFT, ha="left", va="center")
    # Use fill/color/size values directly (scale_fill_identity for the
    # polygons, scale_color_identity for the legend swatches + adaptive
    # outer-ring label text, scale_size_identity for the per-label fitted
    # outer-ring font sizes)
    + scale_fill_identity()
    + scale_color_identity()
    + scale_size_identity()
    # Fixed aspect ratio for proper circles
    + coord_fixed(ratio=1)
    # Axis limits — asymmetric y range reserves margin below the donut for
    # the legend rows; x range widened to match so coord_fixed doesn't
    # letterbox the panel.
    + scale_x_continuous(limits=(-190, 190))
    + scale_y_continuous(limits=(-200, 180))
    # Title
    + labs(title=title_text)
    # Clean theme with adaptive background — canonical 2400x2400 square canvas
    + theme(
        figure_size=(6, 6),
        plot_background=element_rect(fill=PAGE_BG, color=PAGE_BG),
        panel_background=element_rect(fill=PAGE_BG, color=PAGE_BG),
        plot_title=element_text(size=title_fontsize, ha="center", color=INK),
        axis_title=element_blank(),
        axis_text=element_blank(),
        axis_ticks=element_blank(),
        axis_line=element_blank(),
        panel_grid_major=element_blank(),
        panel_grid_minor=element_blank(),
        legend_position="none",
    )
)

# Save
output_path = os.path.join(os.path.dirname(os.path.abspath(__file__)), f"plot-{THEME}.png")
plot.save(output_path, dpi=400, width=6, height=6, units="in")
Runnable source as JSON, for any HTTP client: https://api.anyplot.ai/specs/donut-nested/plotnine/code. Any spec id and library id listed in llms-full.txt fit the same URL shape; every URL below is complete and callable.
{
  "spec_id": "donut-nested",
  "language": "python",
  "library": "plotnine",
  "page": "https://anyplot.ai/donut-nested/python/plotnine",
  "hub": "https://anyplot.ai/donut-nested",
  "code_json": "https://api.anyplot.ai/specs/donut-nested/plotnine/code",
  "spec_json": "https://api.anyplot.ai/specs/donut-nested",
  "render_light_png": "https://storage.googleapis.com/anyplot-images/plots/donut-nested/python/plotnine/plot-light.png",
  "render_dark_png": "https://storage.googleapis.com/anyplot-images/plots/donut-nested/python/plotnine/plot-dark.png",
  "quality_score": 88.0,
  "license": "MIT",
  "guide": "https://anyplot.ai/llms.txt"
}
Part of Nested Donut Chart on anyplot.ai.