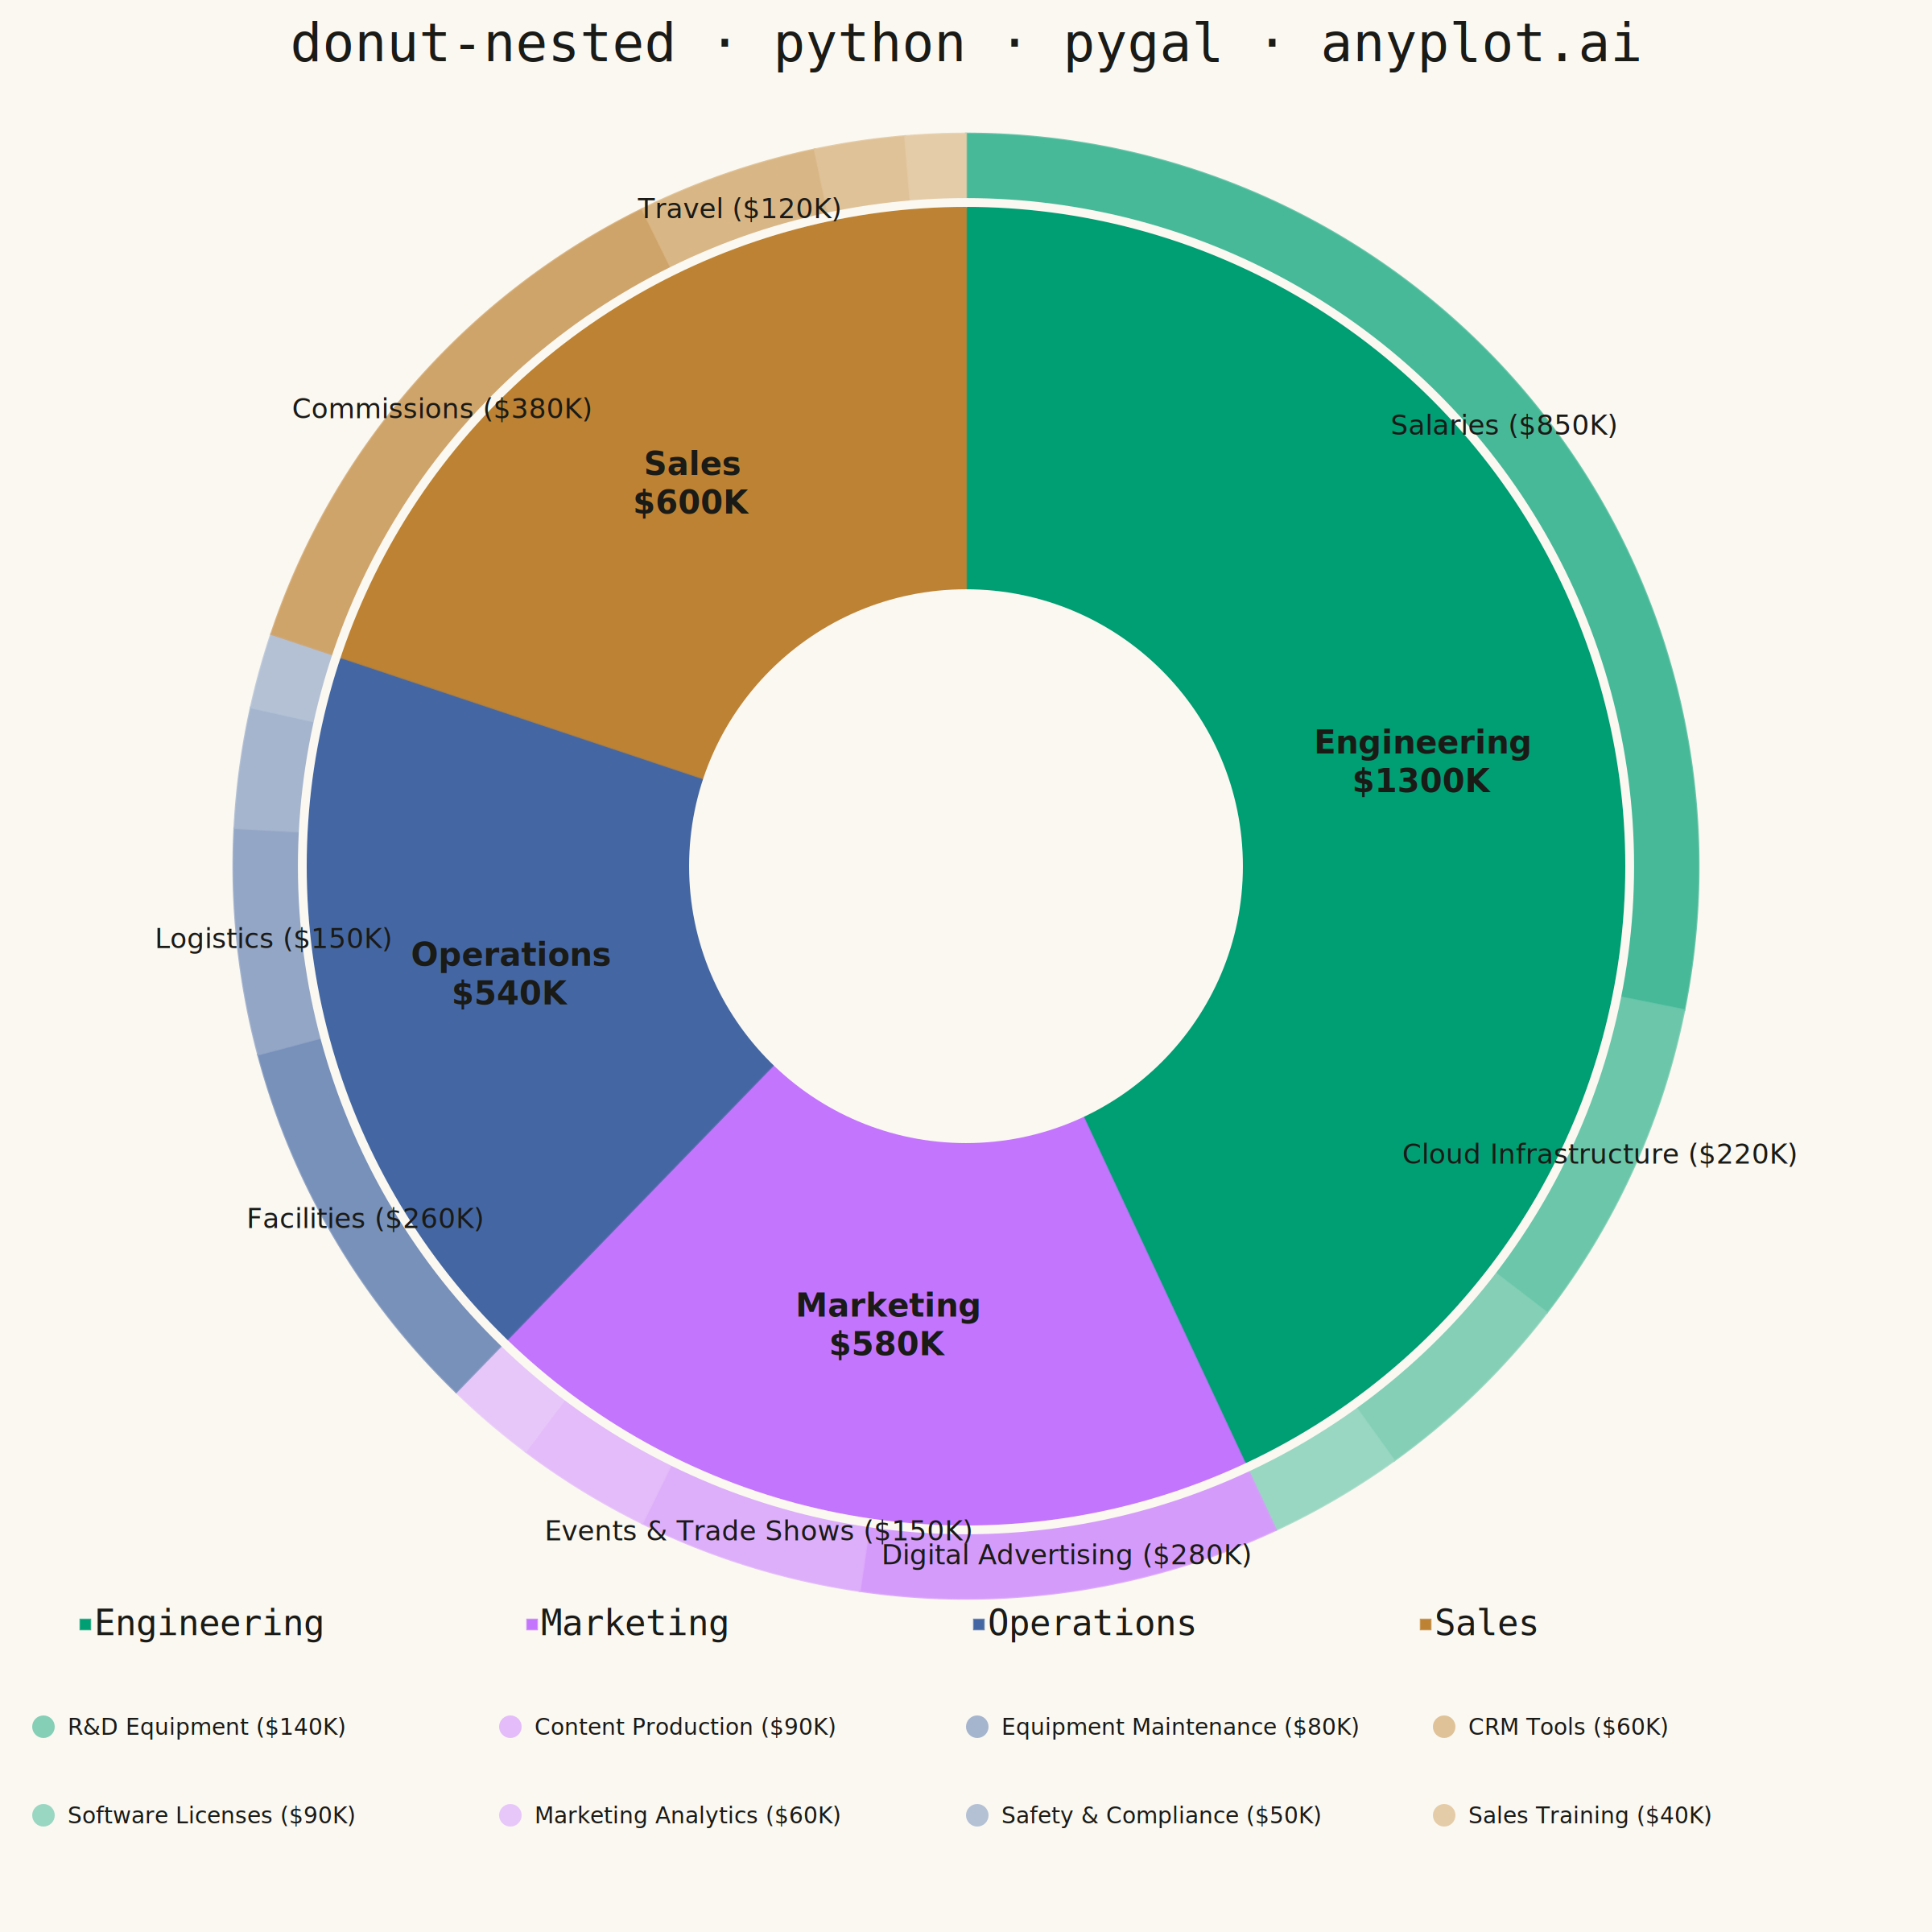
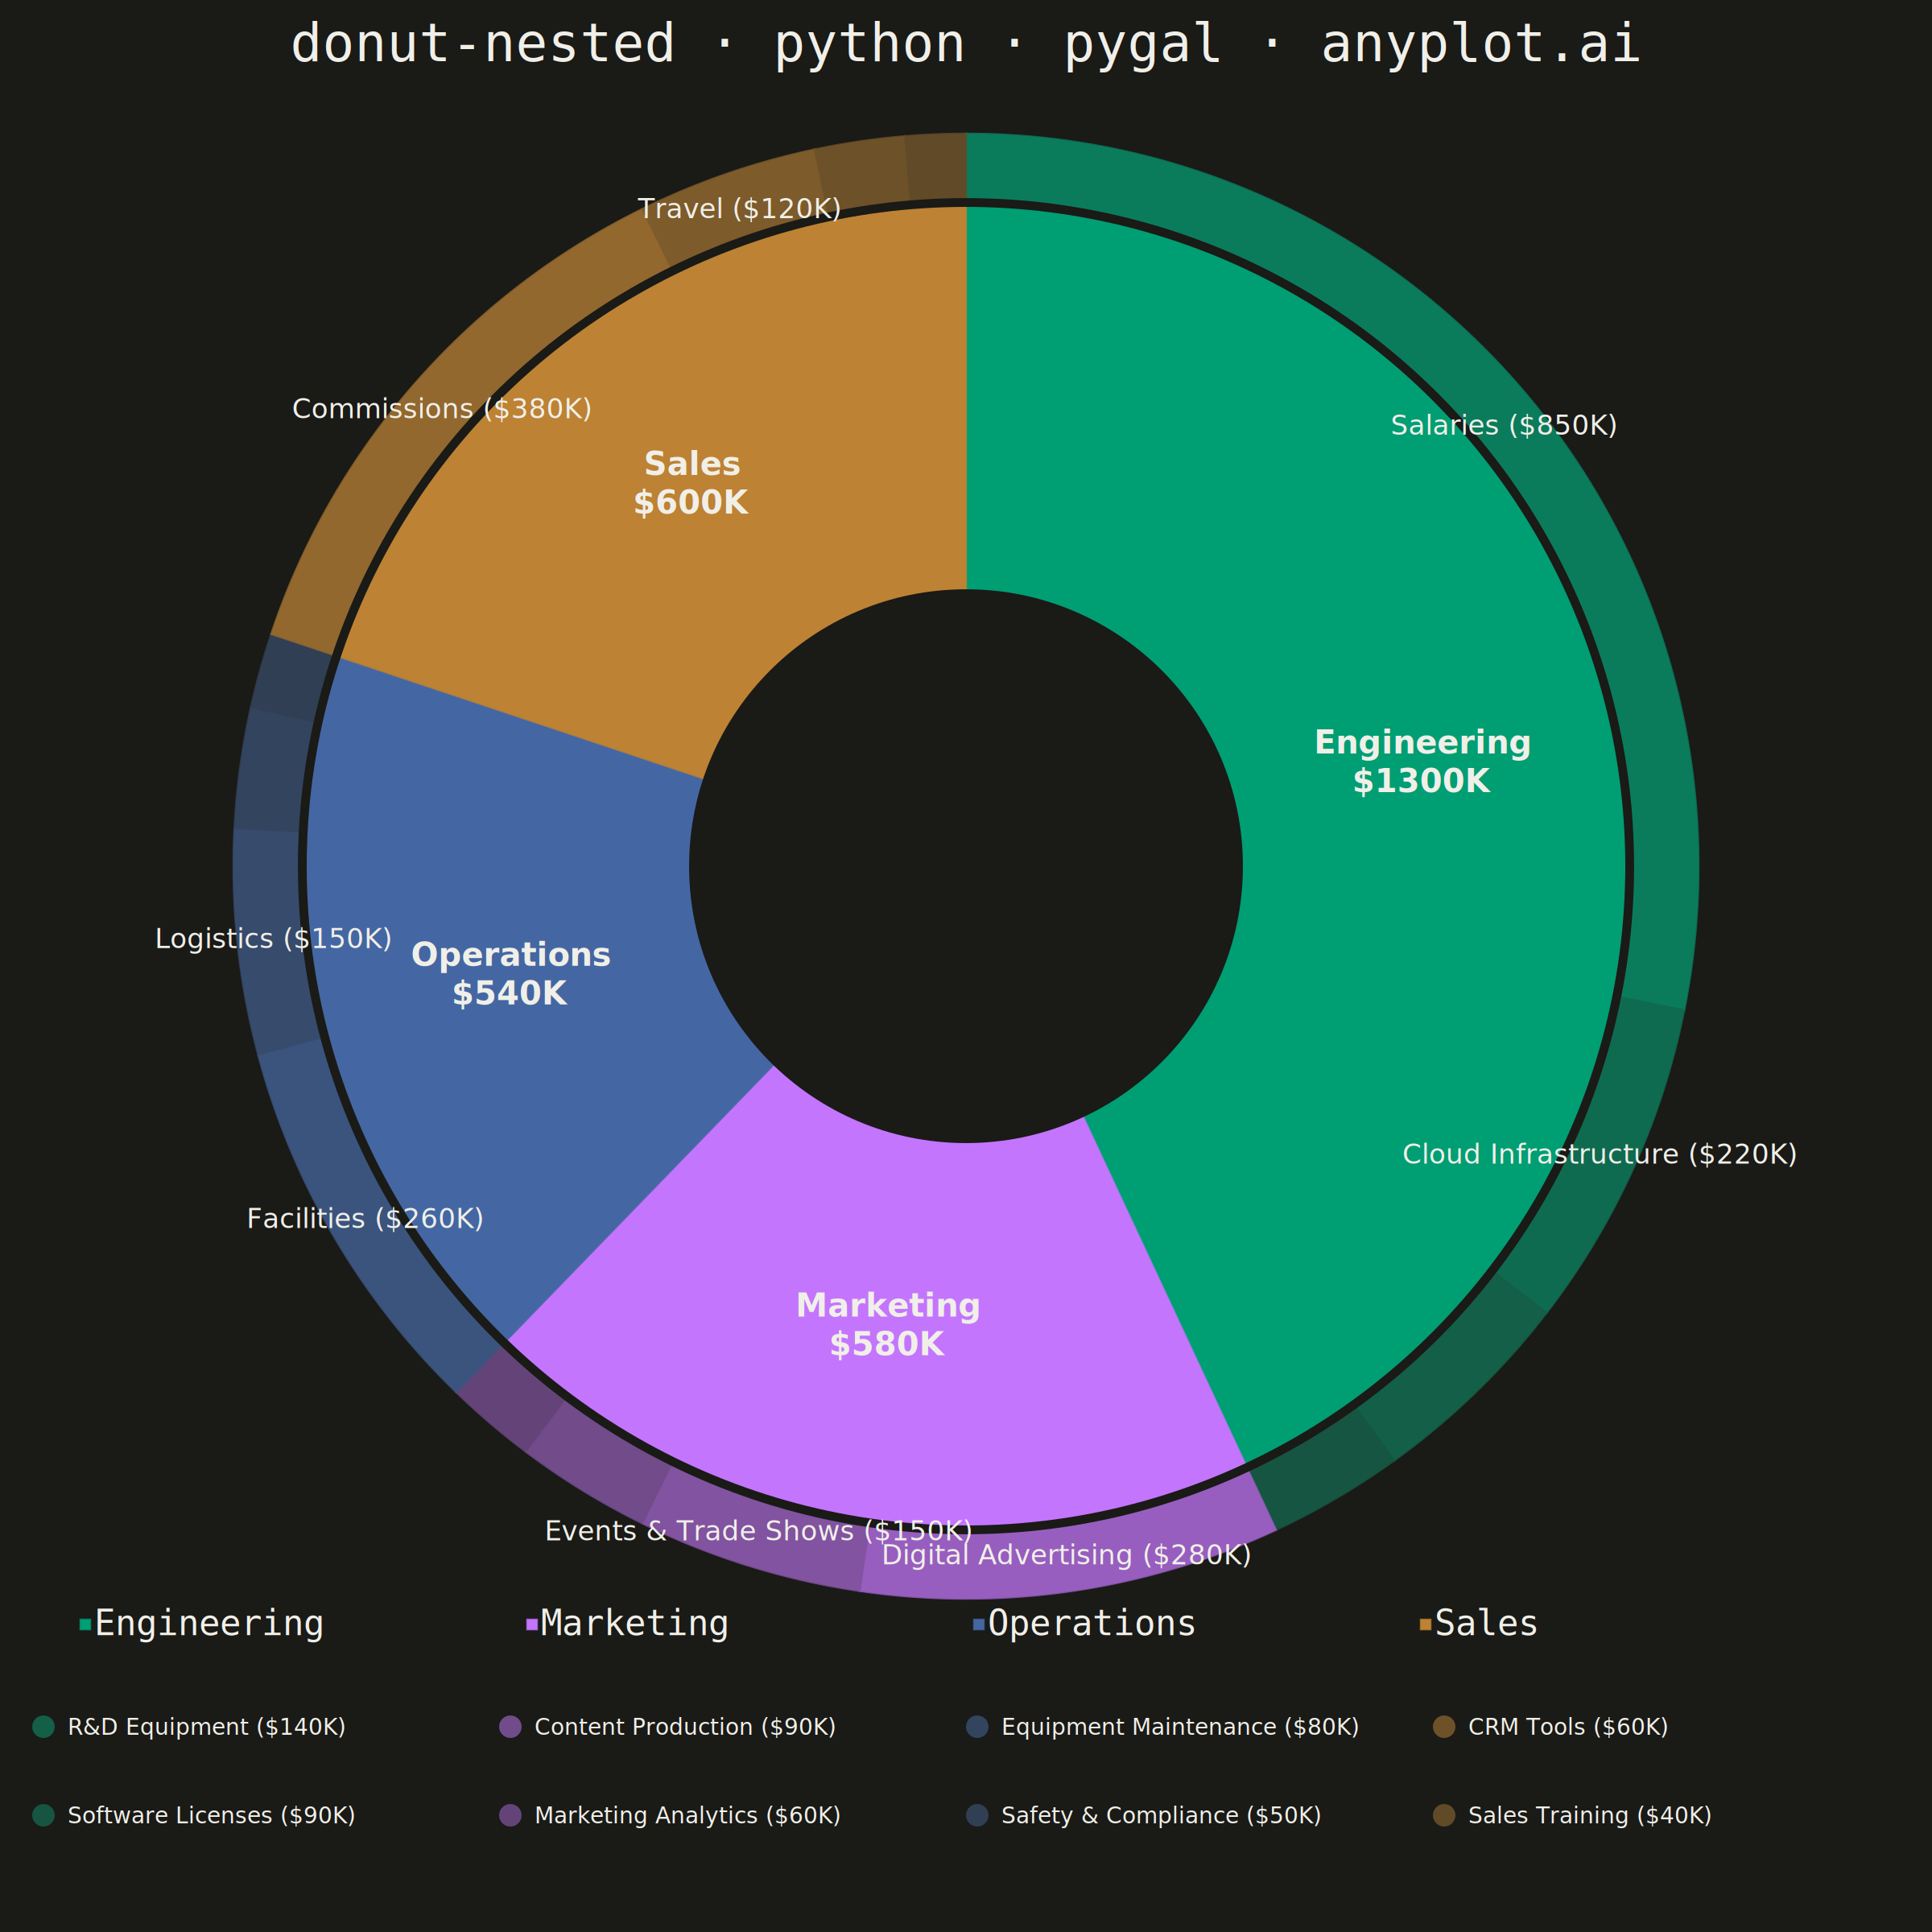
A nested donut chart displays hierarchical data as multiple concentric rings, where each ring represents a level of the hierarchy. Inner rings show parent categories while outer rings show their subdivisions. This visualization effectively reveals part-to-whole relationships across multiple levels while maintaining the familiar donut format.
""" anyplot.ai
donut-nested: Nested Donut Chart
Library: pygal 3.1.3 | Python 3.13.15
Quality: 85/100 | Updated: 2026-08-18
"""

import math
import os
import re
from xml.sax.saxutils import escape

import cairosvg
import pygal
from pygal.style import Style


def lerp_hex(c0, c1, t):
    """Interpolate between two hex colors (see default-style-guide.md continuous-data lerp)."""
    r0, g0, b0 = (int(c0[i : i + 2], 16) for i in (1, 3, 5))
    r1, g1, b1 = (int(c1[i : i + 2], 16) for i in (1, 3, 5))
    r, g, b = (int(round(a + (b - a) * t)) for a, b in ((r0, r1), (g0, g1), (b0, b1)))
    return f"#{r:02X}{g:02X}{b:02X}"


# Theme tokens (see prompts/default-style-guide.md "Background" + "Theme-adaptive Chrome")
THEME = os.getenv("ANYPLOT_THEME", "light")
PAGE_BG = "#FAF8F1" if THEME == "light" else "#1A1A17"
ELEVATED_BG = "#FFFDF6" if THEME == "light" else "#242420"
INK = "#1A1A17" if THEME == "light" else "#F0EFE8"
INK_MUTED = "#6B6A63" if THEME == "light" else "#A8A79F"

# Imprint categorical palette — one hue family per department, canonical order
# since departments are abstract organizational units (no semantic color cue).
IMPRINT_PALETTE = ("#009E73", "#C475FD", "#4467A3", "#BD8233")

# Data: annual budget allocation by department (inner ring) and expense
# category within each department (outer ring), in $K. Every department has
# the same number of categories so pygal's dual-series pie doesn't need to
# zero-pad shorter series.
budget = {
    "Engineering": {"Salaries": 850, "Cloud Infrastructure": 220, "Software Licenses": 90, "R&D Equipment": 140},
    "Marketing": {
        "Digital Advertising": 280,
        "Events & Trade Shows": 150,
        "Content Production": 90,
        "Marketing Analytics": 60,
    },
    "Operations": {"Facilities": 260, "Logistics": 150, "Equipment Maintenance": 80, "Safety & Compliance": 50},
    "Sales": {"Commissions": 380, "Travel": 120, "CRM Tools": 60, "Sales Training": 40},
}

# Each department's categories get a shared hue tinted toward the elevated
# surface color, lightest-first by descending value — consistent color
# families per parent, varying lightness for children (spec requirement).
# Cap at 0.60 (not 0.75) so even the lightest tint keeps enough contrast
# against the page background to stay legible in its own legend swatch.
TINT_STEPS = (0.28, 0.42, 0.52, 0.60)

# Only the top-2 (by value) categories per department are labeled directly on
# the ring; the other 2 are "smaller" and are surfaced via a callout legend
# below the chart instead (spec: "labels on larger segments, legend for
# smaller ones"). pygal's own per-slice text draw silently drops any slice
# whose angle is < 0.3 rad, which is what dropped 9/16 child labels before —
# so this script never asks pygal to draw slice text at all (print_values /
# print_labels are both off) and places every label itself from the exact
# angles it computes, which guarantees all 4 department totals and the 8
# larger-category labels are drawn, with no dependency on that cutoff.
LABELED_RANKS = 2

# Plot — pygal's Pie renders a native two-level "dual" donut when a series
# carries multiple values: each department becomes a full inner wedge, and
# its categories become a thin outer ring aligned to the same angular span.
title = "donut-nested · python · pygal · anyplot.ai"
title_font_size = round(66 * min(1.0, 67 / len(title)))

CANVAS = 2400
BASE_MARGIN = 90
# Extra bottom margin reserved for the manual "smaller categories" callout
# legend (2 rows x 4 department columns).
CALLOUT_ROWS = 2
CALLOUT_ROW_HEIGHT = 110
CALLOUT_TOP_PAD = 50
CALLOUT_HEIGHT = CALLOUT_TOP_PAD + CALLOUT_ROWS * CALLOUT_ROW_HEIGHT

custom_style = Style(
    background=PAGE_BG,
    plot_background=PAGE_BG,
    foreground=INK,
    foreground_strong=INK,
    foreground_subtle=INK_MUTED,
    colors=IMPRINT_PALETTE,
    title_font_size=title_font_size,
    label_font_size=56,
    major_label_font_size=44,
    legend_font_size=44,
    value_font_size=36,
    stroke_width=2.5,
    opacity=1,
    opacity_hover=1,
)

chart = pygal.Pie(
    width=CANVAS,
    height=CANVAS,
    style=custom_style,
    title=title,
    show_legend=True,
    legend_at_bottom=True,
    legend_at_bottom_columns=4,
    print_values=False,
    print_labels=False,
    margin=BASE_MARGIN,
    margin_bottom=BASE_MARGIN + CALLOUT_HEIGHT,
)

departments = list(budget.items())
for i, (department, categories) in enumerate(departments):
    base = IMPRINT_PALETTE[i % len(IMPRINT_PALETTE)]
    ordered = sorted(categories.items(), key=lambda kv: kv[1], reverse=True)
    values = [
        {"value": amount, "color": lerp_hex(base, ELEVATED_BG, TINT_STEPS[rank % len(TINT_STEPS)])}
        for rank, (category, amount) in enumerate(ordered)
    ]
    chart.add(department, values)

# Save — pygal has no native donut hole for the inner ring of a dual pie, and
# its own slice-label placement silently skips any slice whose angle is
# < 0.3 rad (the actual root cause of last review's missing child labels).
# So every piece of on-chart text is authored here instead, from the exact
# same start-angle/radius math pygal's Pie graph uses internally (see
# pygal/graph/pie.py Pie.slice + pygal/util.py coord_project), applied to
# the *raw* budget data — never scraped from already-rendered text.
svg_markup = chart.render().decode("utf-8")

# The rendered <path class="big_slice"> for a dual pie is
# 'M<pt0> A<big_radius> ... <pt1> L<center> A0 ... <center> z' (small_radius
# is 0 for the big_slice, which collapses both its inner-arc endpoints onto
# the true circle center) — the one piece of geometry that must be measured
# from the render, since it depends on pygal's title/legend layout math.
center_match = re.search(
    r'class="big_slice"><path d="M[\d.]+ [\d.]+ A([\d.]+) [\d.]+ 0 \d \d ' r"[\d.]+ [\d.]+ L([\d.]+) ([\d.]+)",
    svg_markup,
)
dept_wedge_radius, center_x, center_y = (float(g) for g in center_match.groups())
# The slices live inside <g transform="translate(ox, oy)" class="plot">, so
# the coordinates above are in that local space — our overlay is appended at
# the SVG root (untranslated), so the plot's own offset must be added back.
offset_match = re.search(r'<g transform="translate\(([\d.]+), ([\d.]+)\)" class="plot">', svg_markup)
plot_offset_x, plot_offset_y = (float(g) for g in offset_match.groups())
center_x += plot_offset_x
center_y += plot_offset_y
# dept_wedge_radius is pygal's big_radius for the big_slice, i.e. radius * .9
# (see Pie.slice: dual big_slice uses radius * .9, small_radius 0); the outer
# thin category ring then runs from dept_wedge_radius out to radius * 1 / .9.
outer_radius = dept_wedge_radius / 0.9

hole_radius = dept_wedge_radius * 0.42
dept_label_radius = (hole_radius + dept_wedge_radius) / 2
child_label_radius = (dept_wedge_radius + outer_radius) / 2
ring_gap_stroke = max(6.0, outer_radius * 0.012)


def polar_to_xy(radius, theta):
    """Same projection pygal's coord_abs_project uses: angle 0 = top, clockwise."""
    return (center_x + radius * math.sin(theta), center_y - radius * math.cos(theta))


def svg_text(x, y, font_size, fill, anchor, weight, content):
    return (
        f'<text x="{x:.1f}" y="{y:.1f}" font-size="{font_size}" font-family="sans-serif" '
        f'fill="{fill}" text-anchor="{anchor}" font-weight="{weight}">{escape(content)}</text>'
    )


overlay = [
    f'<circle cx="{center_x}" cy="{center_y}" r="{dept_wedge_radius + ring_gap_stroke / 2}" '
    f'fill="none" stroke="{PAGE_BG}" stroke-width="{ring_gap_stroke}"/>',
    f'<circle cx="{center_x}" cy="{center_y}" r="{hole_radius}" fill="{PAGE_BG}" stroke="none"/>',
]

grand_total = sum(amount for categories in budget.values() for amount in categories.values())
current_angle = 0.0
callout_entries = []  # (department_index, category, amount, color) for the smaller-half legend

for i, (department, categories) in enumerate(departments):
    base = IMPRINT_PALETTE[i % len(IMPRINT_PALETTE)]
    ordered = sorted(categories.items(), key=lambda kv: kv[1], reverse=True)
    dept_total = sum(categories.values())
    dept_start_angle = current_angle

    for rank, (category, amount) in enumerate(ordered):
        child_angle = 2 * math.pi * amount / grand_total
        child_mid_angle = current_angle + child_angle / 2
        color = lerp_hex(base, ELEVATED_BG, TINT_STEPS[rank % len(TINT_STEPS)])
        if rank < LABELED_RANKS:
            x, y = polar_to_xy(child_label_radius, child_mid_angle)
            overlay.append(svg_text(x, y + 12, 34, INK, "middle", "normal", f"{category} (${amount}K)"))
        else:
            callout_entries.append((i, category, amount, color))
        current_angle += child_angle

    dept_angle = current_angle - dept_start_angle
    dept_mid_angle = dept_start_angle + dept_angle / 2
    x, y = polar_to_xy(dept_label_radius, dept_mid_angle)
    overlay.append(svg_text(x, y - 14, 40, INK, "middle", "bold", department))
    overlay.append(svg_text(x, y + 34, 40, INK, "middle", "bold", f"${dept_total}K"))

# Callout legend for the two smaller (unlabeled) categories per department —
# satisfies the spec's "labels on larger segments, legend for smaller ones".
side_pad = 40
col_width = (CANVAS - 2 * side_pad) / len(departments)
callout_top = CANVAS - (BASE_MARGIN + CALLOUT_HEIGHT) + CALLOUT_TOP_PAD
swatch_r = 14
for entry_index, (dept_index, category, amount, color) in enumerate(callout_entries):
    row = entry_index % 2
    col_left = side_pad + col_width * dept_index
    row_y = callout_top + row * CALLOUT_ROW_HEIGHT + CALLOUT_ROW_HEIGHT / 2
    text_x = col_left + 2 * swatch_r + 16
    overlay.append(f'<circle cx="{col_left + swatch_r}" cy="{row_y}" r="{swatch_r}" fill="{color}"/>')
    overlay.append(svg_text(text_x, row_y + 10, 28, INK, "start", "normal", f"{category} (${amount}K)"))

svg_markup = svg_markup.replace("</svg>", "".join(overlay) + "</svg>")

with open(f"plot-{THEME}.html", "w") as f:
    f.write(svg_markup)

cairosvg.svg2png(bytestring=svg_markup.encode("utf-8"), write_to=f"plot-{THEME}.png")
Runnable source as JSON, for any HTTP client: https://api.anyplot.ai/specs/donut-nested/pygal/code. Any spec id and library id listed in llms-full.txt fit the same URL shape; every URL below is complete and callable.
{
  "spec_id": "donut-nested",
  "language": "python",
  "library": "pygal",
  "page": "https://anyplot.ai/donut-nested/python/pygal",
  "hub": "https://anyplot.ai/donut-nested",
  "code_json": "https://api.anyplot.ai/specs/donut-nested/pygal/code",
  "spec_json": "https://api.anyplot.ai/specs/donut-nested",
  "render_light_png": "https://storage.googleapis.com/anyplot-images/plots/donut-nested/python/pygal/plot-light.png",
  "render_dark_png": "https://storage.googleapis.com/anyplot-images/plots/donut-nested/python/pygal/plot-dark.png",
  "interactive_light_html": "https://storage.googleapis.com/anyplot-images/plots/donut-nested/python/pygal/plot-light.html",
  "interactive_dark_html": "https://storage.googleapis.com/anyplot-images/plots/donut-nested/python/pygal/plot-dark.html",
  "quality_score": 85.0,
  "license": "MIT",
  "guide": "https://anyplot.ai/llms.txt"
}
Part of Nested Donut Chart on anyplot.ai.