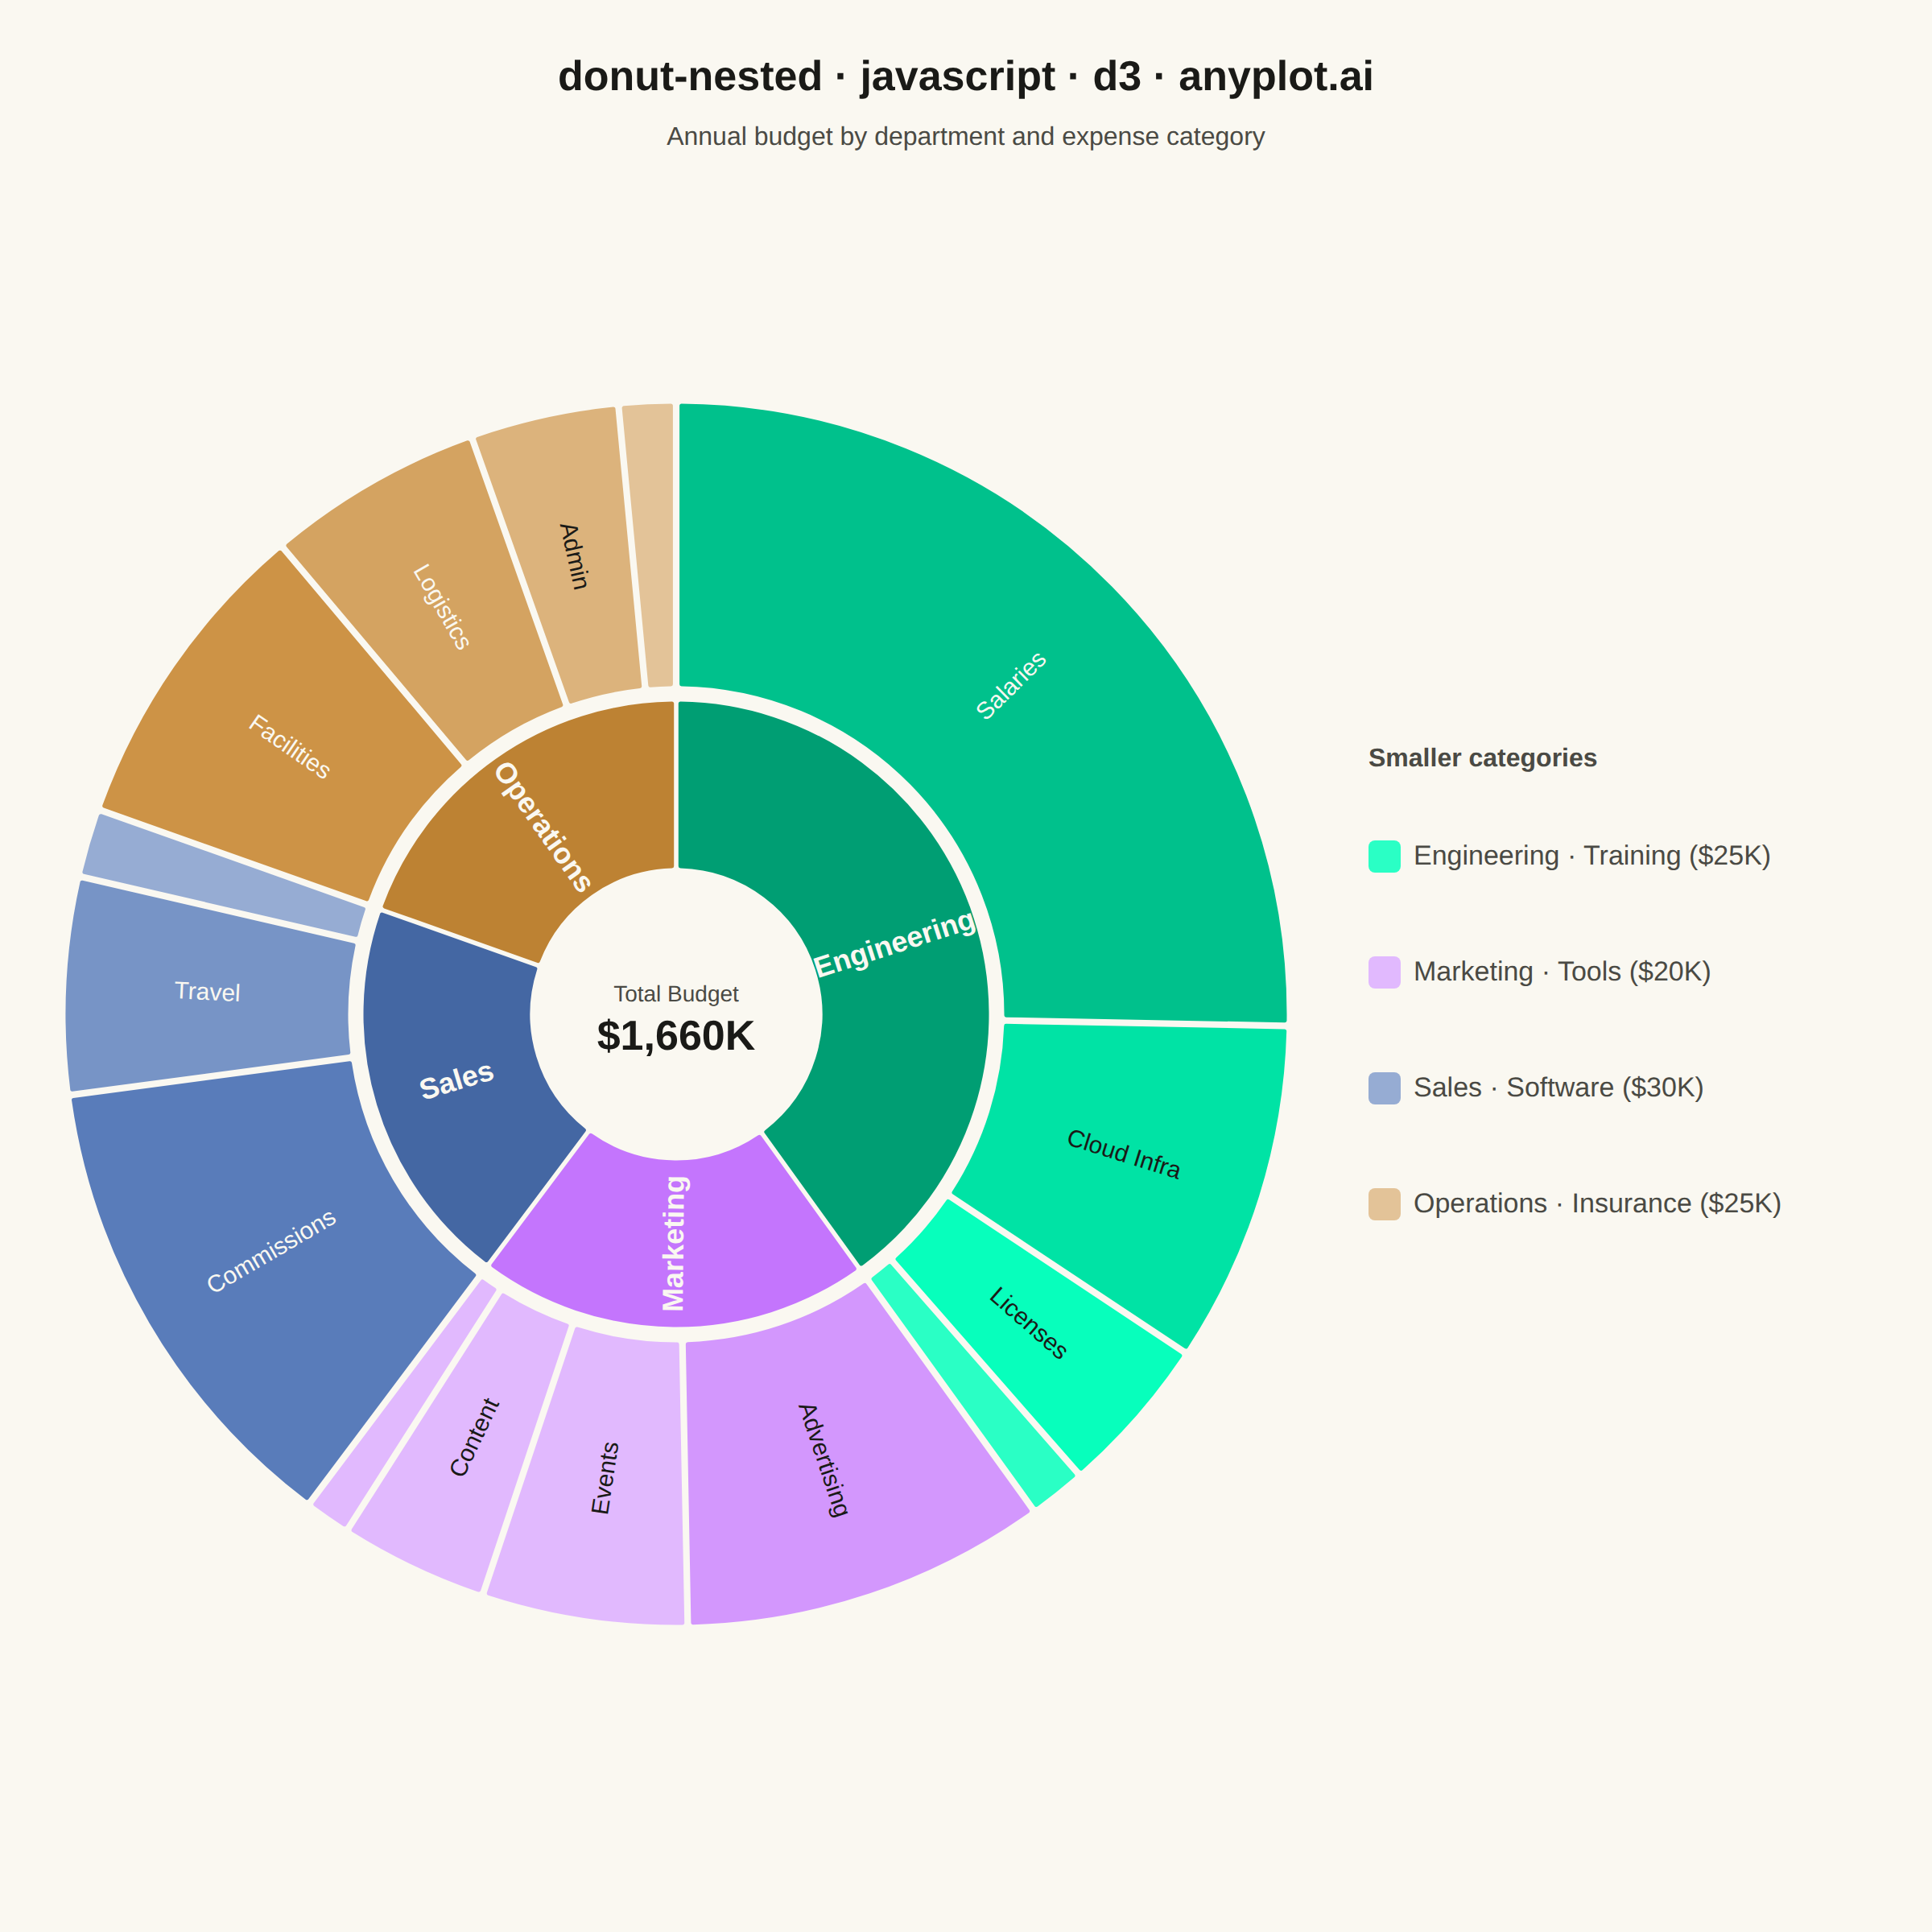
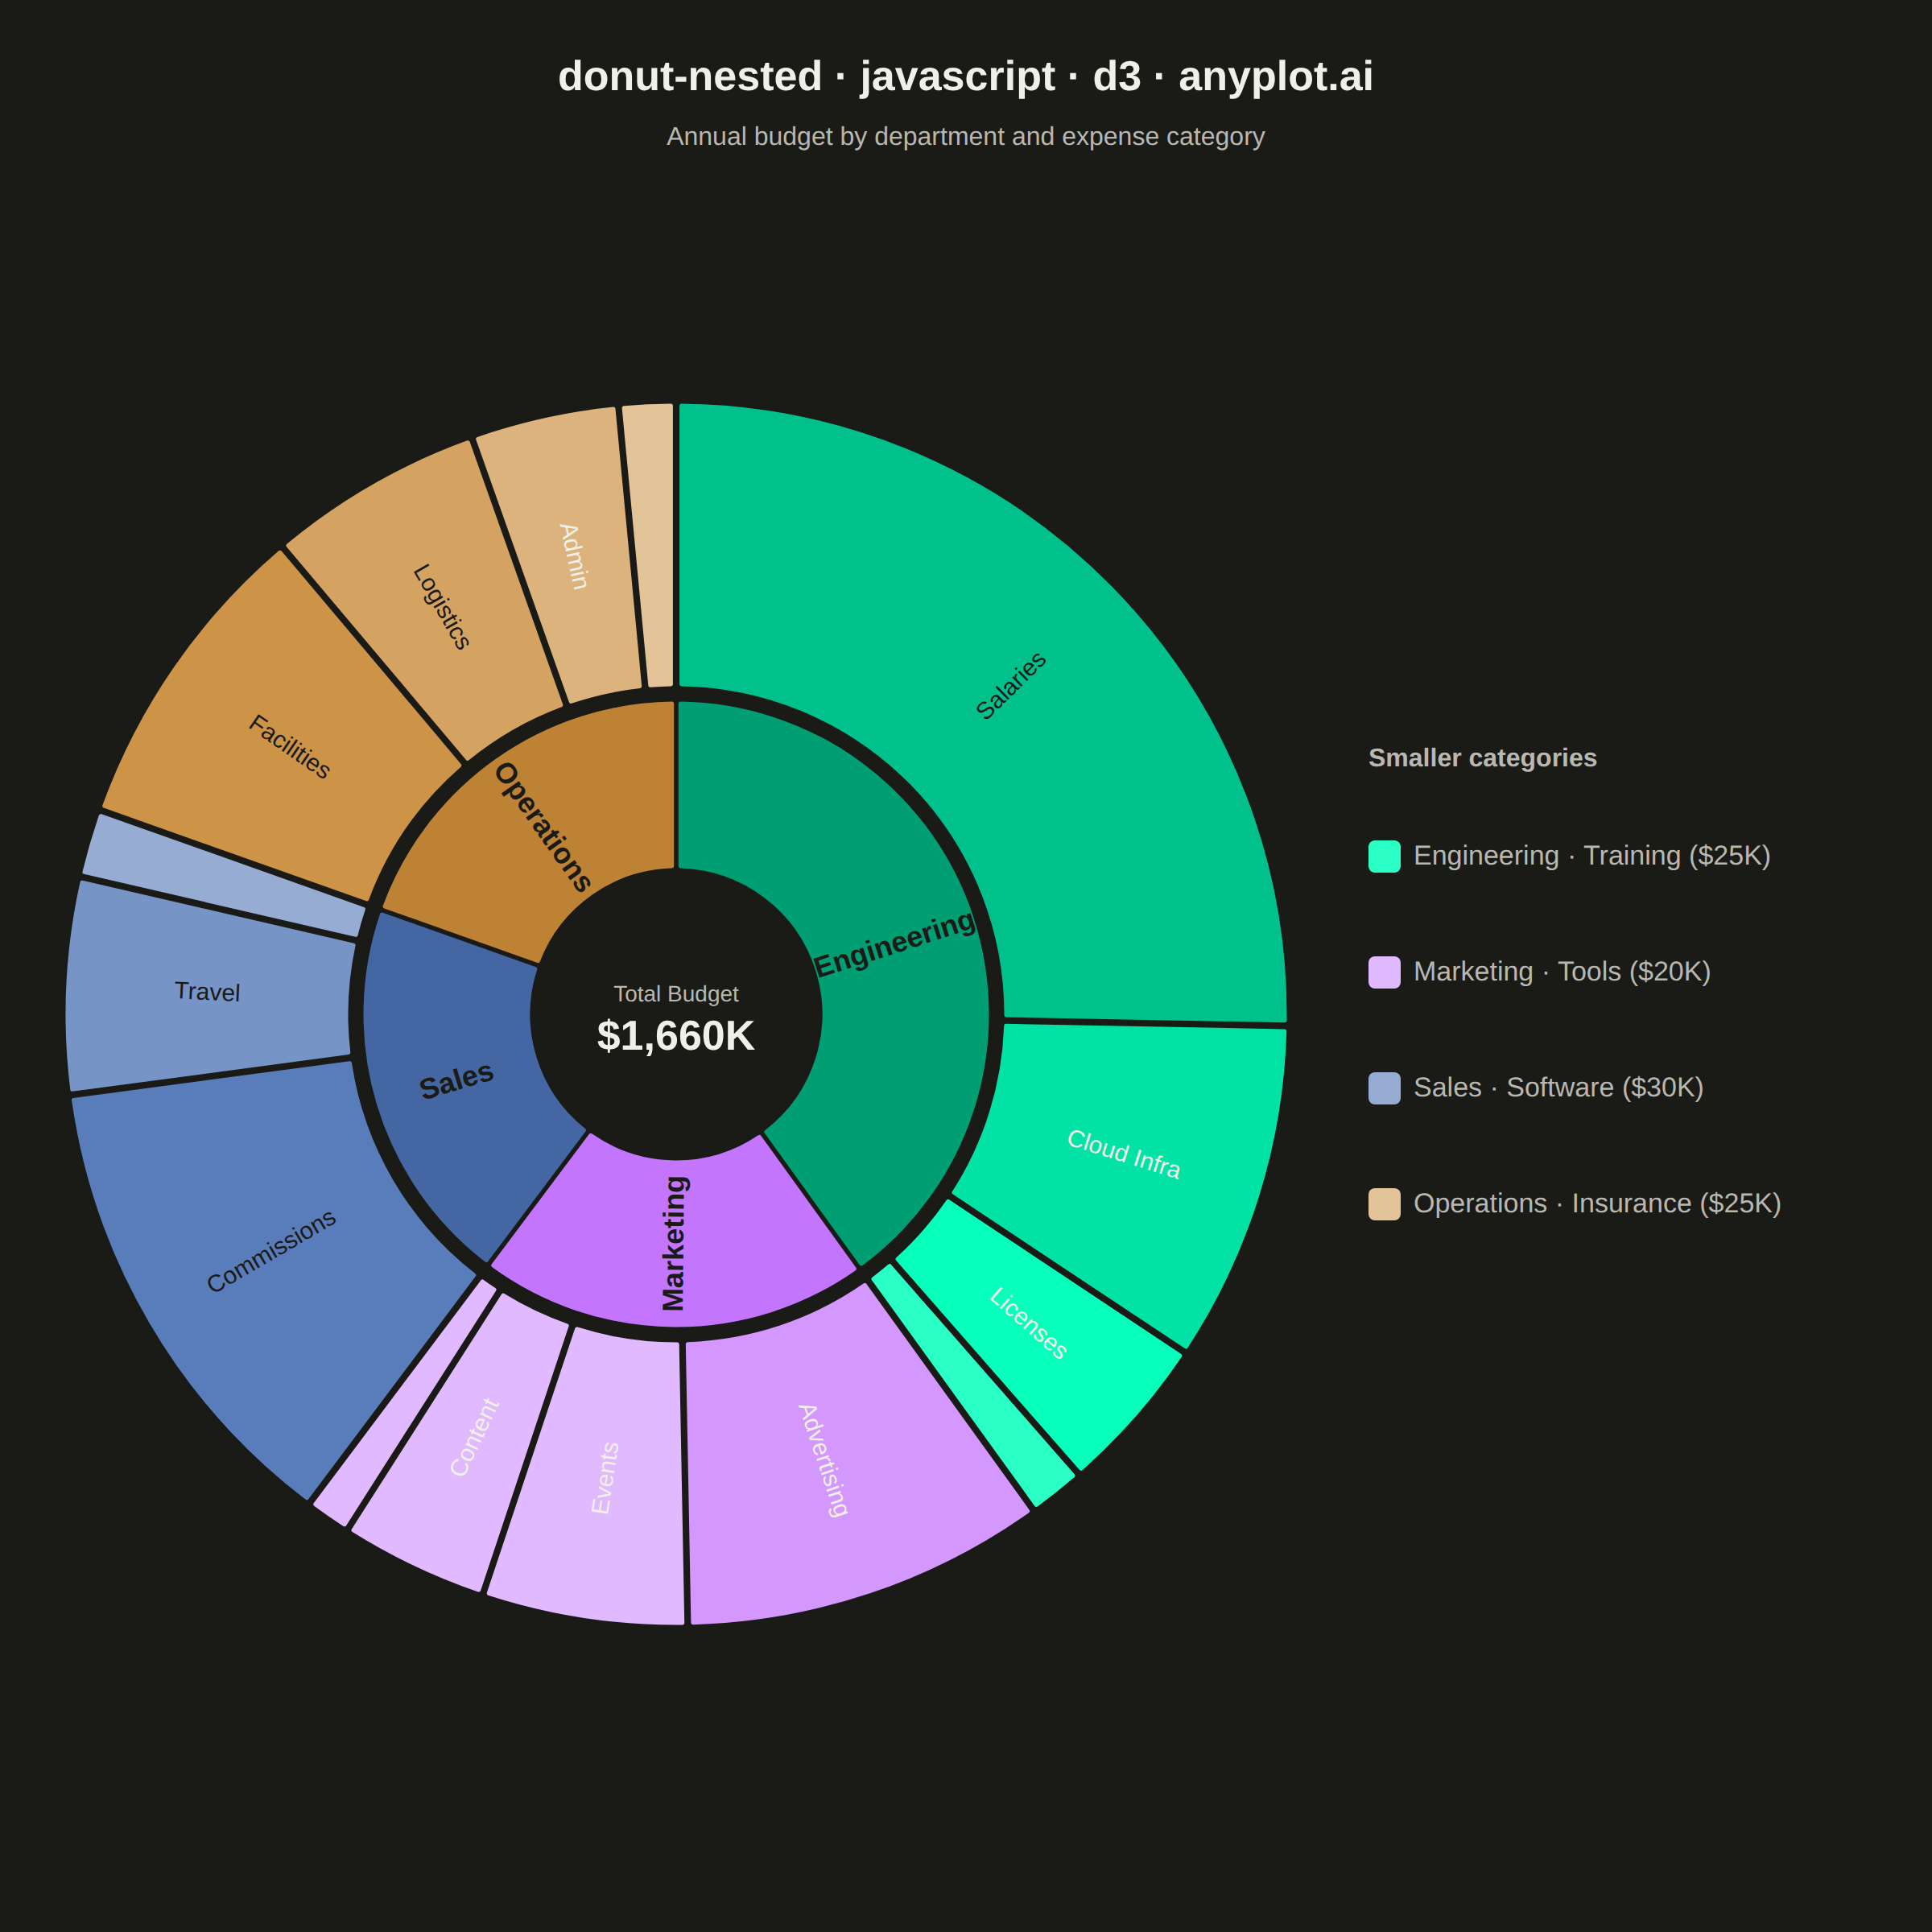
The same plot in 14 other libraries — JavaScript: Chart.js, Apache ECharts, Highcharts, MUI X Charts; Python: Altair, Bokeh, lets-plot, Matplotlib, Plotly, plotnine, Pygal, Seaborn; R: ggplot2; Julia: Makie.jl. Compare all 15 side by side: Nested Donut Chart in Python, R, Julia and JavaScript.
A nested donut chart displays hierarchical data as multiple concentric rings, where each ring represents a level of the hierarchy. Inner rings show parent categories while outer rings show their subdivisions. This visualization effectively reveals part-to-whole relationships across multiple levels while maintaining the familiar donut format.
// anyplot.ai
// donut-nested: Nested Donut Chart
// Library: d3 7.9.0 | JavaScript 22.23.2
// Quality: 91/100 | Created: 2026-08-18
//# anyplot-orientation: square

const t = window.ANYPLOT_TOKENS;
const { width, height } = window.ANYPLOT_SIZE;

// --- Data (in-memory, deterministic): annual department budget, $K ---------
const departments = [
  {
    name: "Engineering",
    children: [
      { name: "Salaries", value: 420 },
      { name: "Cloud Infra", value: 150 },
      { name: "Licenses", value: 70 },
      { name: "Training", value: 25 },
    ],
  },
  {
    name: "Marketing",
    children: [
      { name: "Advertising", value: 160 },
      { name: "Events", value: 90 },
      { name: "Content", value: 65 },
      { name: "Tools", value: 20 },
    ],
  },
  {
    name: "Sales",
    children: [
      { name: "Commissions", value: 210 },
      { name: "Travel", value: 95 },
      { name: "Software", value: 30 },
    ],
  },
  {
    name: "Operations",
    children: [
      { name: "Facilities", value: 140 },
      { name: "Logistics", value: 95 },
      { name: "Admin", value: 65 },
      { name: "Insurance", value: 25 },
    ],
  },
];

const root = d3.hierarchy({ name: "Budget", children: departments }).sum((d) => d.value);
d3.partition().size([2 * Math.PI, 1])(root);
const grandTotal = root.value;

// --- Radii: two rings with a visible gap; angles come straight from the ----
// --- hierarchy, so child segments align exactly under their parent's arc ---
const HOLE = 90;
const RING1_OUT = 195;
const RING2_IN = 203;
const RING2_OUT = 380;
const radiusFor = (depth) => (depth === 1 ? { inner: HOLE, outer: RING1_OUT } : { inner: RING2_IN, outer: RING2_OUT });

const arc = d3
  .arc()
  .startAngle((d) => d.x0)
  .endAngle((d) => d.x1)
  .padAngle(0.006)
  .cornerRadius(2)
  .innerRadius((d) => radiusFor(d.depth).inner)
  .outerRadius((d) => radiusFor(d.depth).outer);

// --- Color: one Imprint hue per department, lightened per child ------------
const deptNames = departments.map((d) => d.name);
const deptColor = d3.scaleOrdinal().domain(deptNames).range(t.palette.slice(0, deptNames.length));

const shade = (hex, i, n) => {
  const c = d3.hsl(hex);
  c.l = Math.min(0.86, c.l + ((i + 1) / (n + 1)) * 0.34);
  return c.formatHex();
};

const fillFor = (d) => {
  if (d.depth === 1) return deptColor(d.data.name);
  const base = deptColor(d.parent.data.name);
  const siblings = d.parent.children;
  return shade(base, siblings.indexOf(d), siblings.length);
};

// Relative-luminance check so segment labels stay legible on every shade.
const luminance = (hex) => {
  const c = d3.rgb(hex);
  const lin = (v) => {
    v /= 255;
    return v <= 0.03928 ? v / 12.92 : Math.pow((v + 0.055) / 1.055, 2.4);
  };
  return 0.2126 * lin(c.r) + 0.7152 * lin(c.g) + 0.0722 * lin(c.b);
};
const labelInkFor = (fill) => (luminance(fill) > 0.42 ? t.ink : t.pageBg);

// --- Mount -------------------------------------------------------------
const svg = d3.select("#container").append("svg").attr("width", width).attr("height", height);

// Centered lower in the mount (below the title block) so the donut's full
// vertical extent is available to balance against the legend column.
const cx = 420;
const cy = 630;
const g = svg.append("g").attr("transform", `translate(${cx},${cy})`);

const nodes = root.descendants().filter((d) => d.depth > 0);

g.selectAll("path")
  .data(nodes)
  .join("path")
  .attr("d", arc)
  .attr("fill", fillFor)
  .attr("stroke", t.pageBg)
  .attr("stroke-width", 1.5);

// --- Radial labels on segments large enough to hold text; smaller ones -----
// --- fall through to the legend below (per spec: label large, legend small) -
// Threshold raised alongside the bigger label fontsizes below so labels never
// crowd a segment too small to hold them.
const labelVisible = (d) => (d.x1 - d.x0) * ((radiusFor(d.depth).inner + radiusFor(d.depth).outer) / 2) > 46;

const labelTransform = (d) => {
  const deg = ((d.x0 + d.x1) / 2) * (180 / Math.PI);
  const r = (radiusFor(d.depth).inner + radiusFor(d.depth).outer) / 2;
  return `rotate(${deg - 90}) translate(${r},0) rotate(${deg < 180 ? 0 : 180})`;
};

g.selectAll("text.segment")
  .data(nodes.filter(labelVisible))
  .join("text")
  .attr("class", "segment")
  .attr("transform", labelTransform)
  .attr("text-anchor", "middle")
  .attr("dy", "0.32em")
  .style("font-size", (d) => (d.depth === 1 ? "18px" : "15px"))
  .style("font-weight", (d) => (d.depth === 1 ? "600" : "400"))
  .attr("fill", (d) => labelInkFor(fillFor(d)))
  .text((d) => d.data.name);

// --- Center total ------------------------------------------------------
g.append("text")
  .attr("text-anchor", "middle")
  .attr("y", -8)
  .style("font-size", "14px")
  .attr("fill", t.inkSoft)
  .text("Total Budget");
g.append("text")
  .attr("text-anchor", "middle")
  .attr("y", 22)
  .style("font-size", "26px")
  .style("font-weight", "700")
  .attr("fill", t.ink)
  .text(`$${grandTotal.toLocaleString("en-US")}K`);

// --- Legend for the segments too small to carry an inline label ------------
// Rows are vertically centered on the donut's own center (cy) so the block
// balances against the ring's full height instead of hugging the top.
const legendItems = nodes.filter((d) => d.depth === 2 && !labelVisible(d));
const legendX = 850;
const rowH = 72;
const legendTop = cy - ((legendItems.length - 1) * rowH) / 2;

svg
  .append("text")
  .attr("x", legendX)
  .attr("y", legendTop - 46)
  .style("font-size", "16px")
  .style("font-weight", "600")
  .attr("fill", t.inkSoft)
  .text("Smaller categories");

const legend = svg
  .selectAll("g.legend-item")
  .data(legendItems)
  .join("g")
  .attr("class", "legend-item")
  .attr("transform", (d, i) => `translate(${legendX},${legendTop + i * rowH})`);

legend.append("rect").attr("width", 20).attr("height", 20).attr("rx", 4).attr("fill", fillFor);
legend
  .append("text")
  .attr("x", 28)
  .attr("y", 15)
  .style("font-size", "17px")
  .attr("fill", t.inkSoft)
  .text((d) => `${d.parent.data.name} · ${d.data.name} ($${d.data.value}K)`);

// --- Title ---------------------------------------------------------------
svg
  .append("text")
  .attr("x", width / 2)
  .attr("y", 56)
  .attr("text-anchor", "middle")
  .attr("fill", t.ink)
  .style("font-size", "26px")
  .style("font-weight", "600")
  .text("donut-nested · javascript · d3 · anyplot.ai");
svg
  .append("text")
  .attr("x", width / 2)
  .attr("y", 90)
  .attr("text-anchor", "middle")
  .attr("fill", t.inkSoft)
  .style("font-size", "16px")
  .text("Annual budget by department and expense category");
Runnable source as JSON, for any HTTP client: https://api.anyplot.ai/specs/donut-nested/d3/code. Any spec id and library id listed in llms-full.txt fit the same URL shape; every URL below is complete and callable.
{
  "spec_id": "donut-nested",
  "language": "javascript",
  "library": "d3",
  "page": "https://anyplot.ai/donut-nested/javascript/d3",
  "hub": "https://anyplot.ai/donut-nested",
  "code_json": "https://api.anyplot.ai/specs/donut-nested/d3/code",
  "spec_json": "https://api.anyplot.ai/specs/donut-nested",
  "render_light_png": "https://storage.googleapis.com/anyplot-images/plots/donut-nested/javascript/d3/plot-light.png",
  "render_dark_png": "https://storage.googleapis.com/anyplot-images/plots/donut-nested/javascript/d3/plot-dark.png",
  "interactive_light_html": "https://storage.googleapis.com/anyplot-images/plots/donut-nested/javascript/d3/plot-light.html",
  "interactive_dark_html": "https://storage.googleapis.com/anyplot-images/plots/donut-nested/javascript/d3/plot-dark.html",
  "quality_score": 91.0,
  "license": "MIT",
  "guide": "https://anyplot.ai/llms.txt"
}
Part of Nested Donut Chart on anyplot.ai.