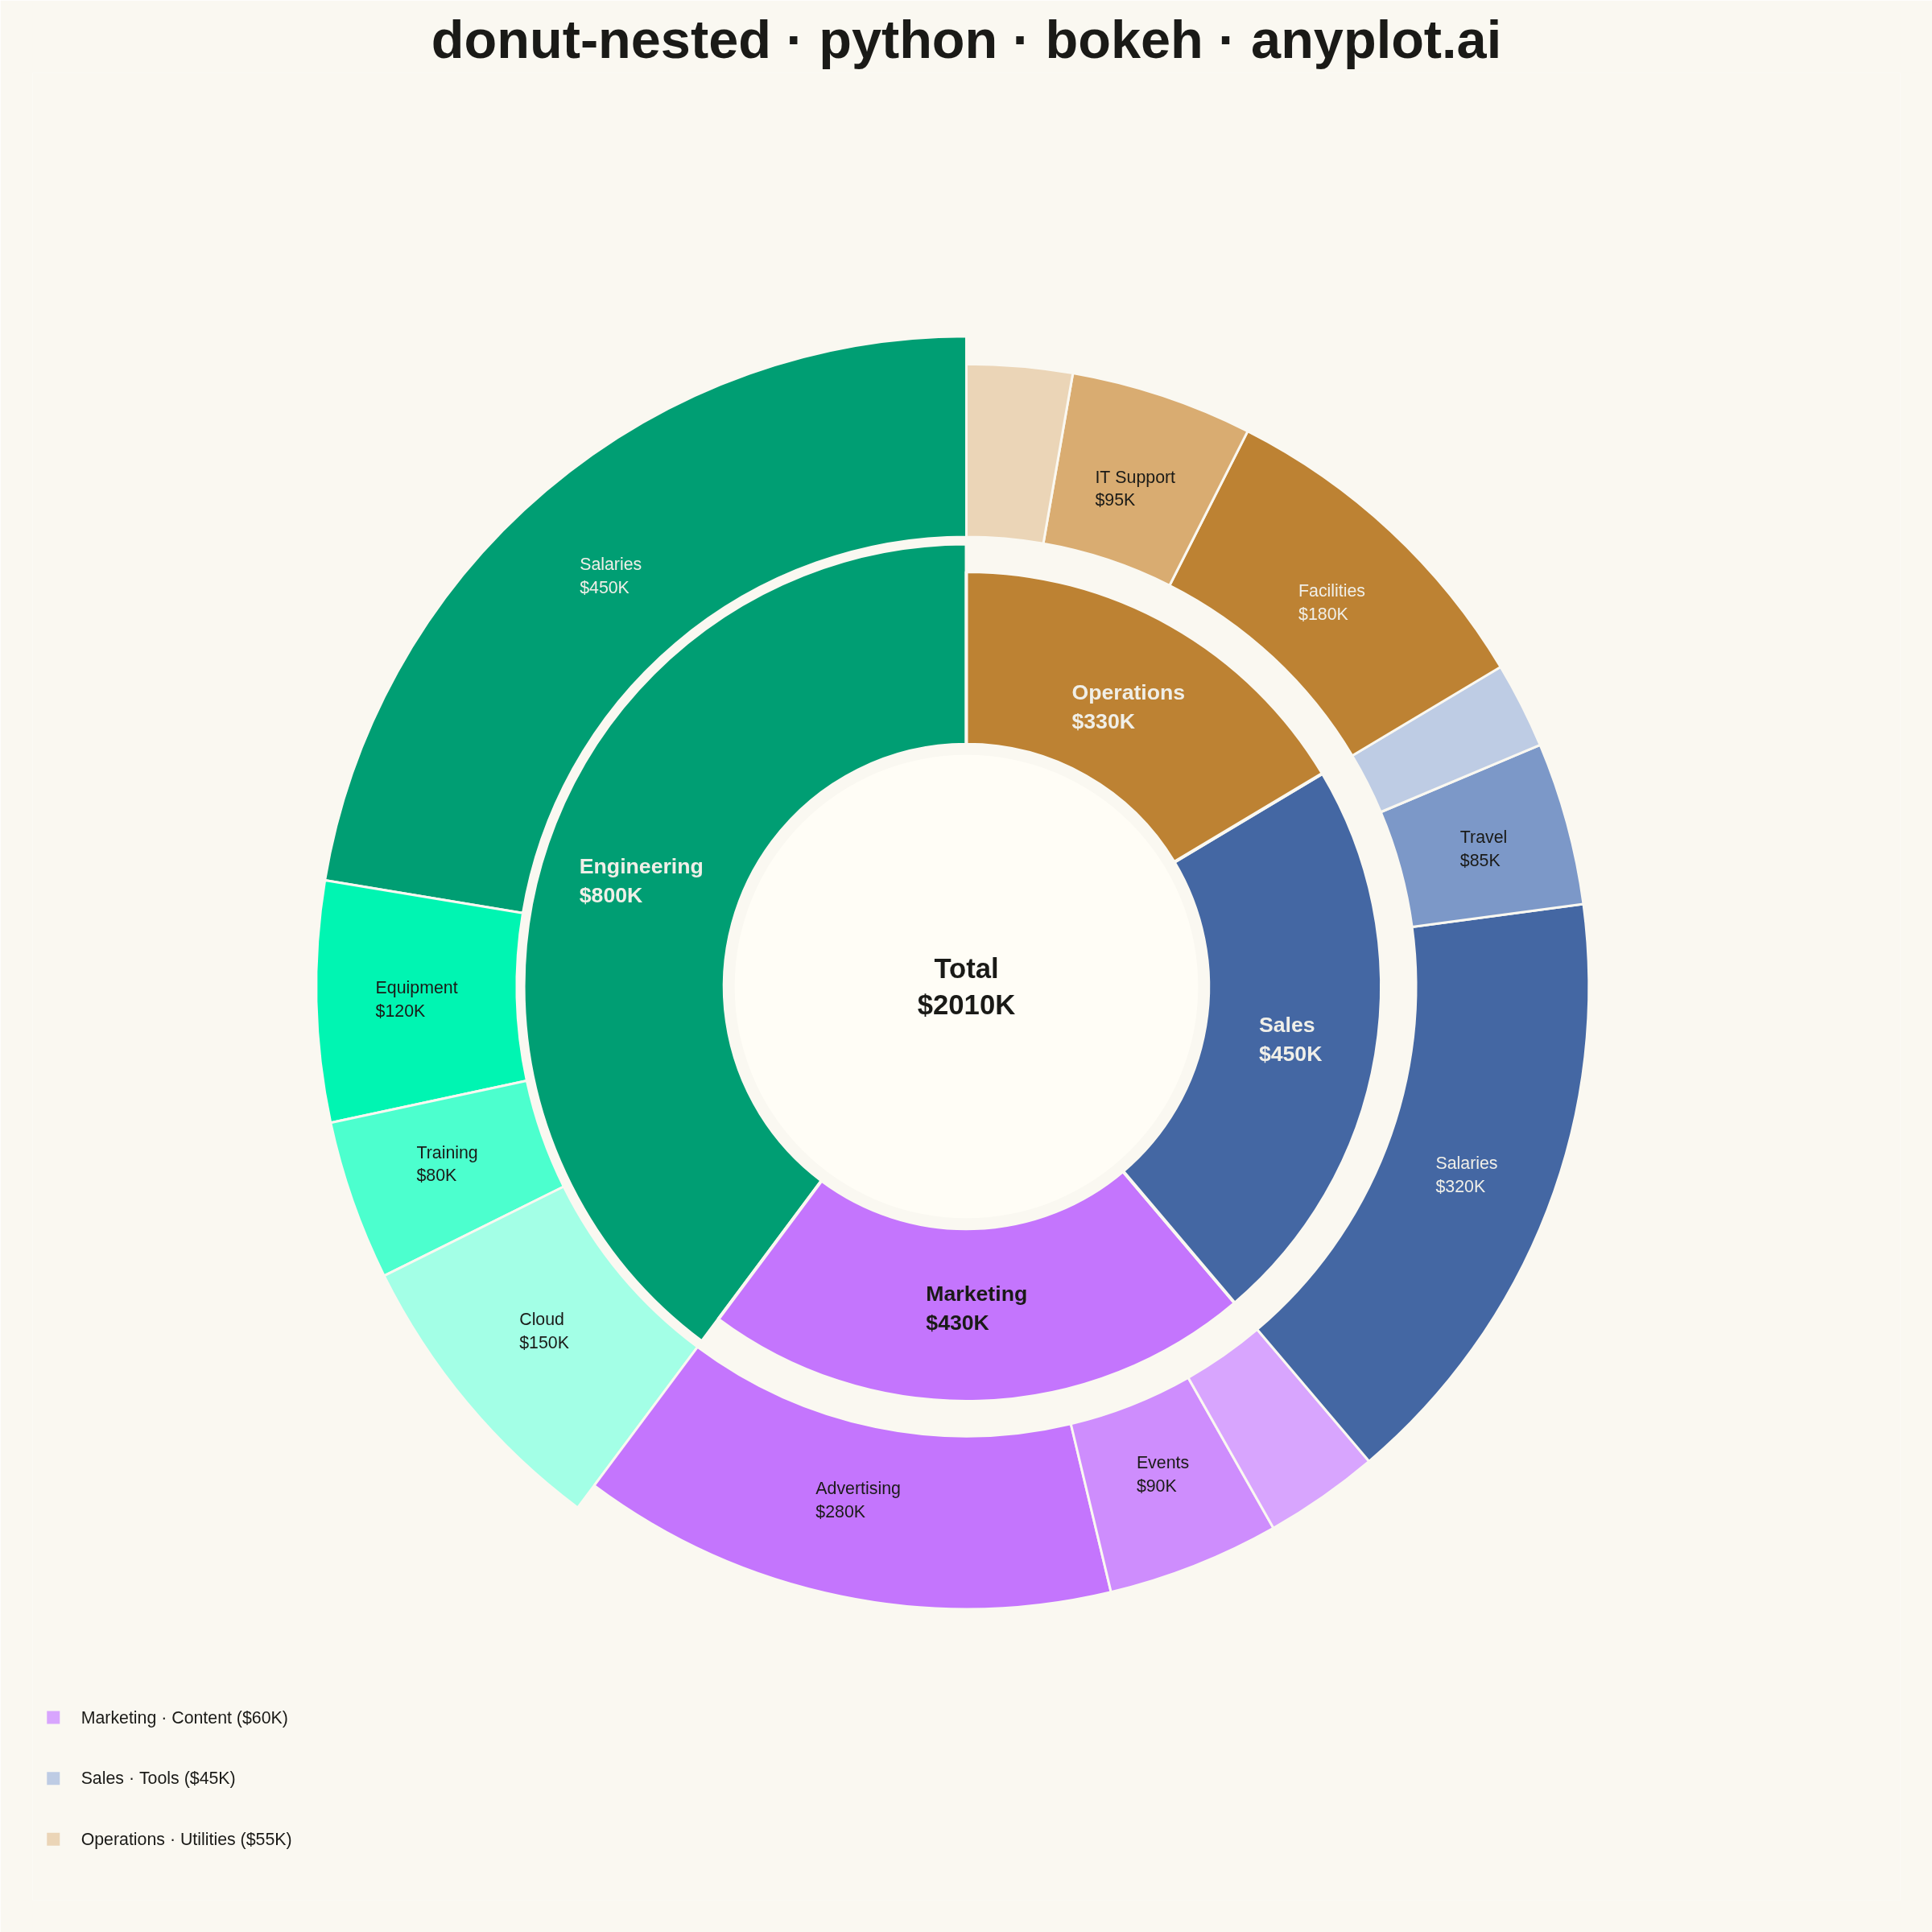
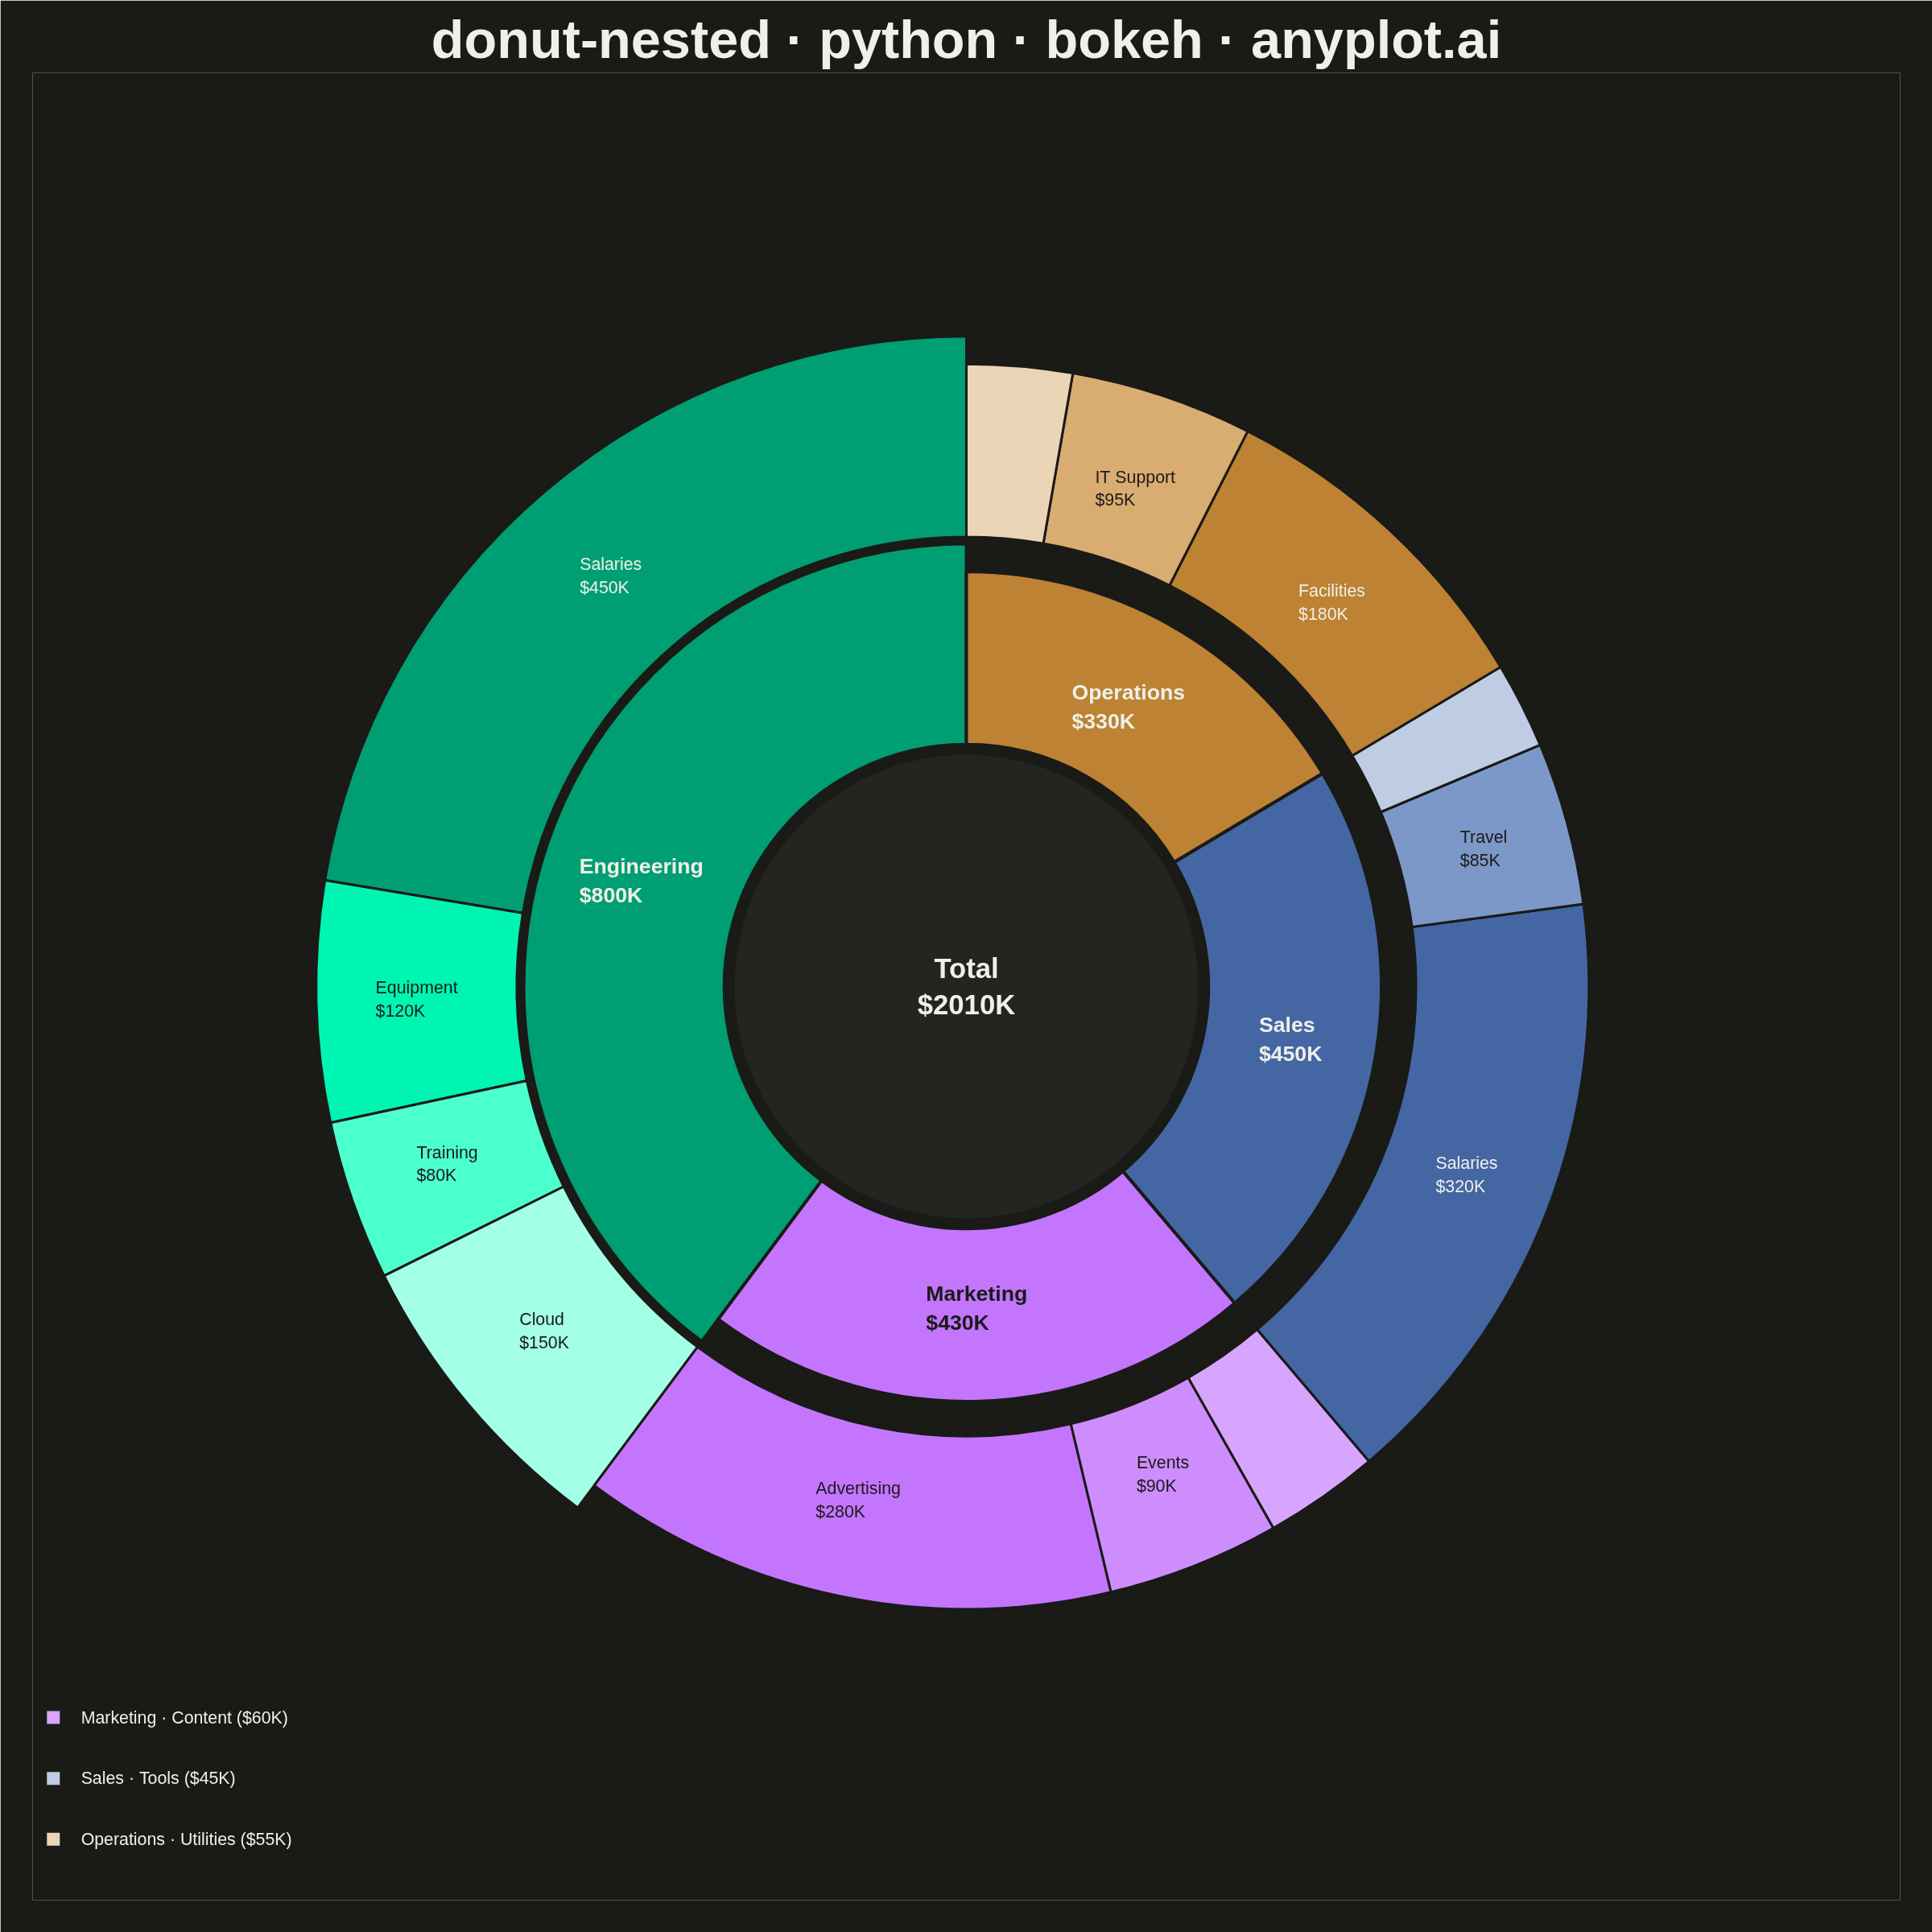
A nested donut chart displays hierarchical data as multiple concentric rings, where each ring represents a level of the hierarchy. Inner rings show parent categories while outer rings show their subdivisions. This visualization effectively reveals part-to-whole relationships across multiple levels while maintaining the familiar donut format.
""" anyplot.ai
donut-nested: Nested Donut Chart
Library: bokeh 3.9.2 | Python 3.13.15
Quality: 92/100 | Updated: 2026-08-18
"""

import os
import time
from colorsys import hls_to_rgb, rgb_to_hls
from math import pi
from pathlib import Path

import numpy as np
from bokeh.io import output_file, save
from bokeh.models import ColumnDataSource, HoverTool, LabelSet
from bokeh.plotting import figure
from selenium import webdriver
from selenium.webdriver.chrome.options import Options


# Theme tokens
THEME = os.getenv("ANYPLOT_THEME", "light")
PAGE_BG = "#FAF8F1" if THEME == "light" else "#1A1A17"
ELEVATED_BG = "#FFFDF6" if THEME == "light" else "#242420"
INK = "#1A1A17" if THEME == "light" else "#F0EFE8"

# Data: Budget allocation by department and expense categories
# Inner ring: departments, outer ring: expense categories within each department
data = {
    "Engineering": {"Salaries": 450, "Equipment": 120, "Training": 80, "Cloud": 150},
    "Marketing": {"Advertising": 280, "Events": 90, "Content": 60},
    "Sales": {"Salaries": 320, "Travel": 85, "Tools": 45},
    "Operations": {"Facilities": 180, "IT Support": 95, "Utilities": 55},
}

# Imprint palette, positions 1-4 (one hue per department)
IMPRINT_PALETTE = ["#009E73", "#C475FD", "#4467A3", "#BD8233"]


def hex_to_rgb01(hex_color):
    hex_color = hex_color.lstrip("#")
    return tuple(int(hex_color[i : i + 2], 16) / 255.0 for i in (0, 2, 4))


def rgb01_to_hex(rgb):
    return "#{:02X}{:02X}{:02X}".format(*(round(max(0.0, min(1.0, c)) * 255) for c in rgb))


def tint_family(base_hex, count):
    # Genuine same-hue tints: walk lightness toward the page background while
    # keeping hue and saturation from the department's Imprint base color.
    r, g, b = hex_to_rgb01(base_hex)
    hue, lightness, sat = rgb_to_hls(r, g, b)
    steps = max(count - 1, 1)
    return [rgb01_to_hex(hls_to_rgb(hue, lightness + (0.82 - lightness) * (i / steps), sat)) for i in range(count)]


def contrast_ink(hex_color):
    # Outer-ring tints run pale regardless of theme (data colors never flip),
    # so pick label ink from the wedge's own luminance rather than the theme
    # token — a theme-only INK_SOFT washes out against the palest tints.
    r, g, b = hex_to_rgb01(hex_color)
    luminance = 0.2126 * r + 0.7152 * g + 0.0722 * b
    return "#1A1A17" if luminance > 0.55 else "#F0EFE8"


color_palettes = {dept: tint_family(IMPRINT_PALETTE[i], len(cats)) for i, (dept, cats) in enumerate(data.items())}

# Calculate totals and angles
dept_totals = {dept: sum(cats.values()) for dept, cats in data.items()}
total = sum(dept_totals.values())
largest_dept = max(dept_totals, key=dept_totals.get)

# Ring radii (inner ring = departments, outer ring = expense categories)
inner_radius_inner, inner_radius_outer = 0.35, 0.60
outer_radius_inner, outer_radius_outer = 0.65, 0.90
emphasis_bump = 0.04  # nudges the largest department's wedge outward

# Build data for inner ring (departments)
inner_start_angle, inner_end_angle = [], []
inner_outer_radius, inner_colors = [], []
inner_labels, inner_values = [], []
inner_x, inner_y = [], []

# Build data for outer ring (categories)
outer_start_angle, outer_end_angle = [], []
outer_outer_radius, outer_colors = [], []
outer_labels, outer_values, outer_dept = [], [], []
outer_x, outer_y = [], []

current_angle = pi / 2  # start at top

for dept, categories in data.items():
    dept_total = dept_totals[dept]
    dept_angle = 2 * pi * (dept_total / total)
    is_largest = dept == largest_dept
    bump = emphasis_bump if is_largest else 0.0

    # Inner ring segment
    inner_start_angle.append(current_angle)
    inner_end_angle.append(current_angle + dept_angle)
    inner_outer_radius.append(inner_radius_outer + bump)
    inner_colors.append(color_palettes[dept][0])
    inner_labels.append(dept)
    inner_values.append(dept_total)

    # Label position for inner ring
    mid_angle = current_angle + dept_angle / 2
    label_radius = (inner_radius_outer + inner_radius_inner) / 2 + bump / 2
    inner_x.append(label_radius * np.cos(mid_angle))
    inner_y.append(label_radius * np.sin(mid_angle))

    # Outer ring segments (categories within this department)
    cat_start = current_angle
    for i, (cat, val) in enumerate(categories.items()):
        cat_angle = 2 * pi * (val / total)

        outer_start_angle.append(cat_start)
        outer_end_angle.append(cat_start + cat_angle)
        outer_outer_radius.append(outer_radius_outer + bump)
        outer_colors.append(color_palettes[dept][i % len(color_palettes[dept])])
        outer_labels.append(cat)
        outer_values.append(val)
        outer_dept.append(dept)

        # Label position for outer ring
        cat_mid_angle = cat_start + cat_angle / 2
        cat_label_radius = (outer_radius_outer + outer_radius_inner) / 2 + bump / 2
        outer_x.append(cat_label_radius * np.cos(cat_mid_angle))
        outer_y.append(cat_label_radius * np.sin(cat_mid_angle))

        cat_start += cat_angle

    current_angle += dept_angle

# Create figure (square format for donut) — canonical anyplot canvas
title_text = "donut-nested · python · bokeh · anyplot.ai"

p = figure(
    width=2400,
    height=2400,
    title=title_text,
    x_range=(-1.35, 1.35),
    y_range=(-1.35, 1.35),
    tools="",
    toolbar_location=None,
    min_border_top=90,
    min_border_bottom=40,
    min_border_left=40,
    min_border_right=40,
)

# Style the figure
p.title.text_font_size = "50pt"
p.title.text_font_style = "bold"
p.title.text_color = INK
p.title.align = "center"
p.axis.visible = False
p.grid.visible = False
p.outline_line_color = None
p.background_fill_color = PAGE_BG
p.border_fill_color = PAGE_BG

# Elevated disc behind the donut hole — lifts the center total off the page
p.annulus(x=0, y=0, inner_radius=0, outer_radius=inner_radius_inner - 0.015, fill_color=ELEVATED_BG, line_color=None)

# Inner ring (departments)
inner_source = ColumnDataSource(
    data={
        "start_angle": inner_start_angle,
        "end_angle": inner_end_angle,
        "outer_radius": inner_outer_radius,
        "color": inner_colors,
        "label": inner_labels,
        "value": inner_values,
        "x": inner_x,
        "y": inner_y,
    }
)

inner_glyph = p.annular_wedge(
    x=0,
    y=0,
    inner_radius=inner_radius_inner,
    outer_radius="outer_radius",
    start_angle="start_angle",
    end_angle="end_angle",
    color="color",
    line_color=PAGE_BG,
    line_width=4,
    source=inner_source,
)

# Outer ring (categories)
outer_source = ColumnDataSource(
    data={
        "start_angle": outer_start_angle,
        "end_angle": outer_end_angle,
        "outer_radius": outer_outer_radius,
        "color": outer_colors,
        "label": outer_labels,
        "value": outer_values,
        "dept": outer_dept,
        "x": outer_x,
        "y": outer_y,
    }
)

outer_glyph = p.annular_wedge(
    x=0,
    y=0,
    inner_radius=outer_radius_inner,
    outer_radius="outer_radius",
    start_angle="start_angle",
    end_angle="end_angle",
    color="color",
    line_color=PAGE_BG,
    line_width=3,
    source=outer_source,
)

# Hover tooltips — genuinely interactive in the saved HTML (inspect tools stay
# live without a toolbar button), naming the exact department/category + value.
p.add_tools(
    HoverTool(renderers=[inner_glyph], tooltips=[("Department", "@label"), ("Budget", "$@value{0,0}K")]),
    HoverTool(
        renderers=[outer_glyph], tooltips=[("Category", "@label"), ("Department", "@dept"), ("Budget", "$@value{0,0}K")]
    ),
)

# Labels for inner ring (departments with values) — ink picked per wedge
# color via contrast_ink(), matching the outer ring's approach, so labels
# stay readable on both the saturated and pale department wedges.
inner_label_text = [f"{lbl}\n${val}K" for lbl, val in zip(inner_labels, inner_values, strict=True)]
inner_label_ink = [contrast_ink(c) for c in inner_colors]
inner_label_source = ColumnDataSource(
    data={"x": inner_x, "y": inner_y, "text": inner_label_text, "ink": inner_label_ink}
)

inner_labels_set = LabelSet(
    x="x",
    y="y",
    text="text",
    source=inner_label_source,
    text_align="center",
    text_baseline="middle",
    text_font_size="20pt",
    text_color="ink",
    text_font_style="bold",
)
p.add_layout(inner_labels_set)

# Labels for outer ring (only for larger segments)
outer_label_text, outer_label_x, outer_label_y, outer_label_ink = [], [], [], []
for label, value, x, y, start, end, color in zip(
    outer_labels, outer_values, outer_x, outer_y, outer_start_angle, outer_end_angle, outer_colors, strict=True
):
    segment_angle = abs(end - start)
    # Only label segments larger than 0.25 radians (~14 degrees)
    if segment_angle > 0.25:
        outer_label_text.append(f"{label}\n${value}K")
        outer_label_x.append(x)
        outer_label_y.append(y)
        outer_label_ink.append(contrast_ink(color))

outer_label_source = ColumnDataSource(
    data={"x": outer_label_x, "y": outer_label_y, "text": outer_label_text, "ink": outer_label_ink}
)

outer_labels_set = LabelSet(
    x="x",
    y="y",
    text="text",
    source=outer_label_source,
    text_align="center",
    text_baseline="middle",
    text_font_size="16pt",
    text_color="ink",
)
p.add_layout(outer_labels_set)

# Compact legend for outer segments below the on-chart label threshold — the
# spec calls for "use legend for smaller ones" so no wedge is left
# unidentifiable in the static PNG.
below_threshold = [
    (label, value, dept, color)
    for label, value, dept, start, end, color in zip(
        outer_labels, outer_values, outer_dept, outer_start_angle, outer_end_angle, outer_colors, strict=True
    )
    if abs(end - start) <= 0.25
]

if below_threshold:
    legend_x, legend_row_h = -1.32, 0.09
    legend_top_y = -1.35 + legend_row_h * len(below_threshold)

    legend_swatch_source = ColumnDataSource(
        data={
            "x": [legend_x] * len(below_threshold),
            "y": [legend_top_y - i * legend_row_h for i in range(len(below_threshold))],
            "color": [color for _, _, _, color in below_threshold],
        }
    )
    p.scatter(x="x", y="y", source=legend_swatch_source, marker="square", size=16, color="color", line_color=None)

    legend_label_source = ColumnDataSource(
        data={
            "x": [legend_x + 0.04] * len(below_threshold),
            "y": [legend_top_y - i * legend_row_h for i in range(len(below_threshold))],
            "text": [f"{dept} · {label} (${value}K)" for label, value, dept, _ in below_threshold],
        }
    )
    legend_labels_set = LabelSet(
        x="x",
        y="y",
        text="text",
        source=legend_label_source,
        text_align="left",
        text_baseline="middle",
        text_font_size="16pt",
        text_color=INK,
    )
    p.add_layout(legend_labels_set)

# Center text showing the grand total
p.text(
    x=[0],
    y=[0],
    text=[f"Total\n${total}K"],
    text_align="center",
    text_baseline="middle",
    text_font_size="26pt",
    text_font_style="bold",
    text_color=INK,
)

# Save HTML output
output_file(f"plot-{THEME}.html")
save(p)

# Screenshot with headless Chrome using Selenium
W, H = 2400, 2400
opts = Options()
for arg in (
    "--headless=new",
    "--no-sandbox",
    "--disable-dev-shm-usage",
    "--disable-gpu",
    f"--window-size={W},{H}",
    "--hide-scrollbars",
):
    opts.add_argument(arg)
driver = webdriver.Chrome(options=opts)
driver.set_window_size(W, H)
driver.get(f"file://{Path(f'plot-{THEME}.html').resolve()}")
driver.execute_cdp_cmd(
    "Emulation.setDeviceMetricsOverride", {"width": W, "height": H, "deviceScaleFactor": 1, "mobile": False}
)
time.sleep(3)
driver.save_screenshot(f"plot-{THEME}.png")
driver.quit()
Runnable source as JSON, for any HTTP client: https://api.anyplot.ai/specs/donut-nested/bokeh/code. Any spec id and library id listed in llms-full.txt fit the same URL shape; every URL below is complete and callable.
{
  "spec_id": "donut-nested",
  "language": "python",
  "library": "bokeh",
  "page": "https://anyplot.ai/donut-nested/python/bokeh",
  "hub": "https://anyplot.ai/donut-nested",
  "code_json": "https://api.anyplot.ai/specs/donut-nested/bokeh/code",
  "spec_json": "https://api.anyplot.ai/specs/donut-nested",
  "render_light_png": "https://storage.googleapis.com/anyplot-images/plots/donut-nested/python/bokeh/plot-light.png",
  "render_dark_png": "https://storage.googleapis.com/anyplot-images/plots/donut-nested/python/bokeh/plot-dark.png",
  "interactive_light_html": "https://storage.googleapis.com/anyplot-images/plots/donut-nested/python/bokeh/plot-light.html",
  "interactive_dark_html": "https://storage.googleapis.com/anyplot-images/plots/donut-nested/python/bokeh/plot-dark.html",
  "quality_score": 92.0,
  "license": "MIT",
  "guide": "https://anyplot.ai/llms.txt"
}
Part of Nested Donut Chart on anyplot.ai.