The same plot in 14 other libraries — Python: Altair, Bokeh, lets-plot, Matplotlib, Plotly, plotnine, Pygal, Seaborn; R: ggplot2; JavaScript: Chart.js, D3.js, Apache ECharts, Highcharts, MUI X Charts. Compare all 15 side by side: Nested Donut Chart in Python, R, Julia and JavaScript.
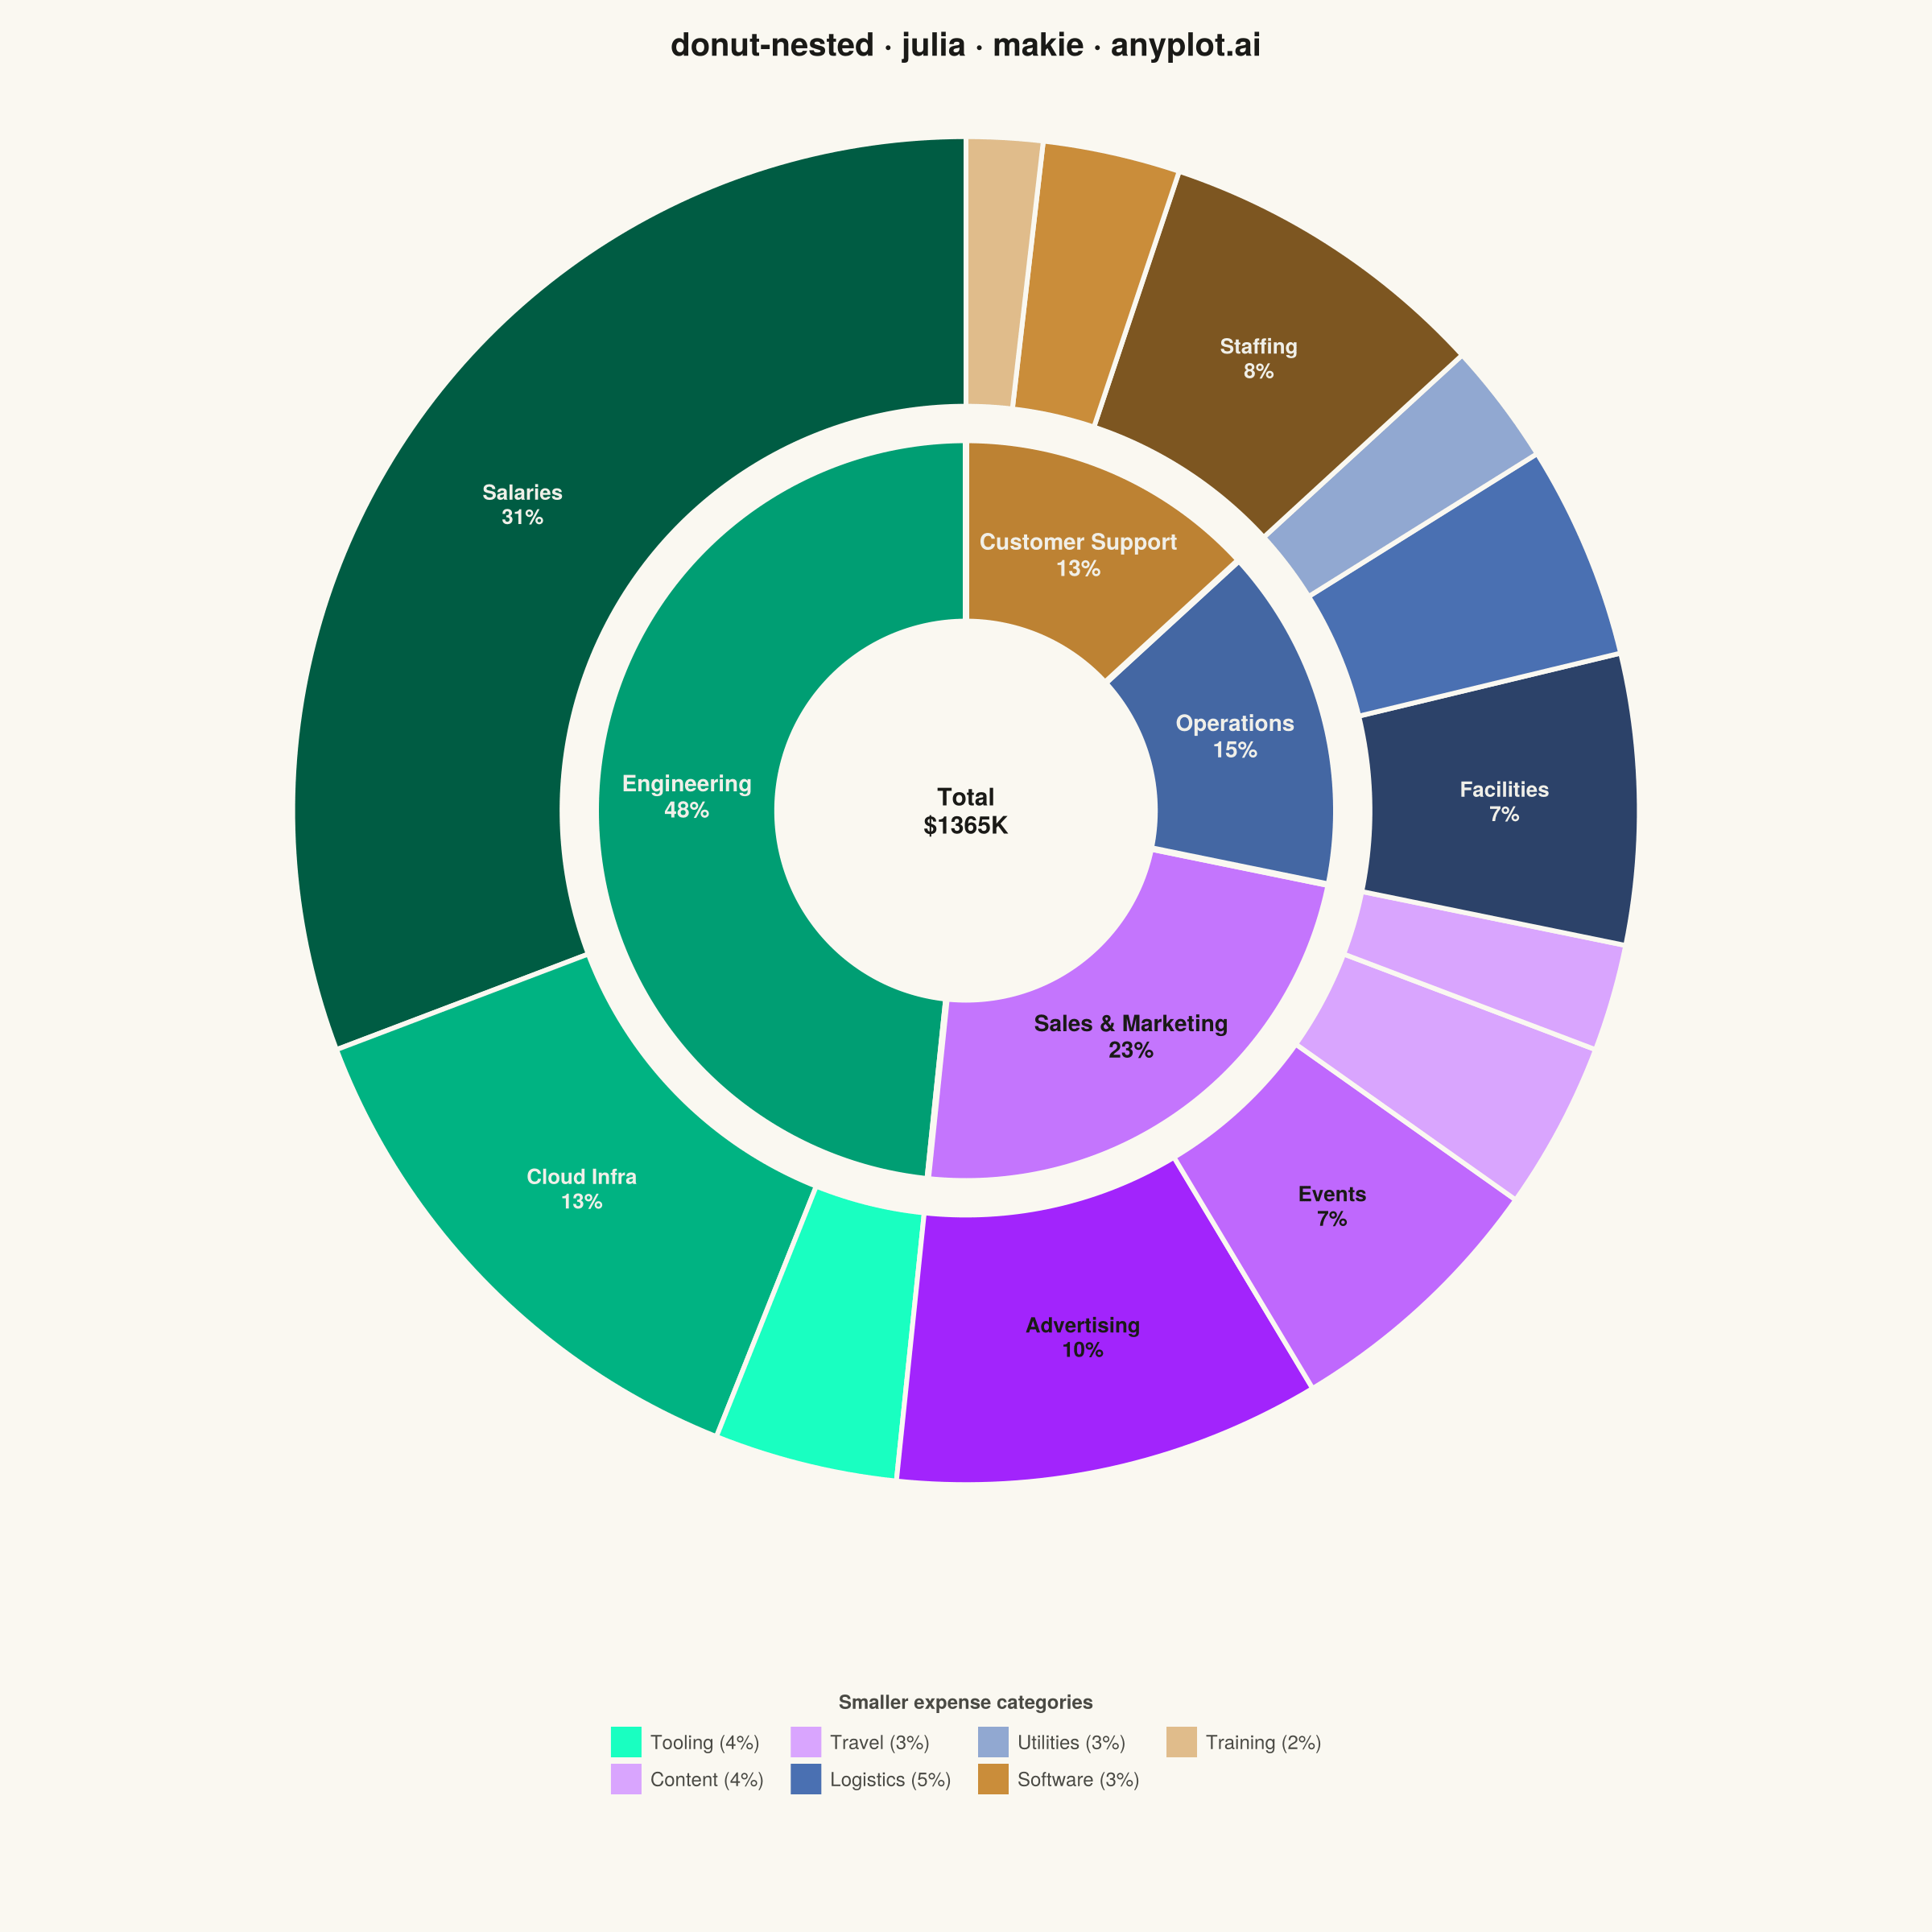
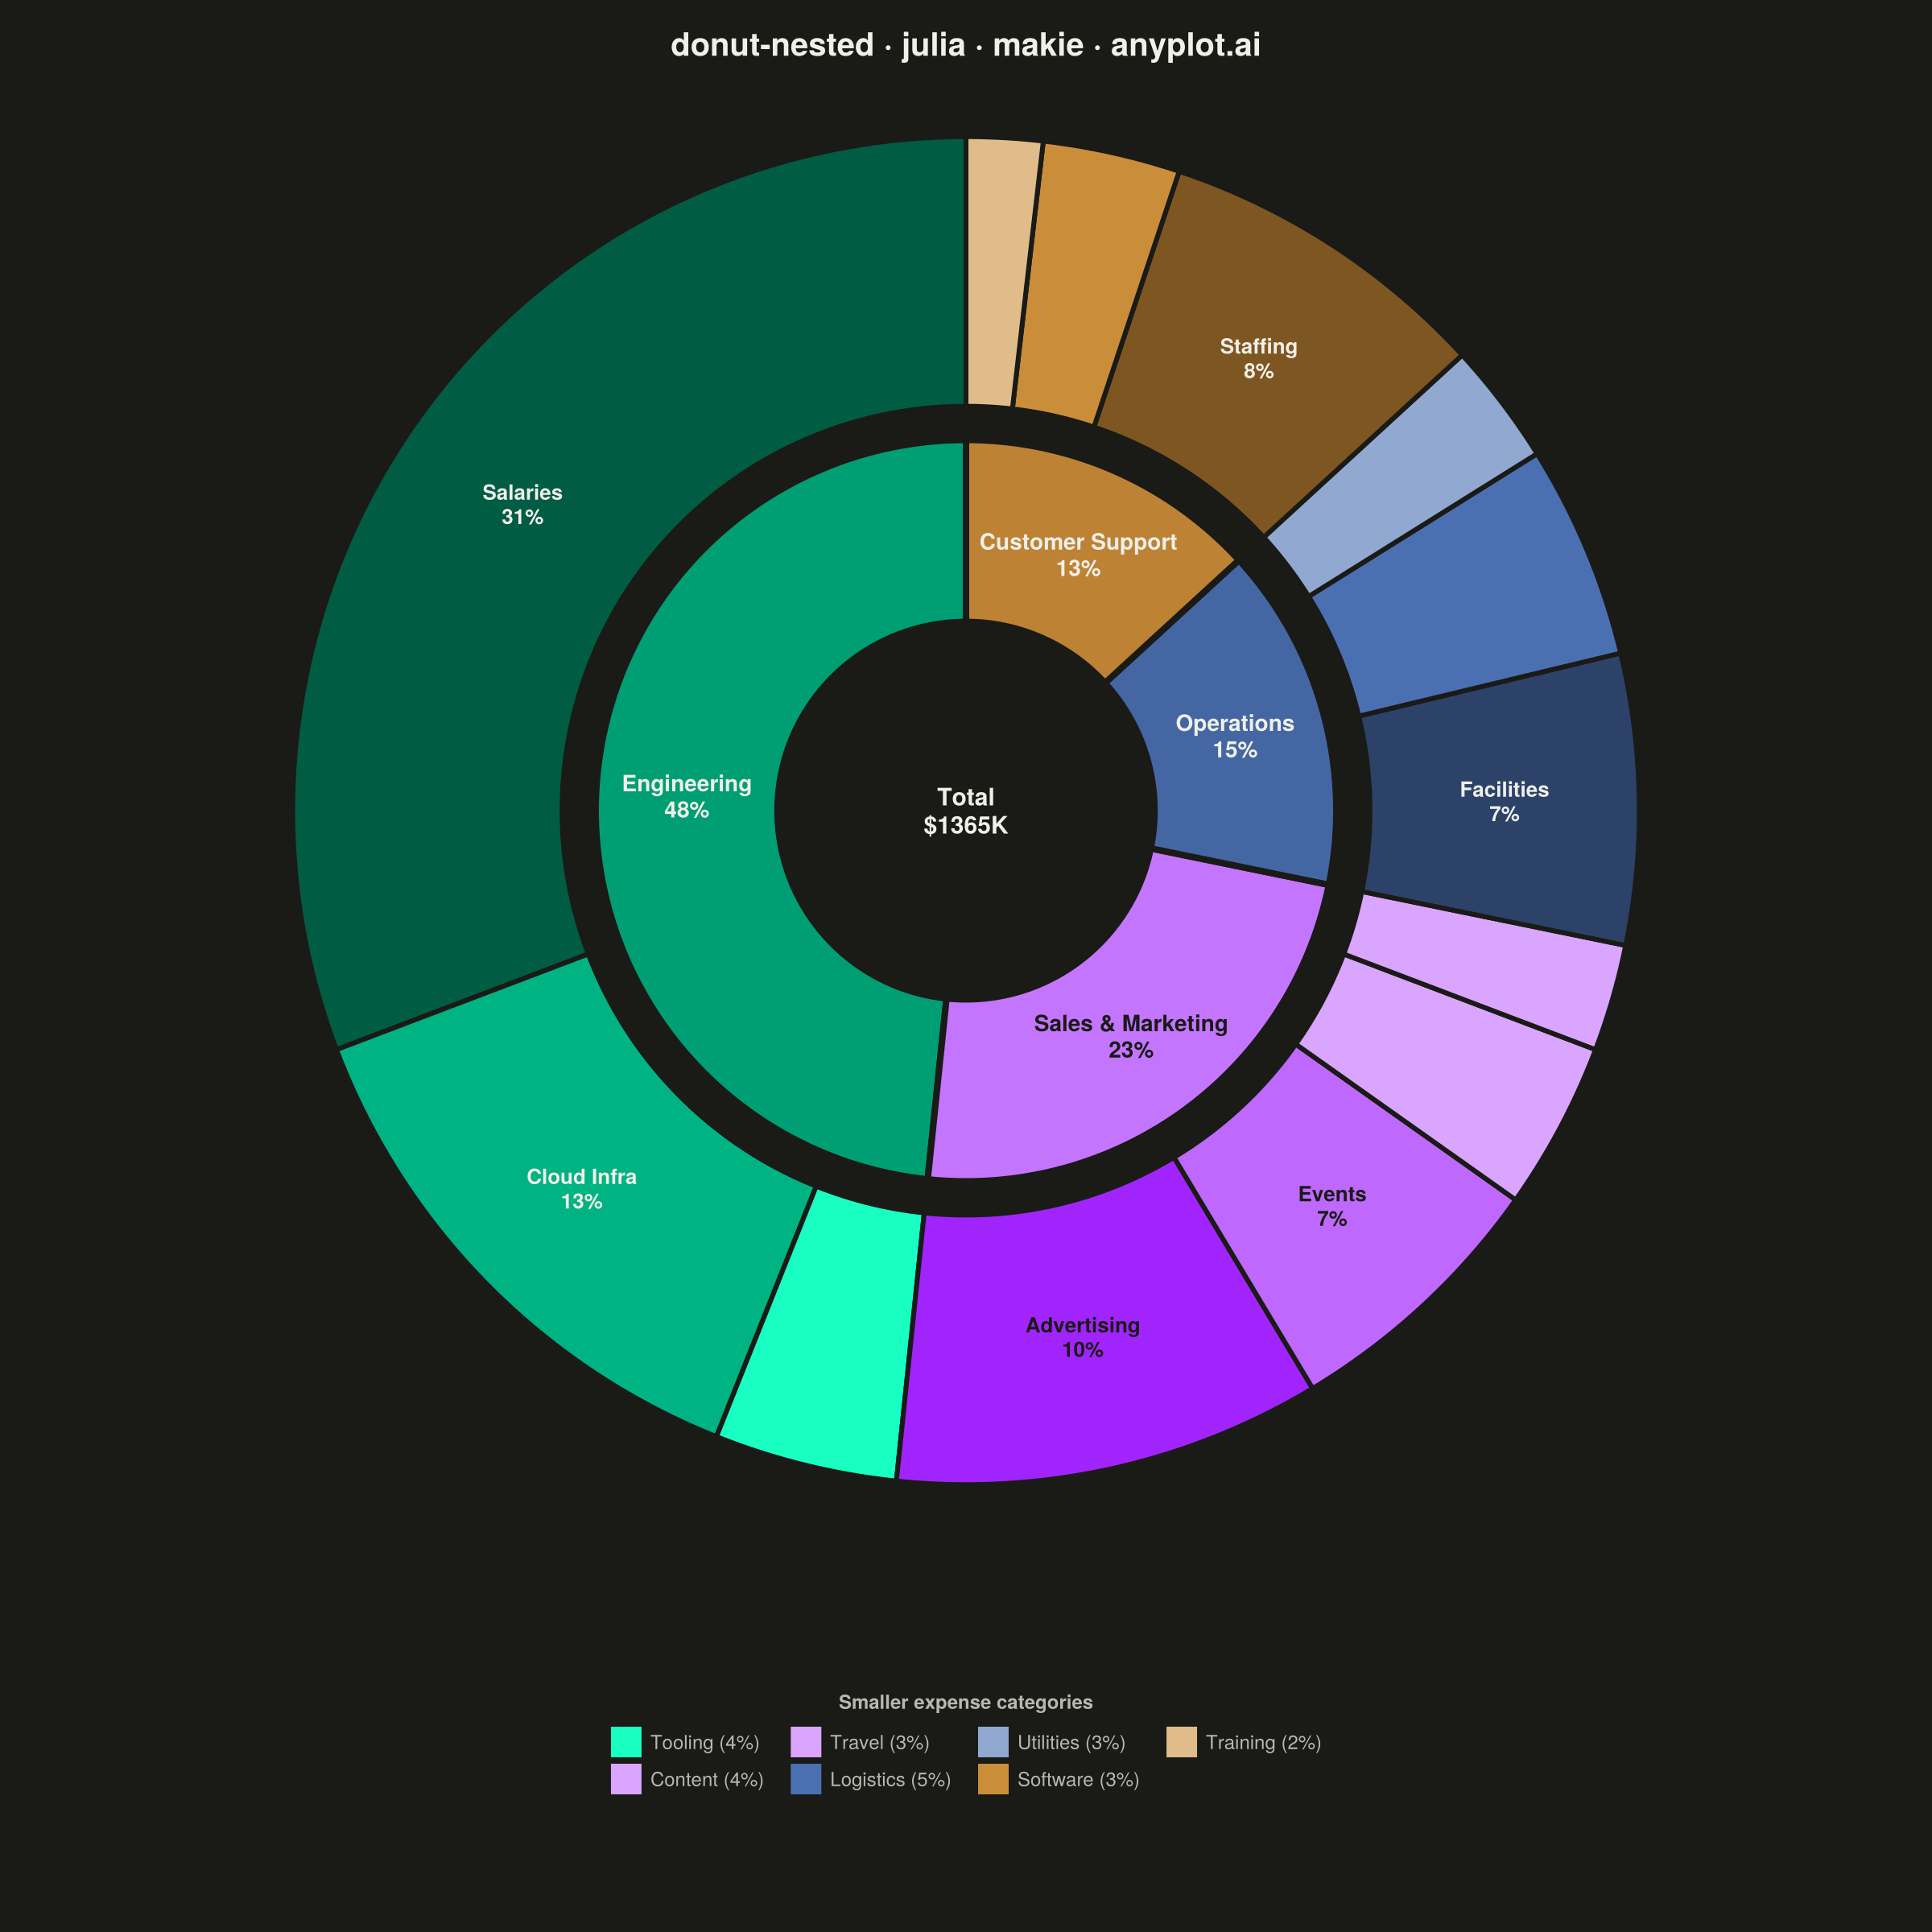
A nested donut chart displays hierarchical data as multiple concentric rings, where each ring represents a level of the hierarchy. Inner rings show parent categories while outer rings show their subdivisions. This visualization effectively reveals part-to-whole relationships across multiple levels while maintaining the familiar donut format.
# anyplot.ai
# donut-nested: Nested Donut Chart
# Library: makie 0.21.9 | Julia 1.11.9
# Quality: 95/100 | Created: 2026-08-18

using CairoMakie
using Colors
using Random

Random.seed!(42)

# --- Theme tokens -------------------------------------------------------------
THEME       = get(ENV, "ANYPLOT_THEME", "light")
PAGE_BG     = THEME == "light" ? colorant"#FAF8F1" : colorant"#1A1A17"
ELEVATED_BG = THEME == "light" ? colorant"#FFFDF6" : colorant"#242420"
INK         = THEME == "light" ? colorant"#1A1A17" : colorant"#F0EFE8"
INK_SOFT    = THEME == "light" ? colorant"#4A4A44" : colorant"#B8B7B0"

# Imprint categorical palette — one hue family per department (level_1)
IMPRINT_PALETTE = [
    colorant"#009E73",  # 1 — brand green
    colorant"#C475FD",  # 2 — lavender
    colorant"#4467A3",  # 3 — blue
    colorant"#BD8233",  # 4 — ochre
]

# --- Data -----------------------------------------------------------------
# Annual IT budget (in $ thousands): department totals (level_1, inner ring)
# broken down into expense categories (level_2, outer ring). Outer values
# aggregate up to the inner ring, per department.
departments = ["Engineering", "Sales & Marketing", "Operations", "Customer Support"]

expense_categories = [
    ["Salaries", "Cloud Infra", "Tooling"],
    ["Advertising", "Events", "Content", "Travel"],
    ["Facilities", "Logistics", "Utilities"],
    ["Staffing", "Software", "Training"],
]

expense_values = [
    [420.0, 180.0, 60.0],
    [140.0, 90.0, 55.0, 35.0],
    [95.0, 70.0, 40.0],
    [110.0, 45.0, 25.0],
]

department_totals = [sum(v) for v in expense_values]
grand_total = sum(department_totals)

# Same hue family per department, lightness spread across its children so the
# outer ring visually nests under its parent wedge.
department_hsl = [Colors.HSL(c) for c in IMPRINT_PALETTE]
child_colors = [
    [Colors.RGB(Colors.HSL(hsl.h, hsl.s, clamp(hsl.l + t, 0.18, 0.82)))
     for t in range(-0.16, 0.24; length = length(expense_values[i]))]
    for (i, hsl) in enumerate(department_hsl)
]

outer_values = reduce(vcat, expense_values)
outer_labels = reduce(vcat, expense_categories)
outer_colors = reduce(vcat, child_colors)
outer_shares = outer_values ./ grand_total

# --- Figure -----------------------------------------------------------------
fig = Figure(
    resolution      = (1200, 1200),
    fontsize        = 14,
    backgroundcolor = PAGE_BG,
)

ax = Axis(
    fig[1, 1];
    title       = "donut-nested · julia · makie · anyplot.ai",
    titlesize   = 20,
    titlecolor  = INK,
    backgroundcolor = PAGE_BG,
    aspect      = DataAspect(),
)
hidedecorations!(ax)
hidespines!(ax)

RING_START_OFFSET = pi / 2  # rotate first wedge to 12 o'clock

# Inner ring — department totals
pie!(
    ax, department_totals;
    color         = IMPRINT_PALETTE[1:length(department_totals)],
    radius        = 0.55,
    inner_radius  = 0.28,
    offset        = RING_START_OFFSET,
    strokecolor   = PAGE_BG,
    strokewidth   = 4,
)

# Outer ring — expense categories nested under each department
pie!(
    ax, outer_values;
    color         = outer_colors,
    radius        = 1.0,
    inner_radius  = 0.60,
    offset        = RING_START_OFFSET,
    strokecolor   = PAGE_BG,
    strokewidth   = 3,
)

# --- Segment mid-angles (mirrors the pie recipe's own boundary math) --------
inner_boundaries = cumsum([0.0; department_totals]) ./ grand_total .* 2pi
inner_mid_angles = [
    (inner_boundaries[i] + inner_boundaries[i + 1]) / 2 + RING_START_OFFSET
    for i in 1:length(department_totals)
]
inner_label_radius = (0.28 + 0.55) / 2
inner_label_x = [cos(a) * inner_label_radius for a in inner_mid_angles]
inner_label_y = [sin(a) * inner_label_radius for a in inner_mid_angles]

outer_boundaries = cumsum([0.0; outer_values]) ./ grand_total .* 2pi
outer_mid_angles = [
    (outer_boundaries[i] + outer_boundaries[i + 1]) / 2 + RING_START_OFFSET
    for i in 1:length(outer_values)
]
outer_label_radius = (0.60 + 1.0) / 2
outer_label_x = [cos(a) * outer_label_radius for a in outer_mid_angles]
outer_label_y = [sin(a) * outer_label_radius for a in outer_mid_angles]

# Pick dark or light text per wedge so labels stay legible whether their
# background is a pale or a deep lightness variant of the department hue.
# These are the two fixed ink anchors from the style guide (not theme-flipped
# like INK/ELEVATED_BG) — the right anchor depends on the wedge's own
# lightness, not on which theme is rendering.
LABEL_ON_LIGHT = colorant"#1A1A17"
LABEL_ON_DARK  = colorant"#F0EFE8"
inner_wedge_colors = IMPRINT_PALETTE[1:length(department_totals)]
inner_text_colors = [Colors.HSL(c).l >= 0.55 ? LABEL_ON_LIGHT : LABEL_ON_DARK for c in inner_wedge_colors]
outer_text_colors = [Colors.HSL(c).l >= 0.55 ? LABEL_ON_LIGHT : LABEL_ON_DARK for c in outer_colors]

# Direct labels on department wedges — 4 segments, all comfortably fit.
text!(
    ax, inner_label_x, inner_label_y;
    text        = [string(d, "\n", round(Int, 100 * department_totals[i] / grand_total), "%")
                    for (i, d) in enumerate(departments)],
    align       = (:center, :center),
    color       = inner_text_colors,
    fontsize    = 14,
    font        = :bold,
)

# Direct labels only on larger outer segments; smaller ones fall back to the
# legend below so text never crowds thin wedges.
LABEL_SHARE_THRESHOLD = 0.06
labeled_idx = findall(>=(LABEL_SHARE_THRESHOLD), outer_shares)
legend_idx = findall(<(LABEL_SHARE_THRESHOLD), outer_shares)

text!(
    ax, outer_label_x[labeled_idx], outer_label_y[labeled_idx];
    text        = [string(outer_labels[i], "\n", round(Int, 100 * outer_shares[i]), "%")
                    for i in labeled_idx],
    align       = (:center, :center),
    color       = outer_text_colors[labeled_idx],
    fontsize    = 13,
    font        = :bold,
)

# Center total
text!(
    ax, 0.0, 0.0;
    text        = string("Total\n\$", round(Int, grand_total), "K"),
    align       = (:center, :center),
    color       = INK,
    fontsize    = 15,
    font        = :bold,
)

# Legend for the smaller outer-ring segments (share < threshold)
legend_elems = [PolyElement(color = outer_colors[i], strokecolor = PAGE_BG, strokewidth = 1)
                for i in legend_idx]
legend_text = [string(outer_labels[i], " (", round(Int, 100 * outer_shares[i]), "%)")
               for i in legend_idx]

Legend(
    fig[2, 1], legend_elems, legend_text, "Smaller expense categories";
    orientation    = :horizontal,
    nbanks         = 2,
    framevisible   = false,
    backgroundcolor = PAGE_BG,
    labelcolor     = INK_SOFT,
    titlecolor     = INK_SOFT,
    labelsize      = 12,
    titlesize      = 12,
)

rowsize!(fig.layout, 1, Relative(0.82))
rowsize!(fig.layout, 2, Relative(0.18))

# --- Save ---------------------------------------------------------------------
save("plot-$(THEME).png", fig; px_per_unit = 2)
Runnable source as JSON, for any HTTP client: https://api.anyplot.ai/specs/donut-nested/makie/code. Any spec id and library id listed in llms-full.txt fit the same URL shape; every URL below is complete and callable.
{
  "spec_id": "donut-nested",
  "language": "julia",
  "library": "makie",
  "page": "https://anyplot.ai/donut-nested/julia/makie",
  "hub": "https://anyplot.ai/donut-nested",
  "code_json": "https://api.anyplot.ai/specs/donut-nested/makie/code",
  "spec_json": "https://api.anyplot.ai/specs/donut-nested",
  "render_light_png": "https://storage.googleapis.com/anyplot-images/plots/donut-nested/julia/makie/plot-light.png",
  "render_dark_png": "https://storage.googleapis.com/anyplot-images/plots/donut-nested/julia/makie/plot-dark.png",
  "quality_score": 95.0,
  "license": "MIT",
  "guide": "https://anyplot.ai/llms.txt"
}
Part of Nested Donut Chart on anyplot.ai.