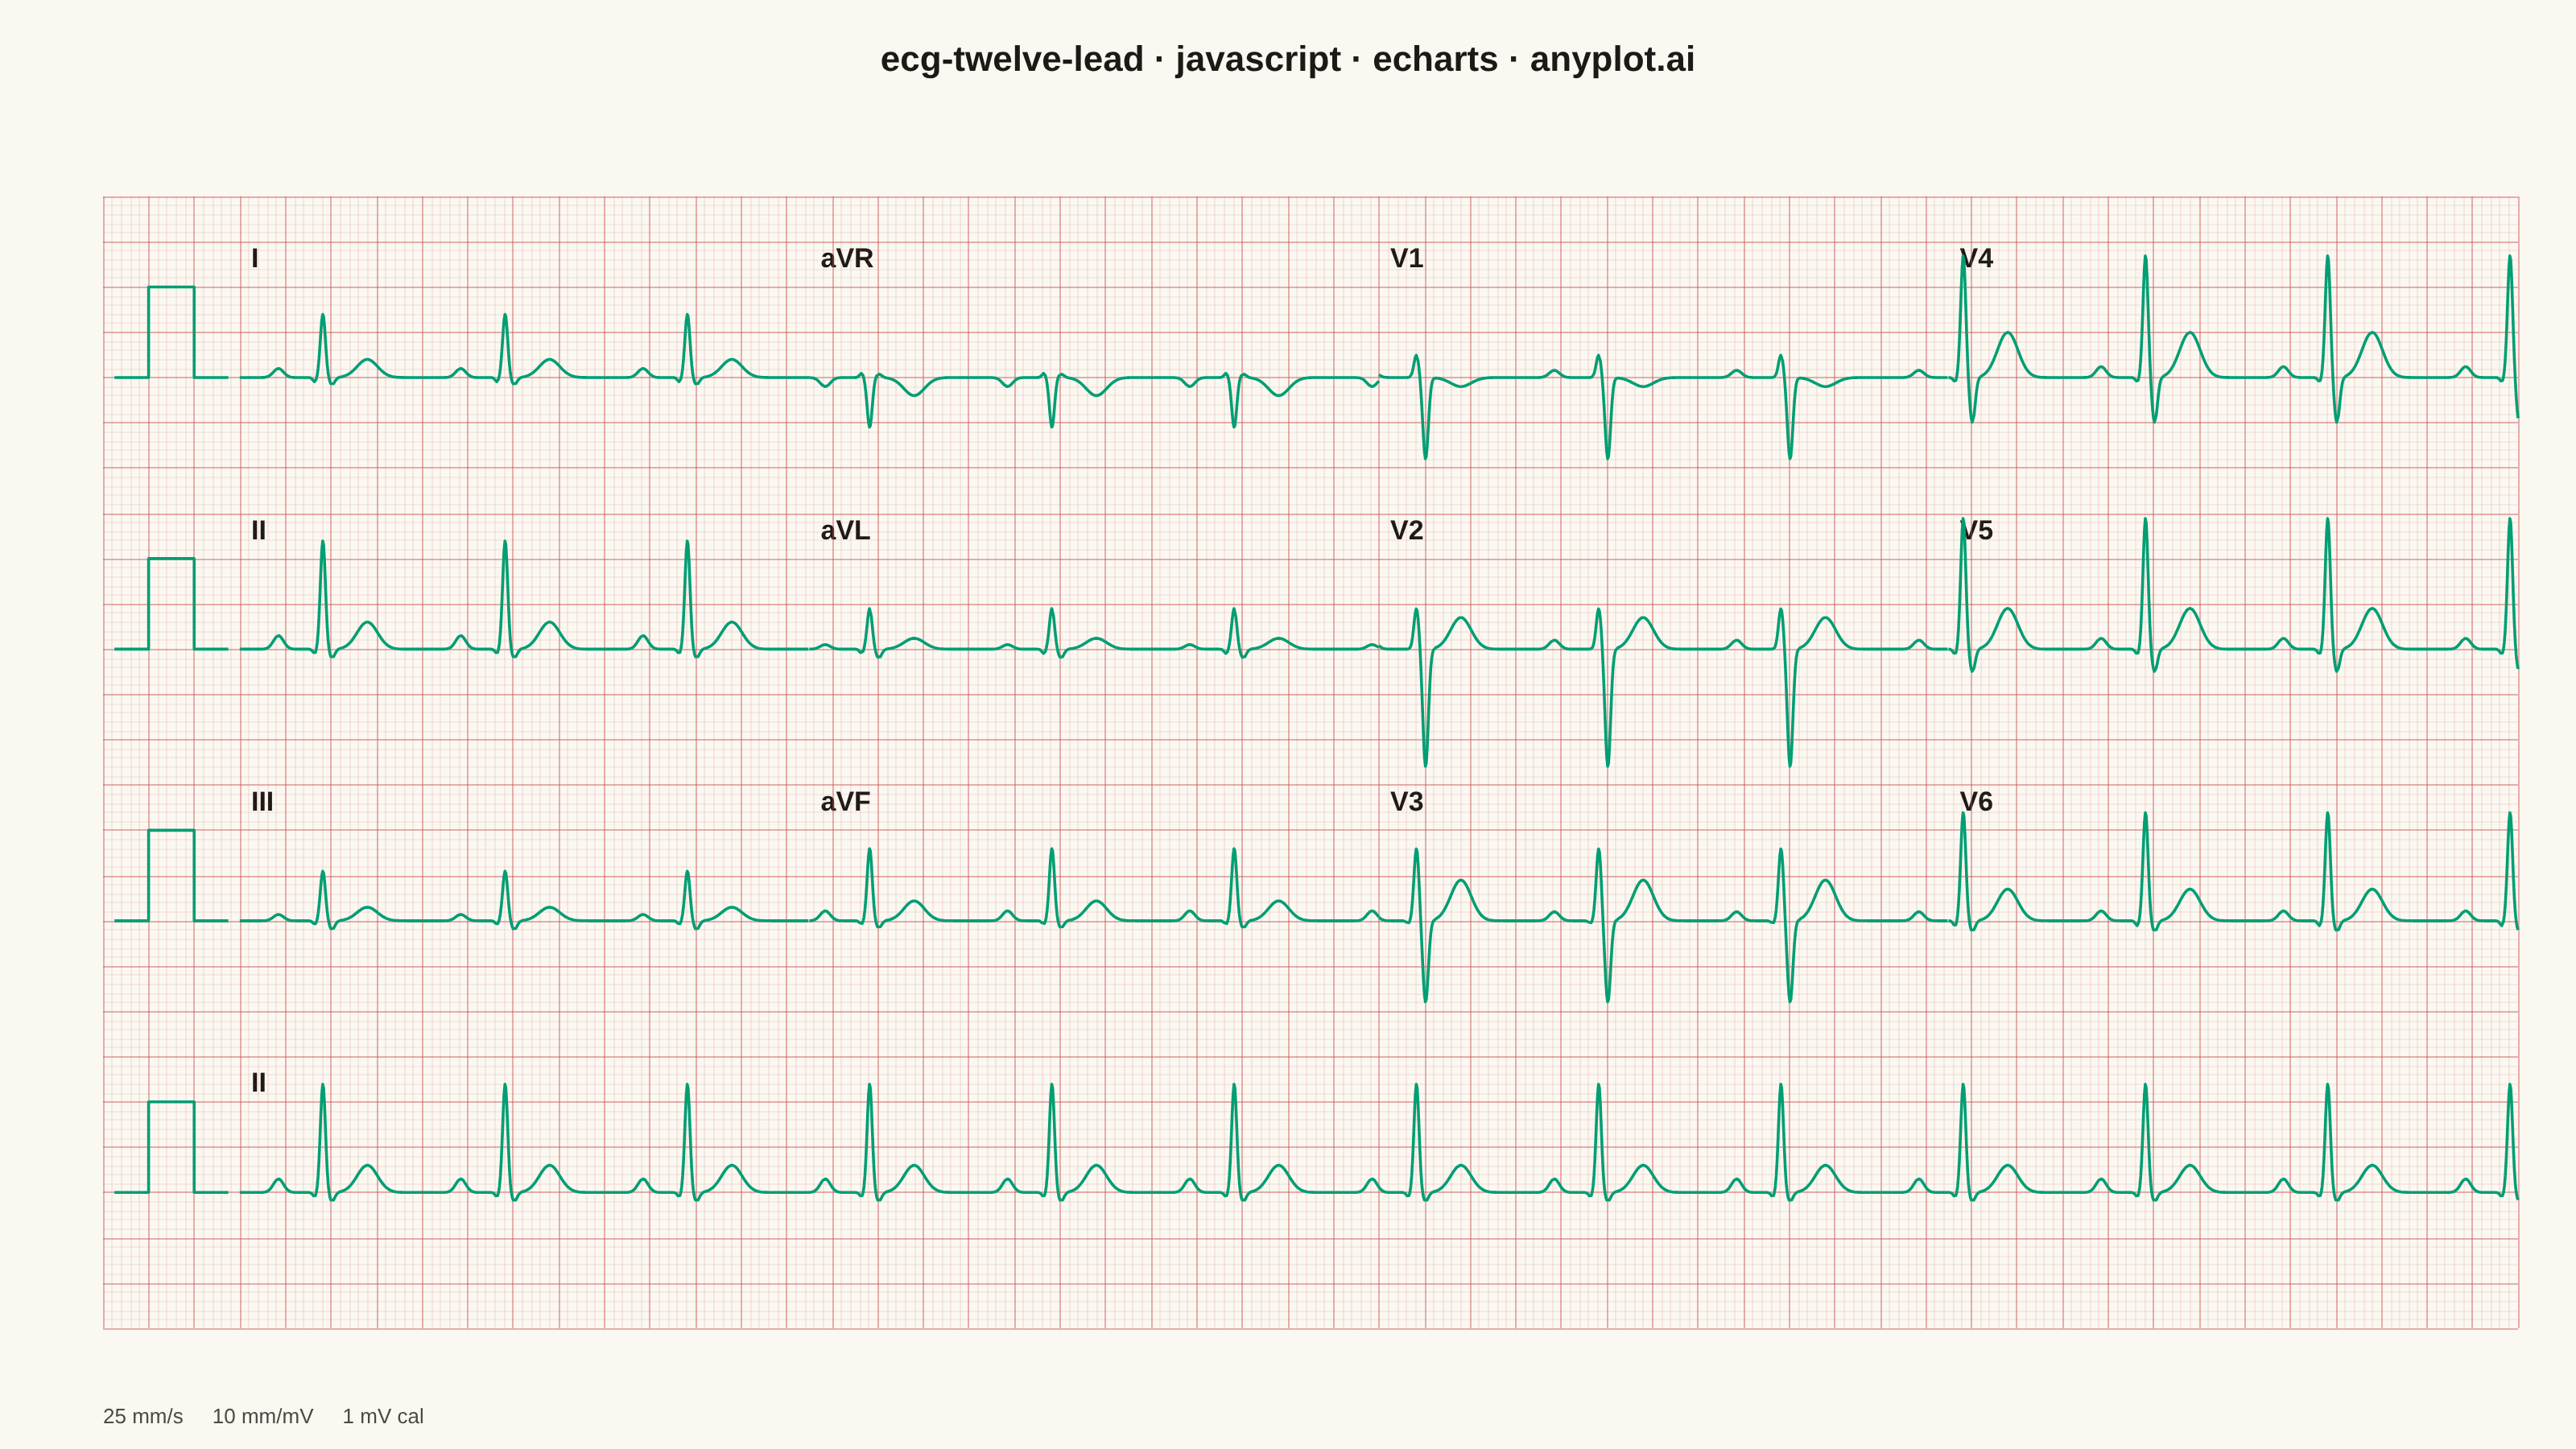
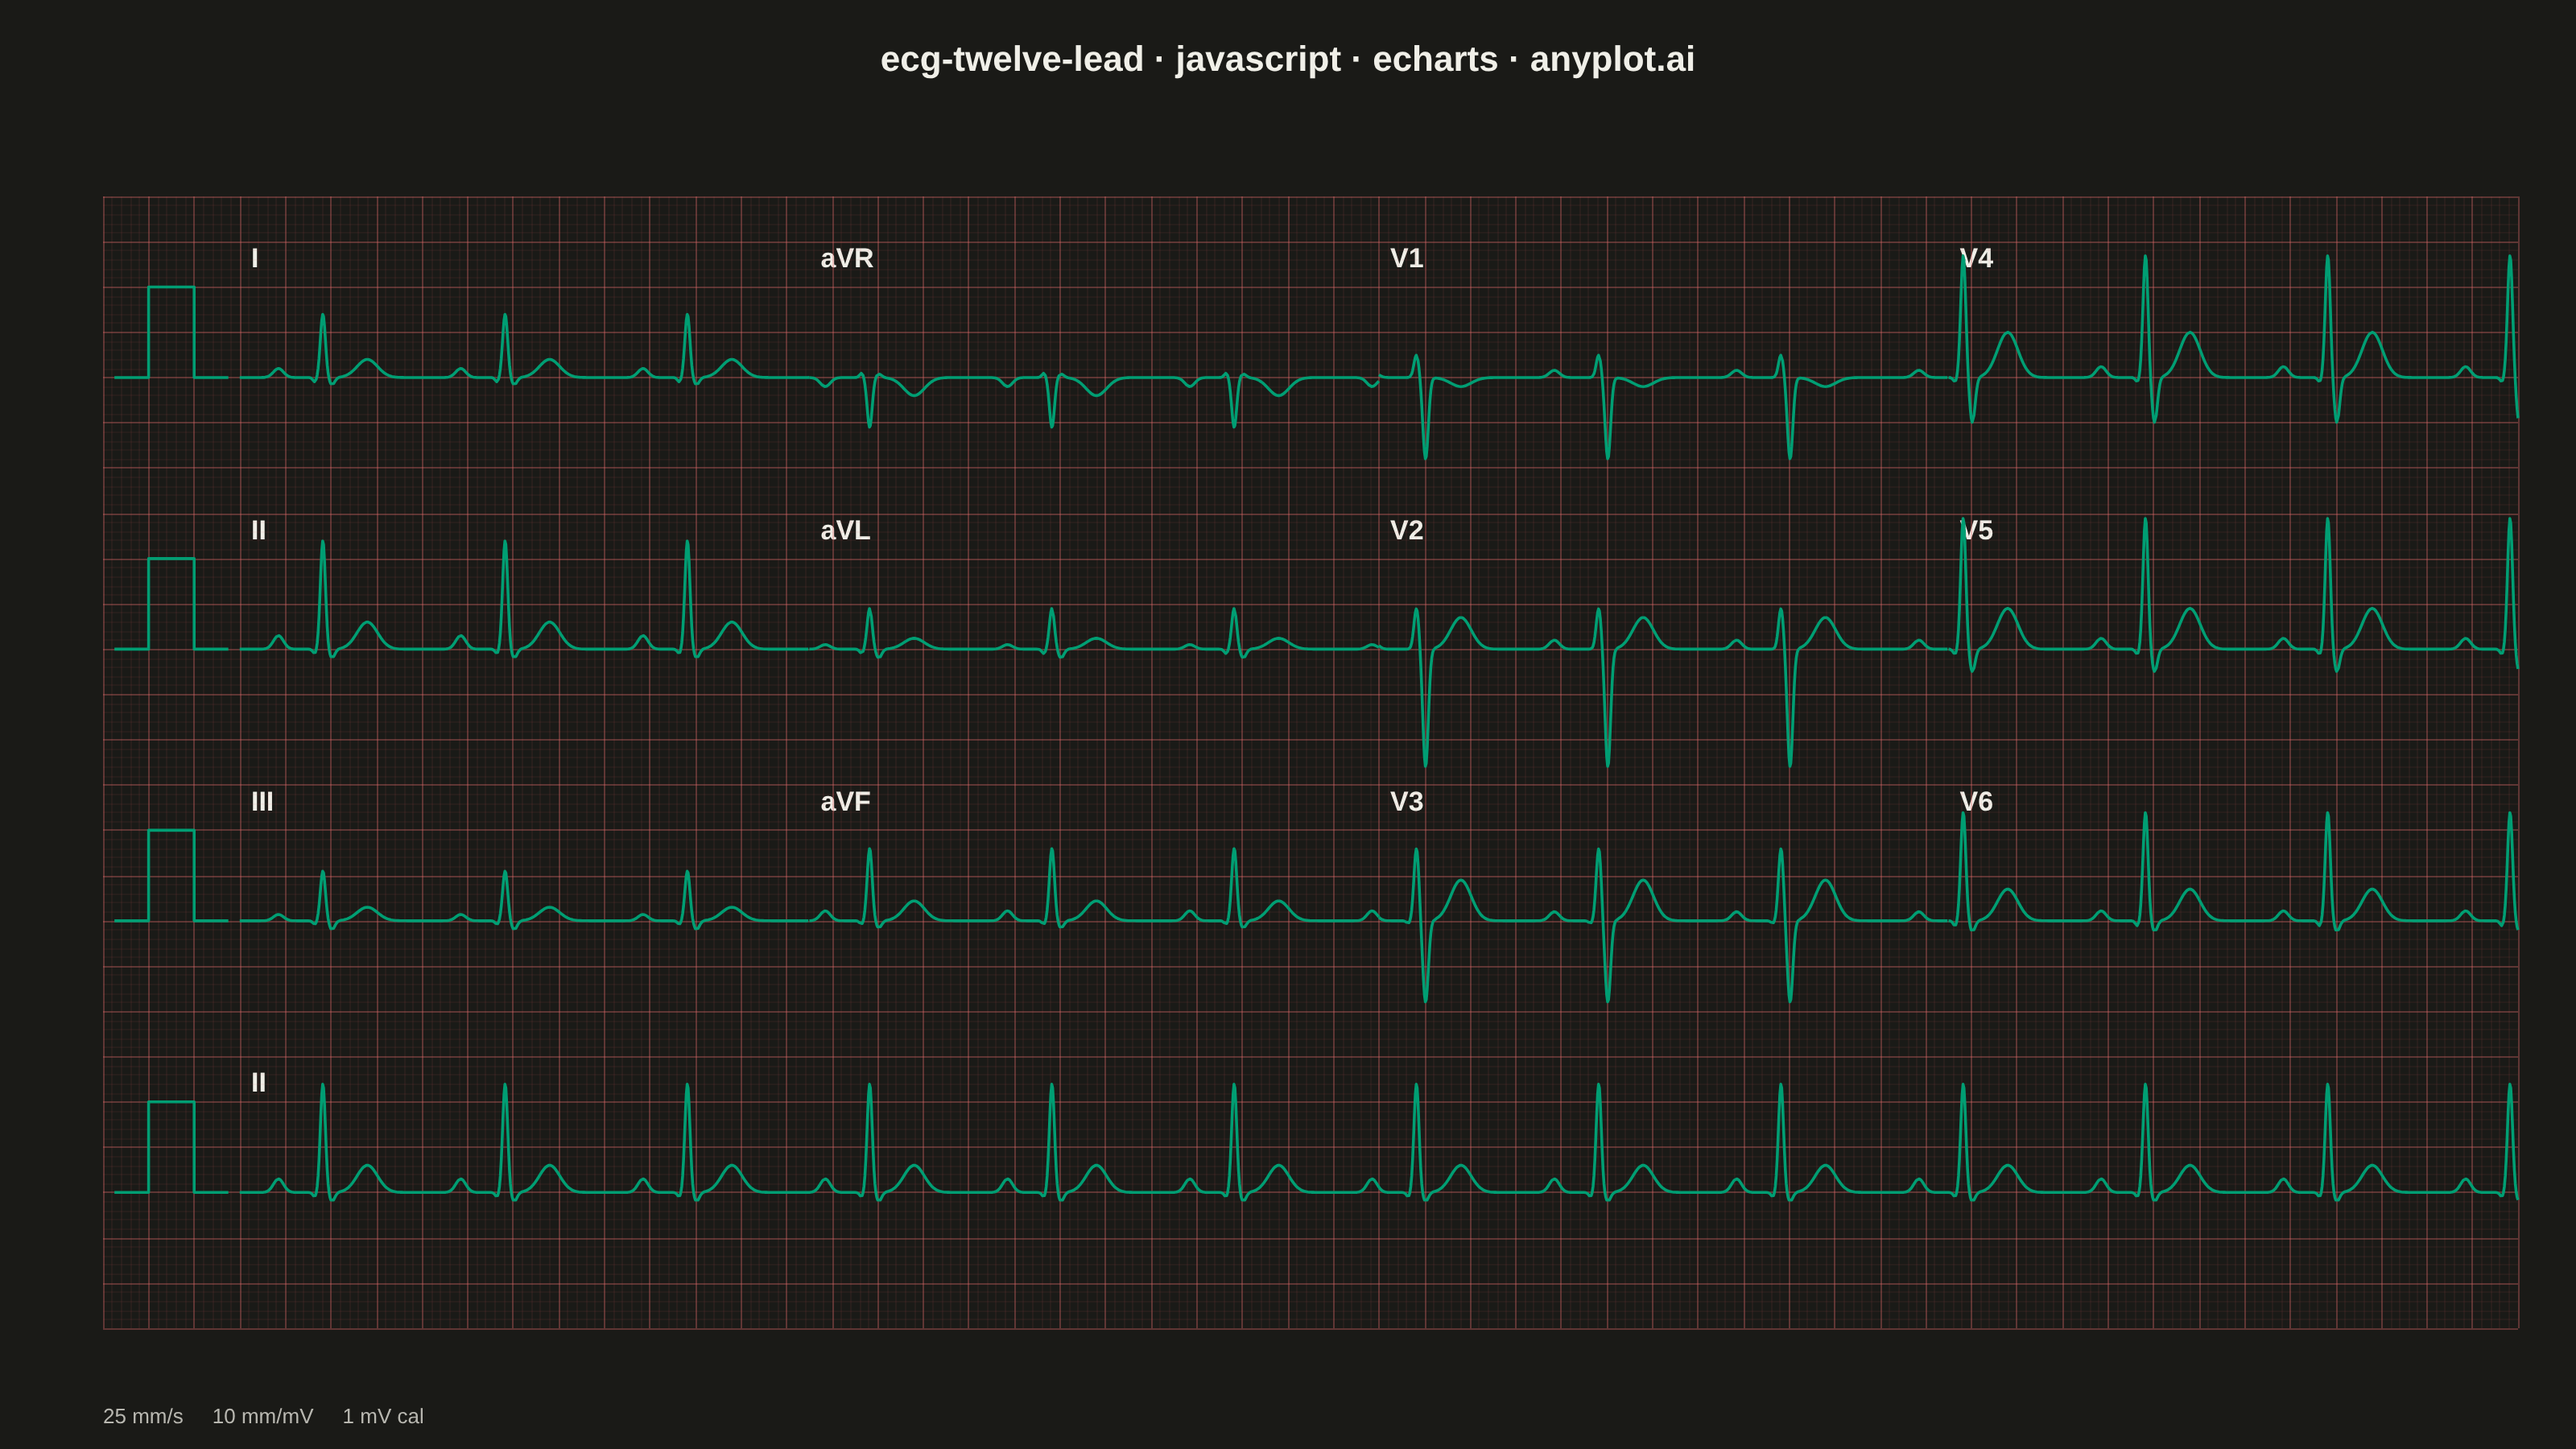
A multi-channel electrocardiogram display showing the 12 standard ECG leads arranged in clinical format. Each lead displays realistic P-QRS-T wave complexes on a medical-standard grid background with calibration markers. This visualization replicates the familiar layout used in hospitals and clinics worldwide, making it immediately recognizable to healthcare professionals and useful for medical education.
// anyplot.ai
// ecg-twelve-lead: ECG/EKG 12-Lead Waveform Display
// Library: echarts 5.5.1 | JavaScript 22.22.3
// Quality: 91/100 | Created: 2026-06-17
//# anyplot-orientation: landscape
// anyplot.ai
// ecg-twelve-lead: ECG/EKG 12-Lead Waveform Display
// Library: echarts 5.5.1 | JavaScript 22
// Quality: pending | Created: 2026-06-17

const t = window.ANYPLOT_TOKENS;
const THEME = window.ANYPLOT_THEME;
const W = window.ANYPLOT_SIZE.width;
const H = window.ANYPLOT_SIZE.height;

// --- Theme-adaptive chrome --------------------------------------------------
// The waveform trace is a single signal type repeated across all 12 leads, so it
// uses the Imprint brand green (palette[0]). The ECG paper grid keeps its
// real-world domain convention — a light red/pink ruling — derived from the
// Imprint matte-red anchor, tuned per theme for contrast on cream / near-black.
const TRACE = t.palette[0]; // #009E73 — brand green, first (and only) series colour
const MAJOR_GRID = THEME === "light" ? "rgba(199,68,68,0.42)" : "rgba(228,108,108,0.34)";
const MINOR_GRID = THEME === "light" ? "rgba(199,68,68,0.16)" : "rgba(228,108,108,0.12)";

// --- ECG paper geometry -----------------------------------------------------
// Standard scale: 25 mm/s horizontal, 10 mm/mV vertical. One big square (5 mm)
// spans 0.20 s and 0.5 mV; small squares (1 mm) subdivide it 5x. A continuous
// coordinate system carries all 12 leads + the rhythm strip so the paper ruling
// is unbroken, exactly like a printed clinical ECG.
const RR = 0.8; // 75 bpm — normal sinus rhythm
const COL_SEC = 2.5; // seconds shown per lead column (2.5 s @ 25 mm/s)
const DT = 0.004; // sampling step for the rendered trace

// Lead morphology — per-lead {P, Q, R, S, T} amplitudes in mV. Q/S are negative.
// aVR is globally inverted; precordials show R-wave progression (V1 deep rS to
// V5/V6 tall qR), the textbook normal pattern.
const PROFILES = {
  I: { p: 0.10, q: -0.05, r: 0.70, s: -0.08, t: 0.20 },
  II: { p: 0.15, q: -0.05, r: 1.20, s: -0.10, t: 0.30 },
  III: { p: 0.07, q: -0.04, r: 0.55, s: -0.10, t: 0.15 },
  aVR: { p: -0.10, q: 0.05, r: -0.55, s: 0.04, t: -0.20 },
  aVL: { p: 0.05, q: -0.05, r: 0.45, s: -0.10, t: 0.12 },
  aVF: { p: 0.11, q: -0.04, r: 0.80, s: -0.08, t: 0.22 },
  V1: { p: 0.08, q: 0.0, r: 0.25, s: -0.90, t: -0.10 },
  V2: { p: 0.10, q: 0.0, r: 0.45, s: -1.30, t: 0.35 },
  V3: { p: 0.10, q: -0.03, r: 0.80, s: -0.90, t: 0.45 },
  V4: { p: 0.12, q: -0.05, r: 1.35, s: -0.50, t: 0.50 },
  V5: { p: 0.12, q: -0.06, r: 1.45, s: -0.25, t: 0.45 },
  V6: { p: 0.11, q: -0.06, r: 1.20, s: -0.12, t: 0.35 },
};

// Standard clinical 3x4 arrangement; a full-length Lead II rhythm strip runs
// across the bottom.
const LAYOUT = [
  ["I", "aVR", "V1", "V4"],
  ["II", "aVL", "V2", "V5"],
  ["III", "aVF", "V3", "V6"],
];
const ROW_BASELINE = [9, 6, 3]; // mV offset for each grid row
const RHYTHM_BASELINE = 0; // mV offset for the bottom rhythm strip

// One P-QRS-T complex modelled as a sum of Gaussians (tt = seconds into a beat).
const gauss = (x, c, w) => Math.exp(-((x - c) * (x - c)) / (2 * w * w));
function ecgBeat(tt, prof) {
  return (
    prof.p * gauss(tt, 0.17, 0.022) +
    prof.q * gauss(tt, 0.330, 0.0085) +
    prof.r * gauss(tt, 0.365, 0.011) +
    prof.s * gauss(tt, 0.405, 0.012) +
    prof.t * gauss(tt, 0.560, 0.045)
  );
}

// Sample one lead over a time window. All 12 leads are recorded simultaneously,
// so the four columns are consecutive slices of the same run — phase is
// continuous left-to-right (globalTime), which is how printed ECGs read.
function leadTrace(prof, globalStart, durationSec, baseline) {
  const pts = [];
  const n = Math.round(durationSec / DT);
  for (let i = 0; i <= n; i++) {
    const lt = i * DT;
    const gt = globalStart + lt;
    pts.push([gt, baseline + ecgBeat(gt % RR, prof)]);
  }
  return pts;
}

// 1 mV / 0.2 s rectangular calibration pulse drawn in the left margin of a row.
function calPulse(baseline) {
  return [
    [-0.55, baseline],
    [-0.40, baseline],
    [-0.40, baseline + 1],
    [-0.20, baseline + 1],
    [-0.20, baseline],
    [-0.05, baseline],
  ];
}

// --- Build series -----------------------------------------------------------
const lineDefaults = {
  type: "line",
  showSymbol: false,
  smooth: false,
  clip: true,
  silent: true,
  z: 5,
  lineStyle: { color: TRACE, width: 1.8, join: "round" },
};

const series = [];
LAYOUT.forEach((rowLeads, r) => {
  rowLeads.forEach((name, c) => {
    series.push({
      ...lineDefaults,
      data: leadTrace(PROFILES[name], c * COL_SEC, COL_SEC, ROW_BASELINE[r]),
    });
  });
  series.push({ ...lineDefaults, data: calPulse(ROW_BASELINE[r]) });
});
// Full-length Lead II rhythm strip across the bottom (all four columns wide).
series.push({
  ...lineDefaults,
  data: leadTrace(PROFILES["II"], 0, COL_SEC * 4, RHYTHM_BASELINE),
});
series.push({ ...lineDefaults, data: calPulse(RHYTHM_BASELINE) });

// --- Coordinate window + pixel mapping for lead labels ----------------------
const GL = 64, GR = 36, GT = 122, GB = 75; // grid margins (CSS px)
const X0 = -0.6, X1 = 10.0; // seconds (4 columns x 2.5 s, plus cal margin)
const Y0 = -1.5, Y1 = 11.0; // mV
const gW = W - GL - GR;
const gH = H - GT - GB;
const px = (x) => GL + ((x - X0) / (X1 - X0)) * gW;
const py = (y) => GT + ((Y1 - y) / (Y1 - Y0)) * gH;

const graphic = [];
LAYOUT.forEach((rowLeads, r) => {
  rowLeads.forEach((name, c) => {
    graphic.push({
      type: "text",
      left: px(c * COL_SEC + 0.05),
      top: py(ROW_BASELINE[r] + 1.45),
      style: { text: name, fill: t.ink, font: "bold 17px sans-serif" },
    });
  });
});
graphic.push({
  type: "text",
  left: px(0.05),
  top: py(RHYTHM_BASELINE + 1.35),
  style: { text: "II", fill: t.ink, font: "bold 17px sans-serif" },
});
// Standard paper-scale annotation, bottom-left.
graphic.push({
  type: "text",
  left: GL,
  top: H - 26,
  style: {
    text: "25 mm/s     10 mm/mV     1 mV cal",
    fill: t.inkSoft,
    font: "13px sans-serif",
  },
});

// --- Axis (ECG paper ruling) ------------------------------------------------
const ecgAxis = (min, max, interval) => ({
  type: "value",
  min,
  max,
  interval,
  axisLabel: { show: false },
  axisLine: { show: false },
  axisTick: { show: false },
  splitLine: { show: true, lineStyle: { color: MAJOR_GRID, width: 1 } },
  minorTick: { show: false, splitNumber: 5 },
  minorSplitLine: { show: true, lineStyle: { color: MINOR_GRID, width: 0.6 } },
});

// --- Init + render ----------------------------------------------------------
const chart = echarts.init(document.getElementById("container"));
chart.setOption({
  animation: false,
  backgroundColor: t.pageBg,
  title: {
    text: "ecg-twelve-lead · javascript · echarts · anyplot.ai",
    left: "center",
    top: 22,
    textStyle: { color: t.ink, fontSize: 22, fontWeight: 600 },
  },
  grid: { left: GL, right: GR, top: GT, bottom: GB, containLabel: false },
  xAxis: ecgAxis(X0, X1, 0.2),
  yAxis: ecgAxis(Y0, Y1, 0.5),
  graphic,
  series,
});

chart.on("finished", () => {
  window.__anyplotReady = true;
});
Runnable source as JSON, for any HTTP client: https://api.anyplot.ai/specs/ecg-twelve-lead/echarts/code. Any spec id and library id listed in llms-full.txt fit the same URL shape; every URL below is complete and callable.
{
  "spec_id": "ecg-twelve-lead",
  "language": "javascript",
  "library": "echarts",
  "page": "https://anyplot.ai/ecg-twelve-lead/javascript/echarts",
  "hub": "https://anyplot.ai/ecg-twelve-lead",
  "code_json": "https://api.anyplot.ai/specs/ecg-twelve-lead/echarts/code",
  "spec_json": "https://api.anyplot.ai/specs/ecg-twelve-lead",
  "render_light_png": "https://storage.googleapis.com/anyplot-images/plots/ecg-twelve-lead/javascript/echarts/plot-light.png",
  "render_dark_png": "https://storage.googleapis.com/anyplot-images/plots/ecg-twelve-lead/javascript/echarts/plot-dark.png",
  "interactive_light_html": "https://storage.googleapis.com/anyplot-images/plots/ecg-twelve-lead/javascript/echarts/plot-light.html",
  "interactive_dark_html": "https://storage.googleapis.com/anyplot-images/plots/ecg-twelve-lead/javascript/echarts/plot-dark.html",
  "quality_score": 91.0,
  "license": "MIT",
  "guide": "https://anyplot.ai/llms.txt"
}
Part of ECG/EKG 12-Lead Waveform Display on anyplot.ai.