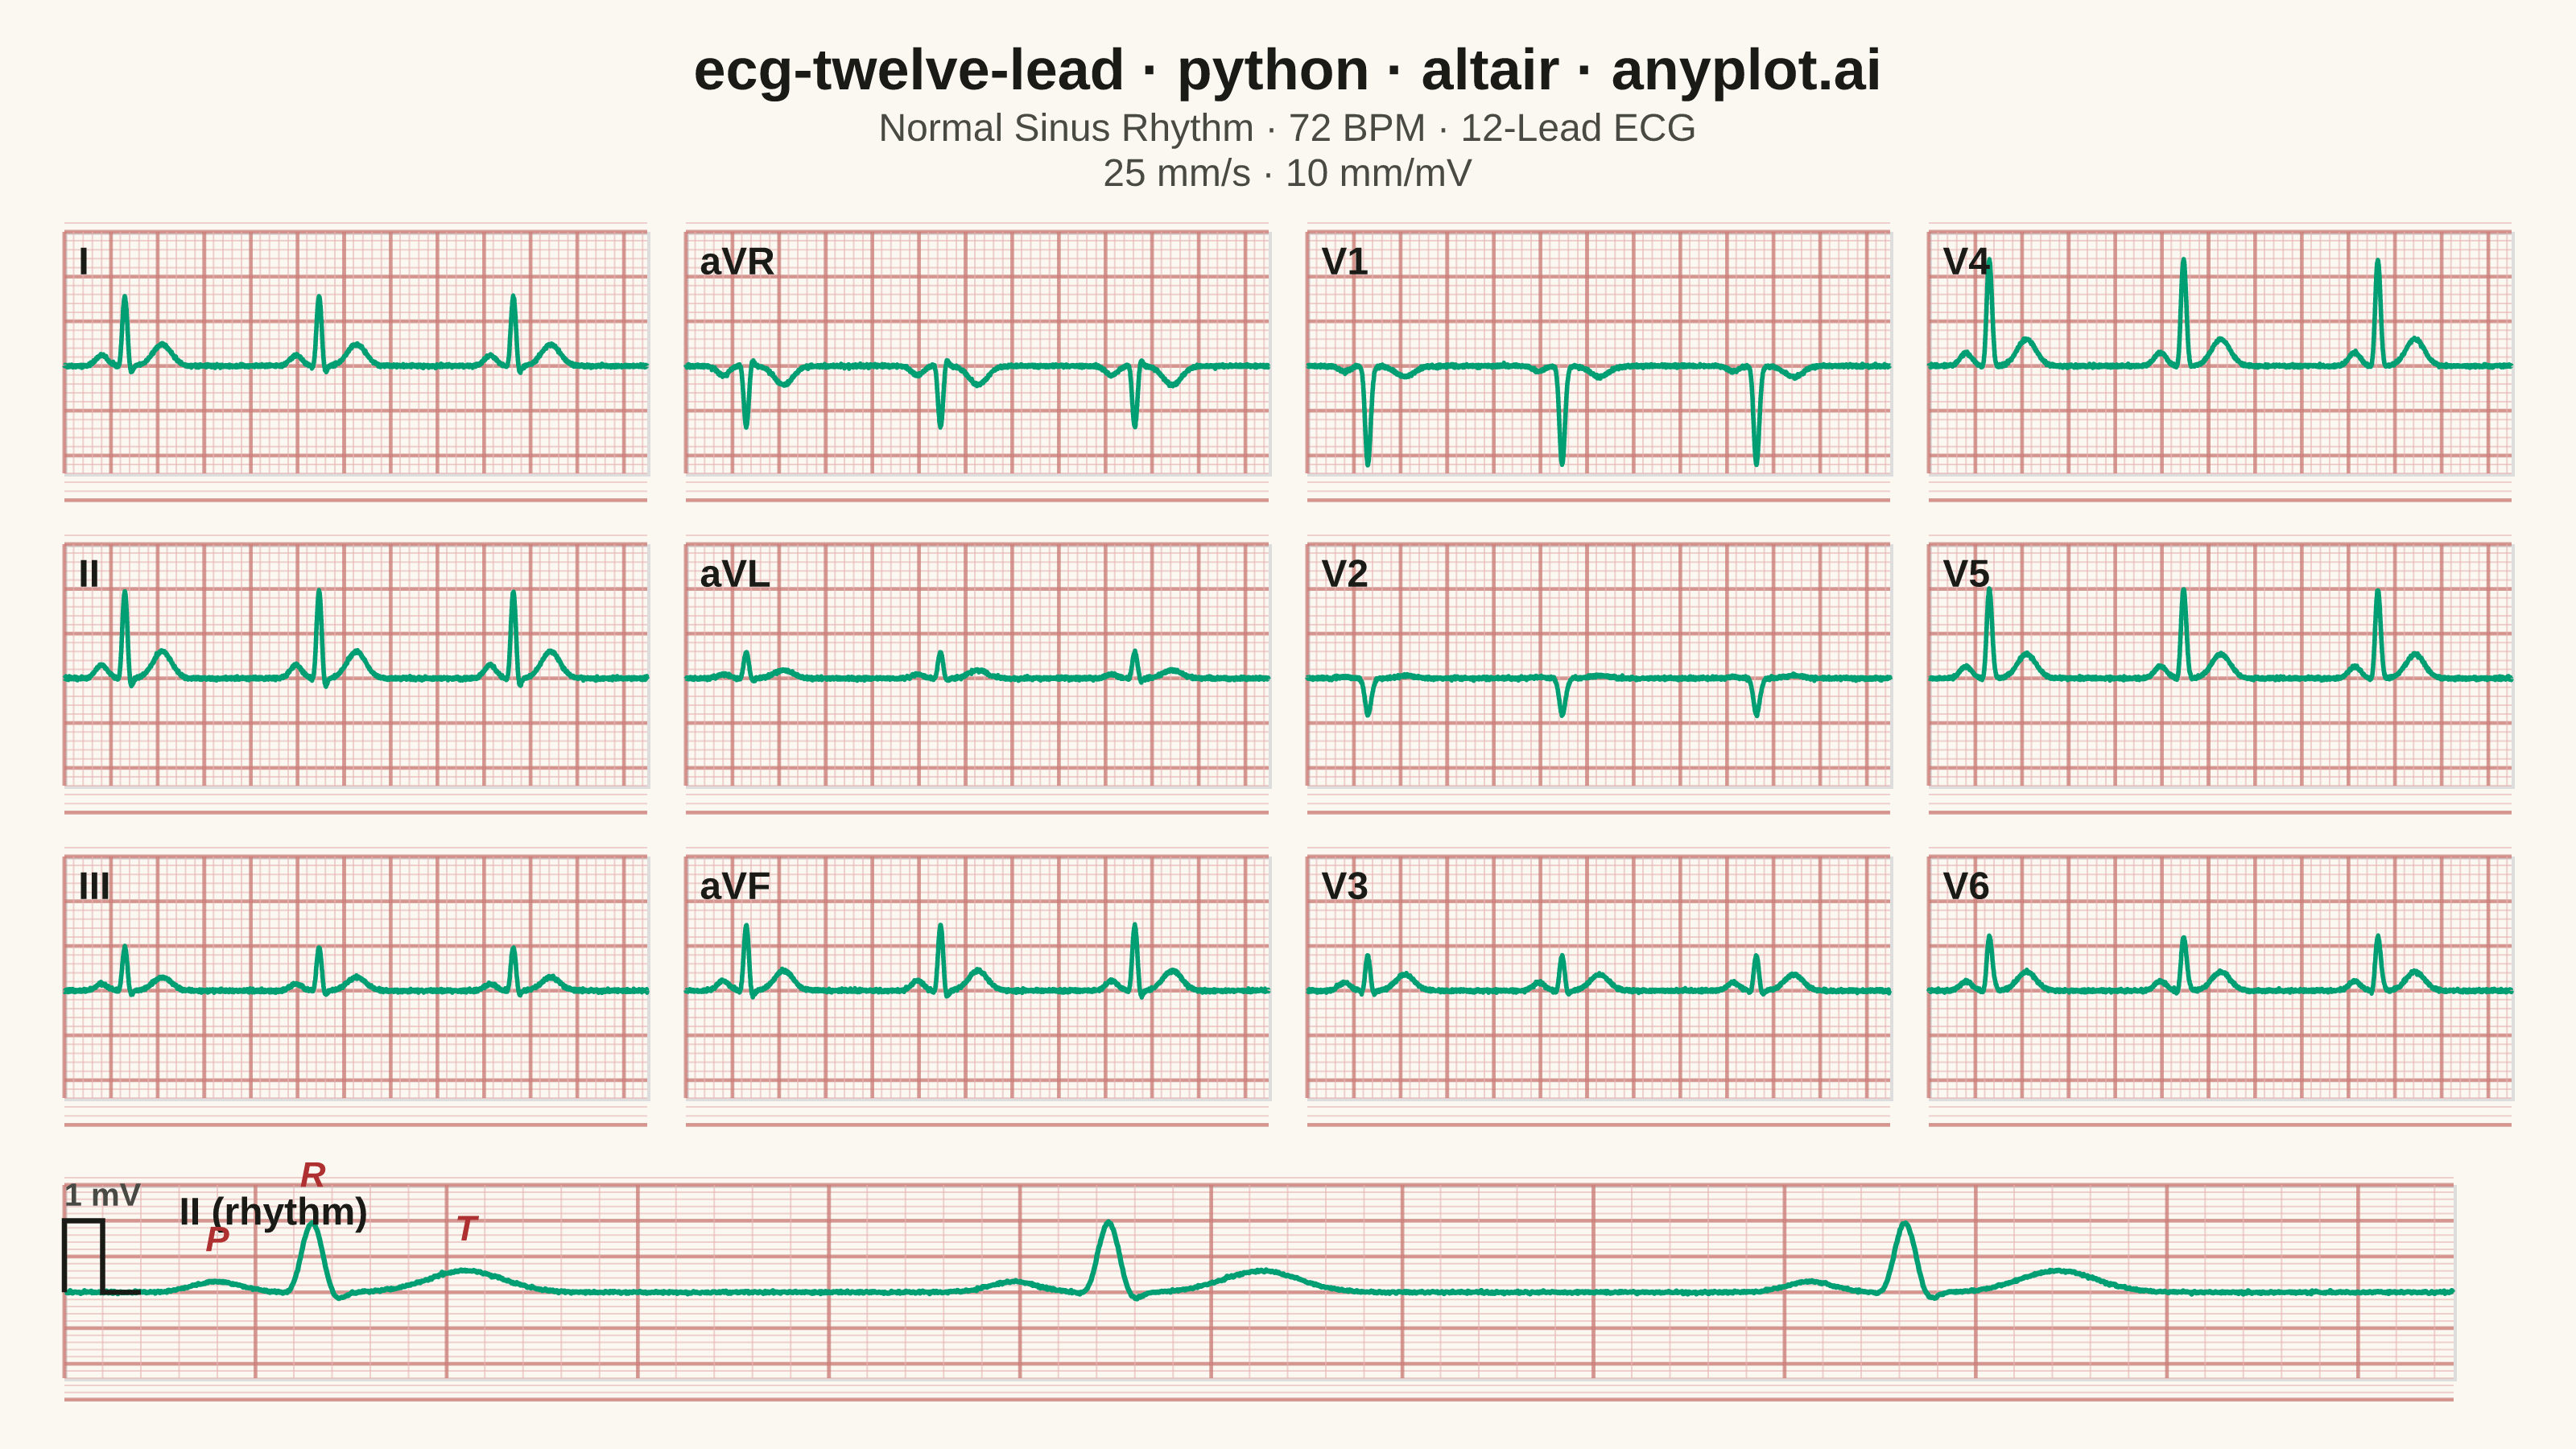
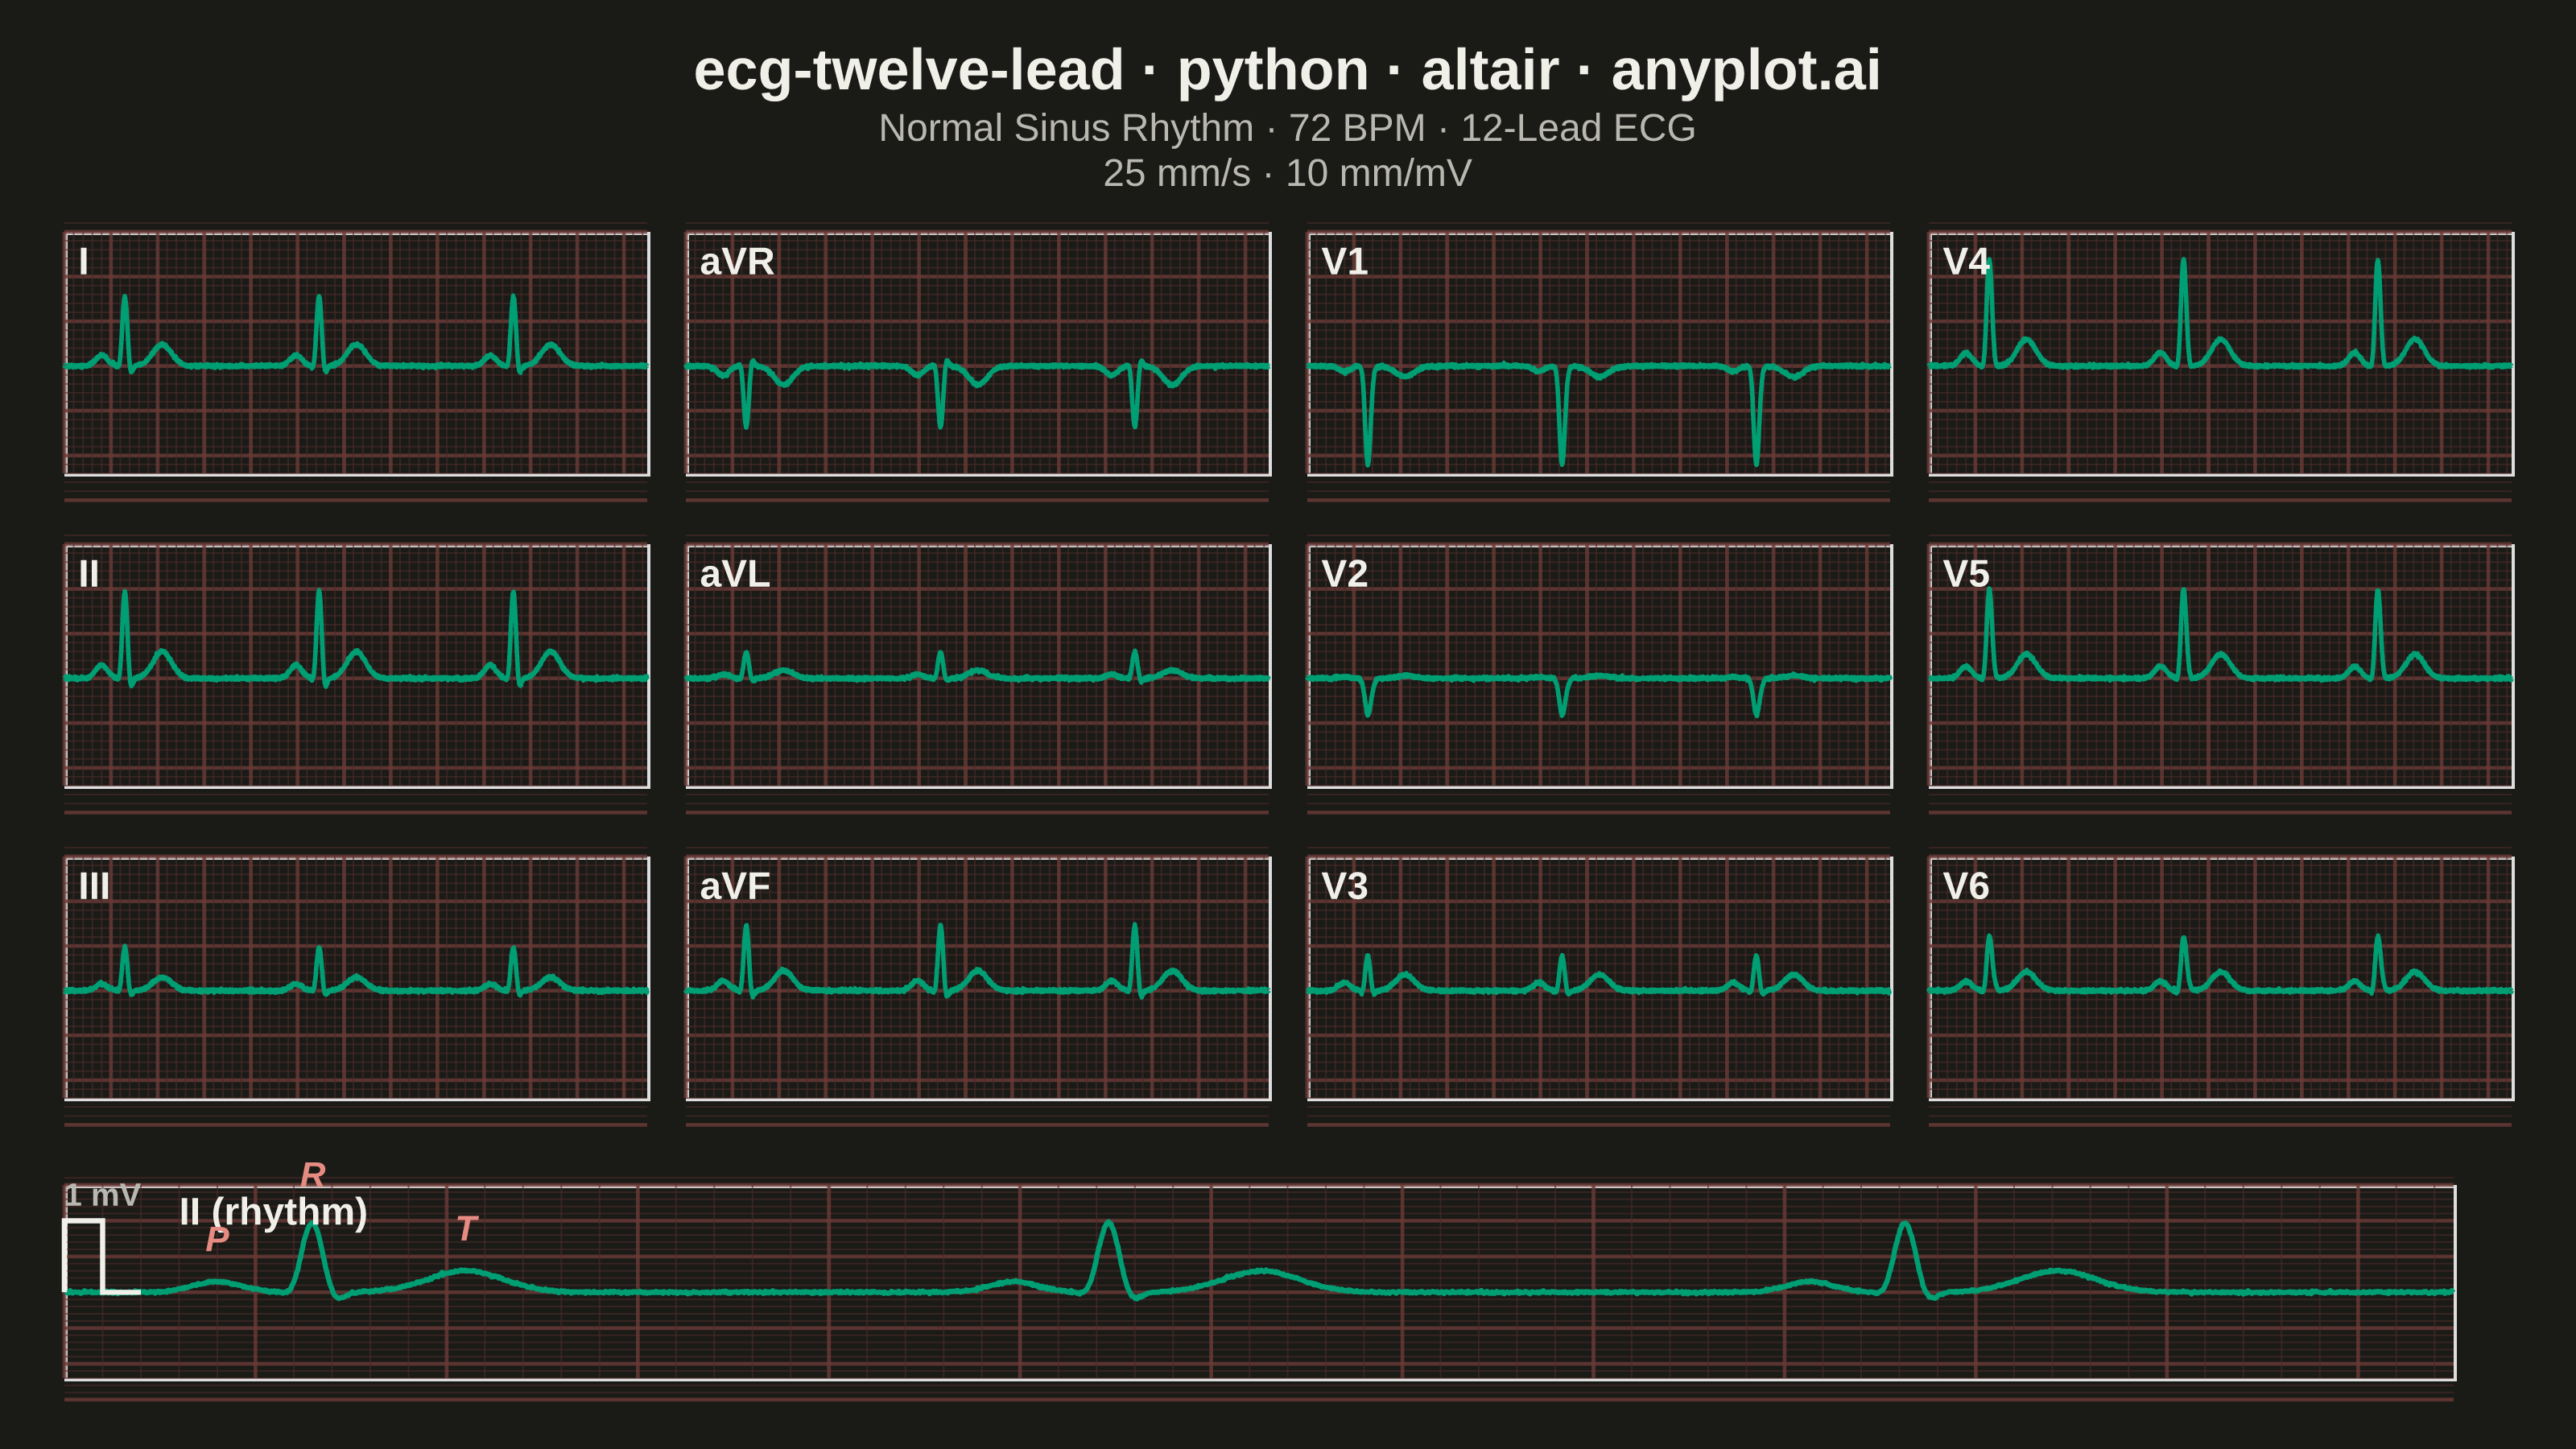
A multi-channel electrocardiogram display showing the 12 standard ECG leads arranged in clinical format. Each lead displays realistic P-QRS-T wave complexes on a medical-standard grid background with calibration markers. This visualization replicates the familiar layout used in hospitals and clinics worldwide, making it immediately recognizable to healthcare professionals and useful for medical education.
""" anyplot.ai
ecg-twelve-lead: ECG/EKG 12-Lead Waveform Display
Library: altair 6.2.1 | Python 3.13.13
Quality: 94/100 | Updated: 2026-06-17
"""

import os

import altair as alt
import numpy as np
import pandas as pd
from PIL import Image


# Theme tokens (see prompts/default-style-guide.md "Theme-adaptive Chrome")
THEME = os.getenv("ANYPLOT_THEME", "light")
PAGE_BG = "#FAF8F1" if THEME == "light" else "#1A1A17"
INK = "#1A1A17" if THEME == "light" else "#F0EFE8"
INK_SOFT = "#4A4A44" if THEME == "light" else "#B8B7B0"
BRAND = "#009E73"  # Imprint palette position 1 — the ECG trace (single data series)

# Theme-adaptive ECG paper: pink printout on light, dark red-tinted paper on dark
ECG_PAPER = "#FFF0EC" if THEME == "light" else "#2B1A18"
GRID_FINE = "#E8B4B4" if THEME == "light" else "#4A2A28"
GRID_BOLD = "#C87872" if THEME == "light" else "#6E3C38"
PAPER_EDGE = "#D4908A" if THEME == "light" else "#5A3A36"
ANNOT = "#AE3030" if THEME == "light" else "#E68B82"  # Imprint matte red — wave annotations

# Data — Synthetic ECG using Gaussian-based waveform model
np.random.seed(42)
fs = 1000
duration = 2.5
t = np.linspace(0, duration, int(fs * duration))
heart_rate = 72
beat_interval = 60.0 / heart_rate
beat_t = np.linspace(0, beat_interval, int(fs * beat_interval))

# P wave, QRS complex (Q dip, R peak, S dip), T wave — each as Gaussian pulse
p_wave = 0.15 * np.exp(-((beat_t - 0.16) ** 2) / (2 * 0.025**2))
q_wave = -0.12 * np.exp(-((beat_t - 0.24) ** 2) / (2 * 0.008**2))
r_wave = 1.0 * np.exp(-((beat_t - 0.26) ** 2) / (2 * 0.012**2))
s_wave = -0.2 * np.exp(-((beat_t - 0.28) ** 2) / (2 * 0.010**2))
t_wave = 0.3 * np.exp(-((beat_t - 0.42) ** 2) / (2 * 0.040**2))
single_beat = p_wave + q_wave + r_wave + s_wave + t_wave

# Tile beats across full duration
n_beats = int(np.ceil(duration / beat_interval)) + 1
full_template = np.tile(single_beat, n_beats)[: len(t)]

# Lead-specific amplitude/polarity factors and precordial R-wave progression
lead_factors = {
    "I": 0.8,
    "II": 1.0,
    "III": 0.5,
    "aVR": -0.7,
    "aVL": 0.3,
    "aVF": 0.75,
    "V1": -0.4,
    "V2": 0.1,
    "V3": 0.6,
    "V4": 1.0,
    "V5": 0.9,
    "V6": 0.7,
}
precordial_r = {"V1": 0.3, "V2": 0.5, "V3": 0.8, "V4": 1.2, "V5": 1.1, "V6": 0.9}
precordial_s = {"V1": 1.5, "V2": 1.2, "V3": 0.8, "V4": 0.3, "V5": 0.2, "V6": 0.1}

lead_signals = {}
for lead_name, factor in lead_factors.items():
    signal = full_template * factor
    if lead_name in precordial_r:
        r_mod = (precordial_r[lead_name] - 1.0) * np.exp(-((beat_t - 0.26) ** 2) / (2 * 0.012**2))
        s_mod = -(precordial_s[lead_name] - 1.0) * 0.2 * np.exp(-((beat_t - 0.28) ** 2) / (2 * 0.010**2))
        signal = signal + np.tile(r_mod + s_mod, n_beats)[: len(t)]
    lead_signals[lead_name] = signal + np.random.normal(0, 0.008, len(t))

# Standard clinical 3x4 grid layout
grid_layout = [["I", "aVR", "V1", "V4"], ["II", "aVL", "V2", "V5"], ["III", "aVF", "V3", "V6"]]

# Build combined dataframe for all 12 leads with row/col position
all_leads = []
for row_idx, row_leads in enumerate(grid_layout):
    for col_idx, lead_name in enumerate(row_leads):
        df = pd.DataFrame({"time": t, "voltage": lead_signals[lead_name]})
        df["lead"] = lead_name
        df["row"] = row_idx
        df["col"] = col_idx
        all_leads.append(df)
leads_df = pd.concat(all_leads, ignore_index=True)

# Chart dimensions — kept small so vl-convert padding still fits 3200x1800
panel_w = 181
panel_h = 75
rhythm_h = 60
col_spacing = 6
row_spacing = 6
x_domain = [0, duration]
y_domain = [-1.2, 1.5]

# ECG paper grid line data (fine at ~1mm, bold at ~5mm)
fine_h_lines = pd.DataFrame({"y": np.arange(-1.5, 1.61, 0.1)})
bold_h_lines = pd.DataFrame({"y": np.arange(-1.5, 1.61, 0.5)})
fine_v_lines = pd.DataFrame({"x": np.arange(0, duration + 0.01, 0.04)})
bold_v_lines = pd.DataFrame({"x": np.arange(0, duration + 0.01, 0.2)})

# Reusable grid layers — created once, used in all panels
grid_layers = (
    alt.Chart(fine_h_lines)
    .mark_rule(color=GRID_FINE, strokeWidth=0.5, opacity=0.6)
    .encode(y=alt.Y("y:Q", scale=alt.Scale(domain=y_domain), axis=None))
    + alt.Chart(bold_h_lines)
    .mark_rule(color=GRID_BOLD, strokeWidth=1.2, opacity=0.7)
    .encode(y=alt.Y("y:Q", scale=alt.Scale(domain=y_domain), axis=None))
    + alt.Chart(fine_v_lines)
    .mark_rule(color=GRID_FINE, strokeWidth=0.5, opacity=0.6)
    .encode(x=alt.X("x:Q", scale=alt.Scale(domain=x_domain), axis=None))
    + alt.Chart(bold_v_lines)
    .mark_rule(color=GRID_BOLD, strokeWidth=1.2, opacity=0.7)
    .encode(x=alt.X("x:Q", scale=alt.Scale(domain=x_domain), axis=None))
)

# Plot — Build 3x4 lead grid using layered hconcat/vconcat composition
rows = []
for row_idx, row_leads in enumerate(grid_layout):
    show_x = row_idx == 2
    lead_charts = []
    for col_idx, lead_name in enumerate(row_leads):
        lead_df = leads_df[(leads_df["row"] == row_idx) & (leads_df["col"] == col_idx)]

        x_enc = (
            alt.X(
                "time:Q",
                scale=alt.Scale(domain=x_domain),
                axis=alt.Axis(title="Time (s)", titleFontSize=12, labelFontSize=10, tickCount=6),
            )
            if show_x
            else alt.X("time:Q", scale=alt.Scale(domain=x_domain), axis=None)
        )

        signal_layer = (
            alt.Chart(lead_df)
            .mark_line(strokeWidth=1.4, interpolate="monotone", color=BRAND)
            .encode(x=x_enc, y=alt.Y("voltage:Q", scale=alt.Scale(domain=y_domain), axis=None))
        )

        label_df = pd.DataFrame({"x": [0.06], "y": [1.35], "text": [lead_name]})
        label_layer = (
            alt.Chart(label_df)
            .mark_text(fontSize=12, fontWeight="bold", align="left", baseline="top", color=INK)
            .encode(
                x=alt.X("x:Q", scale=alt.Scale(domain=x_domain)),
                y=alt.Y("y:Q", scale=alt.Scale(domain=y_domain)),
                text="text:N",
            )
        )

        panel = (grid_layers + signal_layer + label_layer).properties(width=panel_w, height=panel_h)
        lead_charts.append(panel)
    rows.append(alt.hconcat(*lead_charts, spacing=col_spacing))

# Rhythm strip — full-length Lead II across bottom
rhythm_df = pd.DataFrame({"time": t, "voltage": lead_signals["II"]})
rhythm_signal = (
    alt.Chart(rhythm_df)
    .mark_line(strokeWidth=1.6, interpolate="monotone", color=BRAND)
    .encode(
        x=alt.X(
            "time:Q",
            scale=alt.Scale(domain=x_domain),
            axis=alt.Axis(title="Time (s)", titleFontSize=12, labelFontSize=10, tickCount=10),
        ),
        y=alt.Y("voltage:Q", scale=alt.Scale(domain=y_domain), axis=None),
    )
)

rhythm_label_df = pd.DataFrame({"x": [0.12], "y": [1.35], "text": ["II (rhythm)"]})
rhythm_label = (
    alt.Chart(rhythm_label_df)
    .mark_text(fontSize=12, fontWeight="bold", align="left", baseline="top", color=INK)
    .encode(
        x=alt.X("x:Q", scale=alt.Scale(domain=x_domain)),
        y=alt.Y("y:Q", scale=alt.Scale(domain=y_domain)),
        text="text:N",
    )
)

# Calibration pulse (1mV square at start of rhythm strip)
cal_df = pd.DataFrame({"time": [0.0, 0.0, 0.04, 0.04, 0.08, 0.08], "voltage": [0.0, 1.0, 1.0, 0.0, 0.0, 0.0]})
cal_signal = (
    alt.Chart(cal_df)
    .mark_line(strokeWidth=1.6, color=INK)
    .encode(x=alt.X("time:Q", scale=alt.Scale(domain=x_domain)), y=alt.Y("voltage:Q", scale=alt.Scale(domain=y_domain)))
)
cal_label_df = pd.DataFrame({"x": [0.04], "y": [1.12], "text": ["1 mV"]})
cal_label = (
    alt.Chart(cal_label_df)
    .mark_text(fontSize=10, fontWeight="bold", align="center", baseline="bottom", color=INK_SOFT)
    .encode(
        x=alt.X("x:Q", scale=alt.Scale(domain=x_domain)),
        y=alt.Y("y:Q", scale=alt.Scale(domain=y_domain)),
        text="text:N",
    )
)

# Waveform annotation on rhythm strip — label P, QRS, T morphology
annot_data = pd.DataFrame({"x": [0.16, 0.26, 0.42], "y": [0.35, 1.25, 0.50], "text": ["P", "R", "T"]})
annot_layer = (
    alt.Chart(annot_data)
    .mark_text(fontSize=11, fontWeight="bold", fontStyle="italic", align="center", dy=-8, color=ANNOT)
    .encode(
        x=alt.X("x:Q", scale=alt.Scale(domain=x_domain)),
        y=alt.Y("y:Q", scale=alt.Scale(domain=y_domain)),
        text="text:N",
    )
)

rhythm_strip = (grid_layers + rhythm_signal + rhythm_label + cal_signal + cal_label + annot_layer).properties(
    width=panel_w * 4 + col_spacing * 3, height=rhythm_h
)

# Style — Combine all rows and rhythm strip
chart = (
    alt.vconcat(*rows, rhythm_strip, spacing=row_spacing)
    .properties(
        title=alt.Title(
            "ecg-twelve-lead · python · altair · anyplot.ai",
            fontSize=18,
            fontWeight="bold",
            color=INK,
            anchor="middle",
            subtitle=["Normal Sinus Rhythm · 72 BPM · 12-Lead ECG", "25 mm/s · 10 mm/mV"],
            subtitleFontSize=12,
            subtitleColor=INK_SOFT,
            offset=8,
        )
    )
    .configure_view(strokeWidth=0.6, stroke=PAPER_EDGE, fill=ECG_PAPER, cornerRadius=2)
    .configure_concat(spacing=row_spacing)
    .configure(background=PAGE_BG, padding={"left": 12, "right": 12, "top": 8, "bottom": 8})
)

# Save — render then pad to the exact 3200x1800 landscape target (no crop)
chart.save(f"plot-{THEME}.png", scale_factor=4.0)
chart.save(f"plot-{THEME}.html")

TW, TH = 3200, 1800
_img = Image.open(f"plot-{THEME}.png").convert("RGB")
_w, _h = _img.size
if _w > TW or _h > TH:
    raise SystemExit(
        f"altair vl-convert produced {_w}×{_h}, exceeds target {TW}×{TH}. Shrink panel/title sizes and re-render."
    )
if _w < TW or _h < TH:
    _canvas = Image.new("RGB", (TW, TH), PAGE_BG)
    _canvas.paste(_img, ((TW - _w) // 2, (TH - _h) // 2))
    _canvas.save(f"plot-{THEME}.png")
Runnable source as JSON, for any HTTP client: https://api.anyplot.ai/specs/ecg-twelve-lead/altair/code. Any spec id and library id listed in llms-full.txt fit the same URL shape; every URL below is complete and callable.
{
  "spec_id": "ecg-twelve-lead",
  "language": "python",
  "library": "altair",
  "page": "https://anyplot.ai/ecg-twelve-lead/python/altair",
  "hub": "https://anyplot.ai/ecg-twelve-lead",
  "code_json": "https://api.anyplot.ai/specs/ecg-twelve-lead/altair/code",
  "spec_json": "https://api.anyplot.ai/specs/ecg-twelve-lead",
  "render_light_png": "https://storage.googleapis.com/anyplot-images/plots/ecg-twelve-lead/python/altair/plot-light.png",
  "render_dark_png": "https://storage.googleapis.com/anyplot-images/plots/ecg-twelve-lead/python/altair/plot-dark.png",
  "interactive_light_html": "https://storage.googleapis.com/anyplot-images/plots/ecg-twelve-lead/python/altair/plot-light.html",
  "interactive_dark_html": "https://storage.googleapis.com/anyplot-images/plots/ecg-twelve-lead/python/altair/plot-dark.html",
  "quality_score": 94.0,
  "license": "MIT",
  "guide": "https://anyplot.ai/llms.txt"
}
Part of ECG/EKG 12-Lead Waveform Display on anyplot.ai.