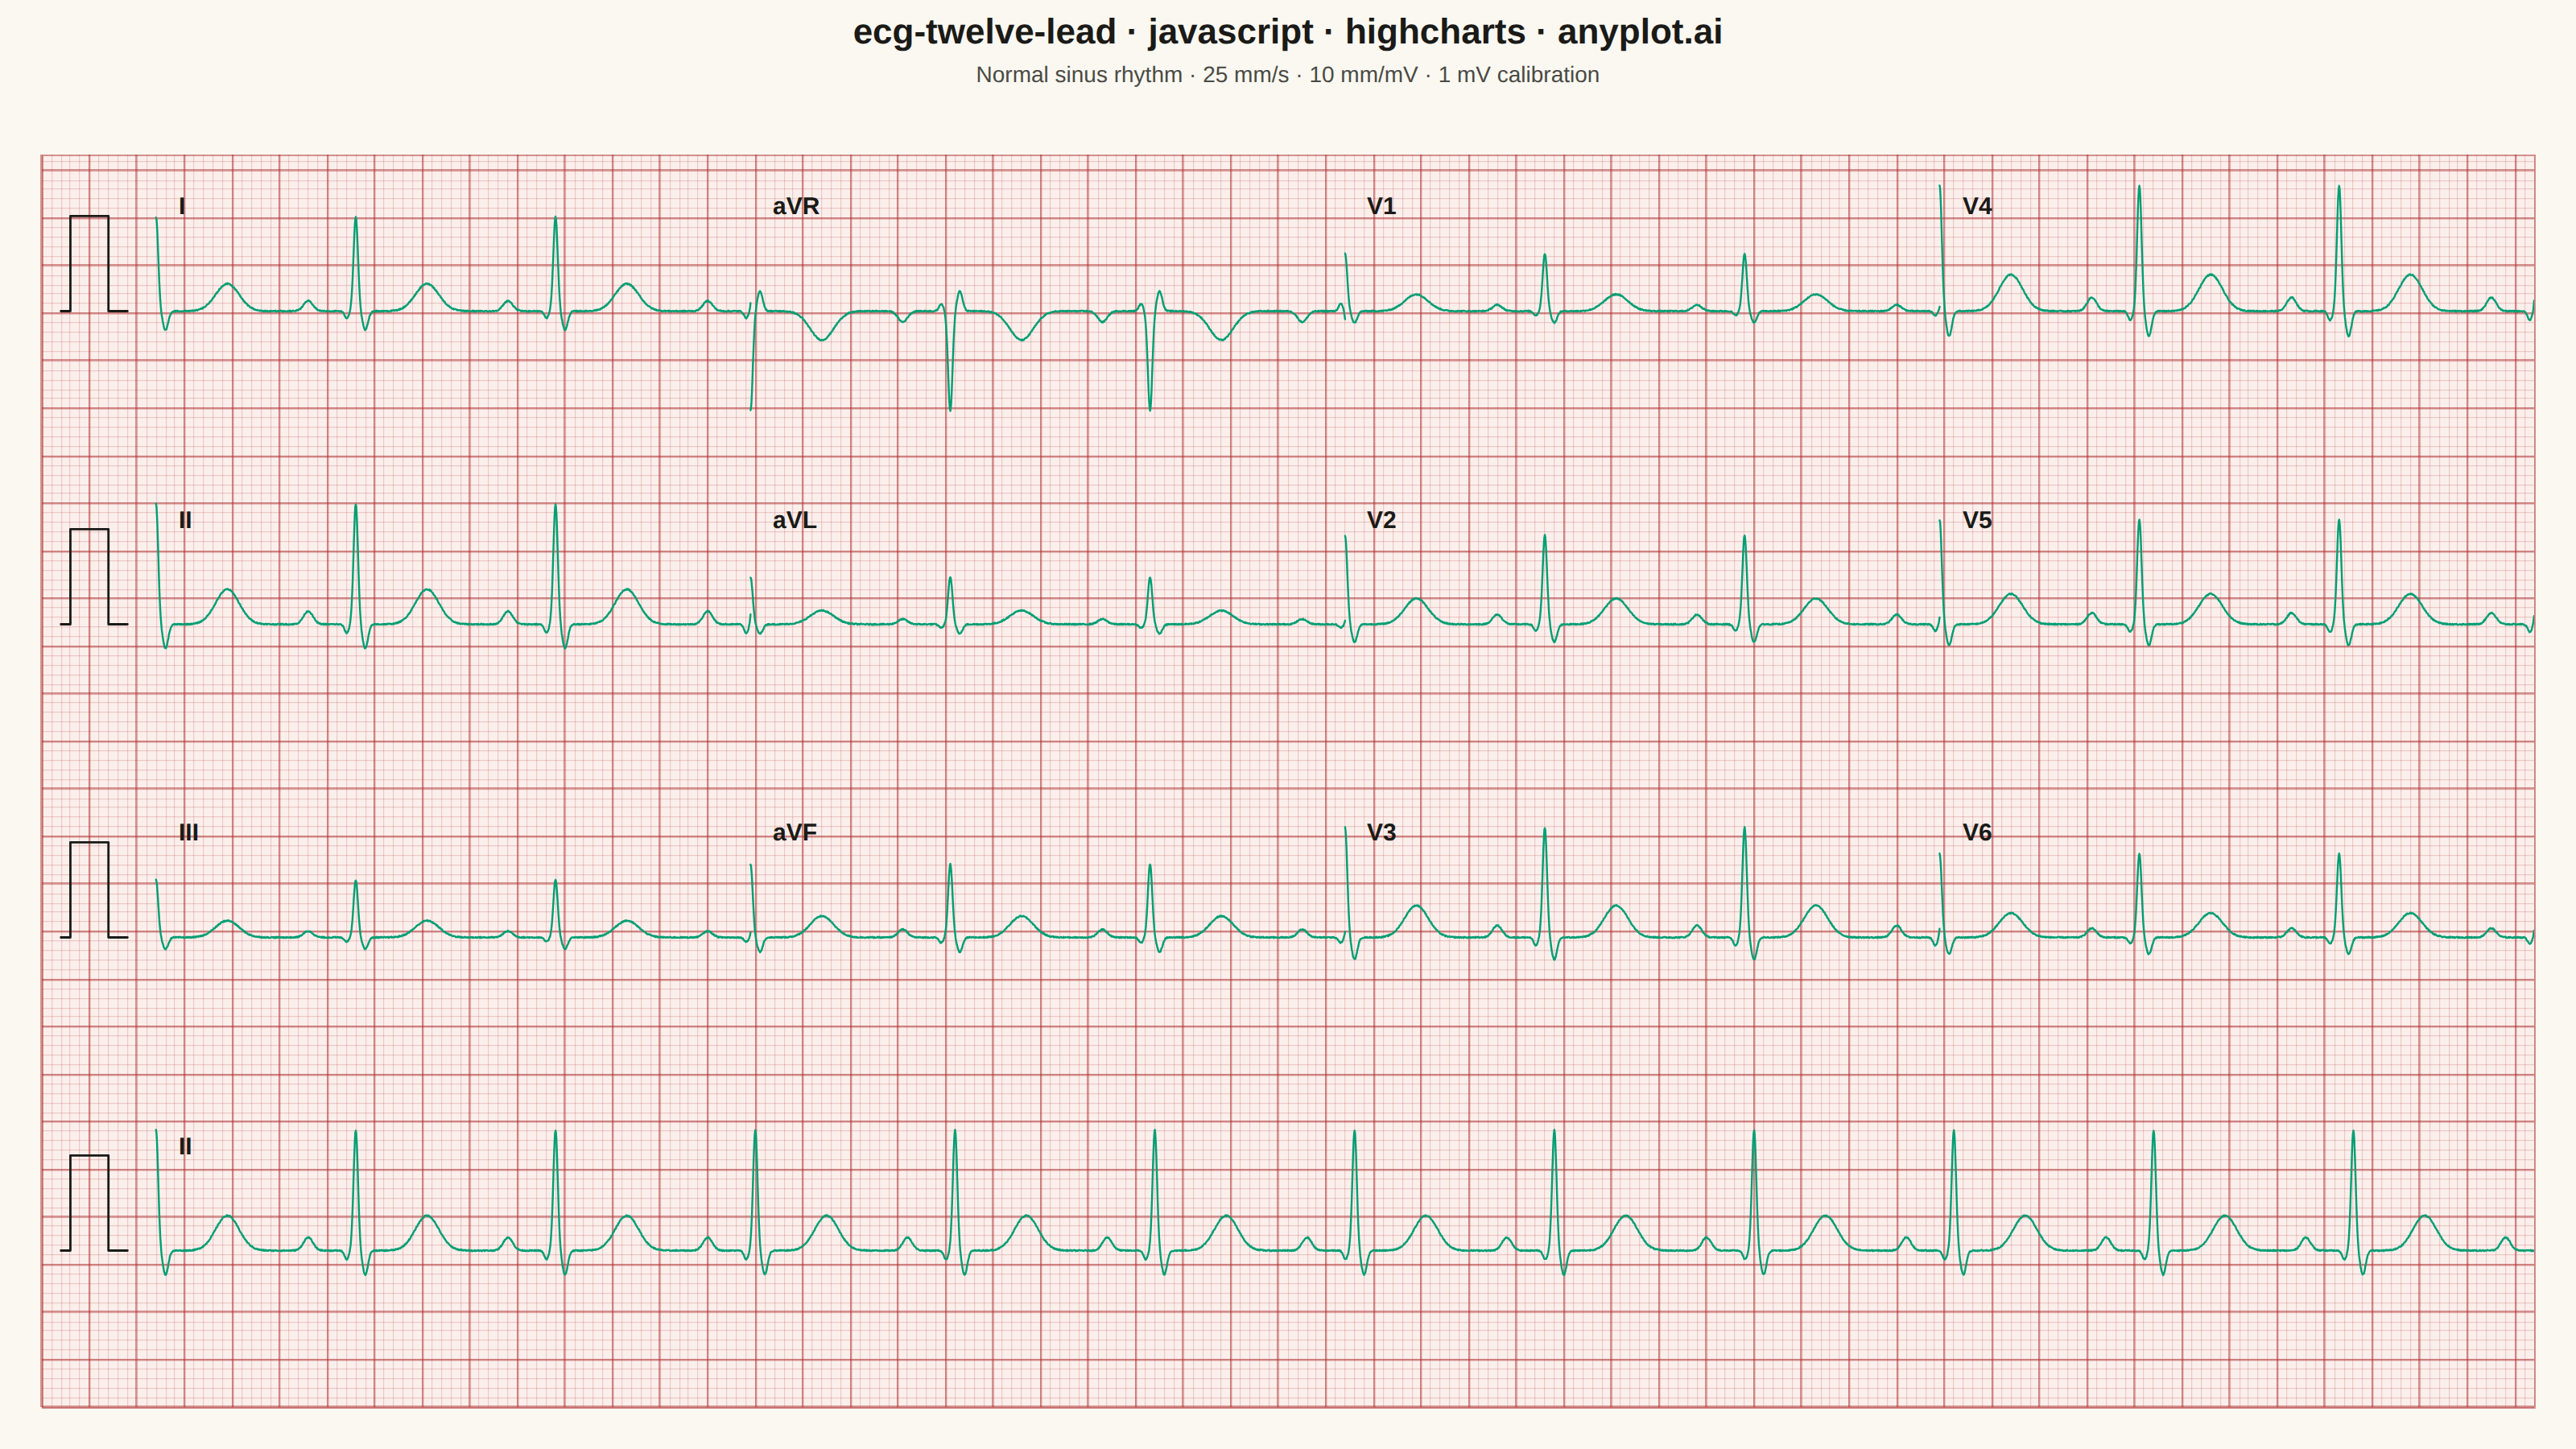
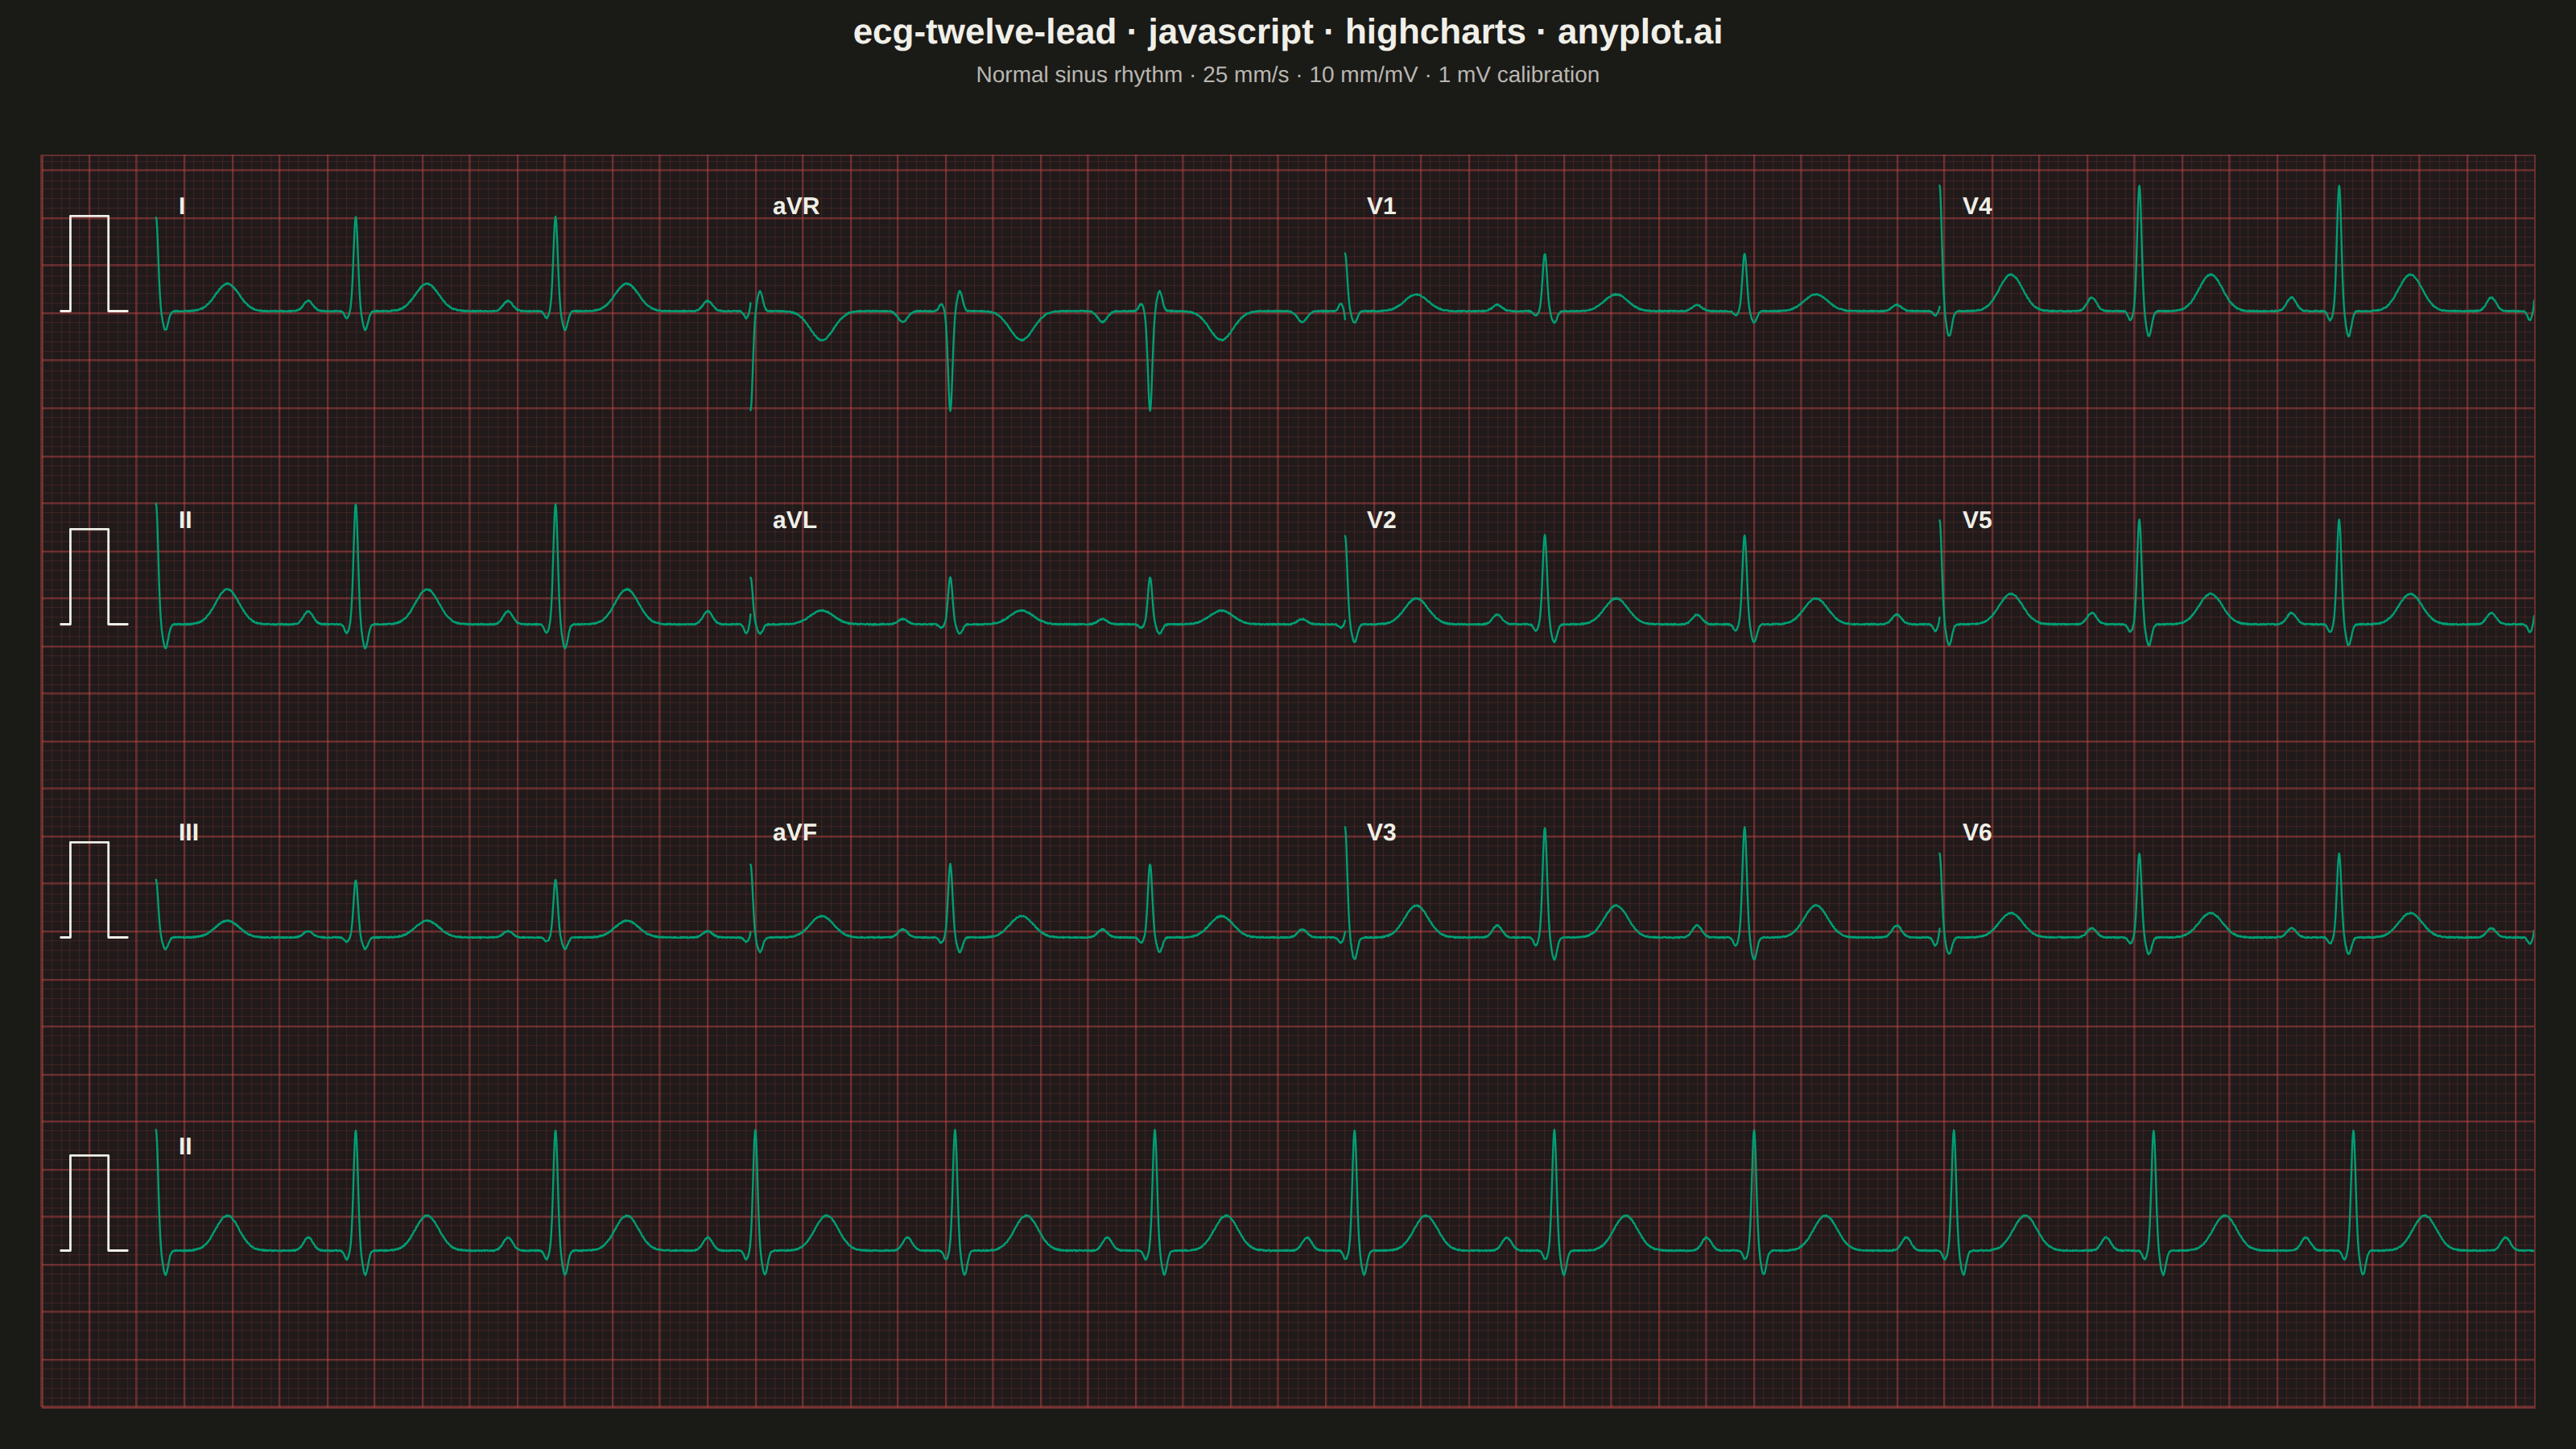
A multi-channel electrocardiogram display showing the 12 standard ECG leads arranged in clinical format. Each lead displays realistic P-QRS-T wave complexes on a medical-standard grid background with calibration markers. This visualization replicates the familiar layout used in hospitals and clinics worldwide, making it immediately recognizable to healthcare professionals and useful for medical education.
// anyplot.ai
// ecg-twelve-lead: ECG/EKG 12-Lead Waveform Display
// Library: highcharts 12.6.0 | JavaScript 22.22.3
// Quality: 91/100 | Created: 2026-06-17
//# anyplot-orientation: landscape

// Standard clinical 12-lead ECG rendered on medical "paper": a 3x4 grid of the
// limb / augmented / precordial leads plus a full-length Lead II rhythm strip.
// The chart's own gridlines ARE the ECG paper (1 mm minor / 5 mm major, the
// classic red ruling); the green trace echoes the patient-monitor convention
// while keeping the Imprint brand green (palette[0]) as the first series.

const t = window.ANYPLOT_TOKENS;
const size = window.ANYPLOT_SIZE || { width: 1600, height: 900 };
const theme = window.ANYPLOT_THEME === "dark" ? "dark" : "light";

const TRACE = t.palette[0]; // #009E73 — brand green, monitor-style ECG trace
const INK = t.ink;

// ECG paper styling — pale pink printout (light) / warm monitor black (dark),
// red ruling derived from the Imprint matte-red anchor (#AE3030).
const PAPER = theme === "light" ? "#FBEFEC" : "#201A1A";
const GRID_MAJOR = theme === "light" ? "rgba(174,48,48,0.50)" : "rgba(196,72,72,0.42)";
const GRID_MINOR = theme === "light" ? "rgba(174,48,48,0.20)" : "rgba(196,72,72,0.16)";

// --- Geometry (millimetres; standard scale 25 mm/s, 10 mm/mV) ----------------
// We keep the grid squares truly square by matching the data unit ratio to the
// plot-area pixel ratio (Highcharts otherwise stretches each axis independently).
const MARGIN = { top: 96, bottom: 26, left: 26, right: 26 };
const COL_W = 62.5; // 2.5 s per column at 25 mm/s
const LEFT_MARGIN = 12; // room for the 1 mV calibration pulse
const W_MM = LEFT_MARGIN + 4 * COL_W; // 262 mm total width
const plotW = size.width - MARGIN.left - MARGIN.right;
const plotH = size.height - MARGIN.top - MARGIN.bottom;
const H_MM = (W_MM * plotH) / plotW; // height that keeps 1 mm square
const BAND_H = H_MM / 4; // 3 lead rows + 1 rhythm strip

const colX = (j) => LEFT_MARGIN + j * COL_W;
const baseY = (r) => H_MM - (r + 0.5) * BAND_H; // row 0 at top

// Standard clinical layout: columns (I,II,III) (aVR,aVL,aVF) (V1,V2,V3) (V4,V5,V6)
// arranged so each grid ROW reads I,aVR,V1,V4 / II,aVL,V2,V5 / III,aVF,V3,V6.
const ROWS = [
  ["I", "aVR", "V1", "V4"],
  ["II", "aVL", "V2", "V5"],
  ["III", "aVF", "V3", "V6"],
];

// Per-lead amplitude/polarity gains for a normal-axis sinus rhythm (aVR inverts;
// the precordial leads show R-wave progression V1->V4->V6).
const GAIN = {
  I: 0.9, II: 1.15, III: 0.55,
  aVR: -0.95, aVL: 0.45, aVF: 0.7,
  V1: 0.55, V2: 0.85, V3: 1.05, V4: 1.2, V5: 1.0, V6: 0.8,
};

// --- Synthetic normal sinus rhythm (deterministic) ---------------------------
const T0 = 0.84; // beat period ≈ 71 bpm
const DT = 0.002; // 500 Hz render sampling

function gauss(tau, a, c, w) {
  const z = (tau - c) / w;
  return a * Math.exp(-z * z);
}
// One P-QRS-T complex, tau in seconds relative to the R peak.
function beat(tau) {
  return (
    gauss(tau, 0.12, -0.20, 0.028) + // P wave
    gauss(tau, -0.08, -0.038, 0.013) + // Q
    gauss(tau, 1.10, 0.0, 0.013) + // R
    gauss(tau, -0.22, 0.040, 0.016) + // S
    gauss(tau, 0.32, 0.300, 0.070) // T wave
  );
}
function signal(tt) {
  const k0 = Math.floor(tt / T0) - 1;
  let v = 0;
  for (let k = k0; k <= k0 + 2; k++) v += beat(tt - k * T0);
  return v;
}
// Tiny fixed-seed LCG for faint, realistic baseline noise.
let _seed = 123456789;
function rnd() {
  _seed = (1103515245 * _seed + 12345) % 2147483648;
  return _seed / 2147483648;
}
// Build a lead trace: time -> (x mm, y mm). Leads are recorded simultaneously,
// so every column shares the same beat timing (t starts at 0 in each cell).
function leadData(gain, tEnd, xOff, base) {
  const d = [];
  for (let tt = 0; tt <= tEnd + 1e-9; tt += DT) {
    const v = gain * signal(tt) + (rnd() - 0.5) * 0.012;
    d.push([xOff + tt * 25, base + v * 10]);
  }
  return d;
}

// --- Series ------------------------------------------------------------------
const traceOpts = {
  type: "line",
  color: TRACE,
  lineWidth: 1.2,
  marker: { enabled: false },
  states: { hover: { lineWidthPlus: 0 }, inactive: { opacity: 1 } },
  enableMouseTracking: true,
  animation: false,
};

const series = [];

// 12 small leads (first series = Lead I, brand green).
for (let r = 0; r < 3; r++) {
  for (let j = 0; j < 4; j++) {
    const lead = ROWS[r][j];
    series.push({
      ...traceOpts,
      name: lead,
      data: leadData(GAIN[lead], 2.5, colX(j), baseY(r)),
    });
  }
}

// Full-length Lead II rhythm strip across the bottom band (10 s).
series.push({
  ...traceOpts,
  name: "II (rhythm strip)",
  data: leadData(GAIN.II, 10, LEFT_MARGIN, baseY(3)),
});

// 1 mV calibration pulses (10 mm tall, ~0.2 s wide) at the left of every band.
const calData = [];
for (let r = 0; r < 4; r++) {
  const b = baseY(r);
  calData.push([2, b], [3, b], [3, b + 10], [7, b + 10], [7, b], [9, b], [null, null]);
}
series.push({
  type: "line",
  name: "1 mV calibration",
  data: calData,
  color: INK,
  lineWidth: 1.4,
  marker: { enabled: false },
  enableMouseTracking: false,
  animation: false,
  showInLegend: false,
});

// Lead labels (top-left of each cell) via an invisible scatter + dataLabels.
const labelPts = [];
for (let r = 0; r < 3; r++)
  for (let j = 0; j < 4; j++)
    labelPts.push({ x: colX(j) + 1.5, y: baseY(r) + BAND_H * 0.34, name: ROWS[r][j] });
labelPts.push({ x: LEFT_MARGIN + 1.5, y: baseY(3) + BAND_H * 0.34, name: "II" });

series.push({
  type: "scatter",
  name: "labels",
  data: labelPts,
  enableMouseTracking: false,
  showInLegend: false,
  animation: false,
  marker: { enabled: false },
  dataLabels: {
    enabled: true,
    format: "{point.name}",
    align: "left",
    verticalAlign: "middle",
    style: { color: INK, fontSize: "15px", fontWeight: "700", textOutline: "none" },
  },
});

// --- Chart -------------------------------------------------------------------
const axisCommon = {
  min: 0,
  startOnTick: false,
  endOnTick: false,
  minPadding: 0,
  maxPadding: 0,
  lineWidth: 0,
  tickWidth: 0,
  tickLength: 0,
  minorTickLength: 0,
  tickInterval: 5, // 5 mm bold ruling
  minorTickInterval: 1, // 1 mm fine ruling
  gridLineWidth: 1.2,
  gridLineColor: GRID_MAJOR,
  minorGridLineWidth: 0.6,
  minorGridLineColor: GRID_MINOR,
  labels: { enabled: false },
  title: { text: null },
};

Highcharts.chart("container", {
  chart: {
    backgroundColor: "transparent",
    plotBackgroundColor: PAPER,
    plotBorderWidth: 1,
    plotBorderColor: GRID_MAJOR,
    marginTop: MARGIN.top,
    marginBottom: MARGIN.bottom,
    marginLeft: MARGIN.left,
    marginRight: MARGIN.right,
    animation: false,
    style: { fontFamily: "inherit" },
  },
  credits: { enabled: false },
  colors: t.palette,
  title: {
    text: "ecg-twelve-lead · javascript · highcharts · anyplot.ai",
    style: { color: INK, fontSize: "22px", fontWeight: "600" },
  },
  subtitle: {
    text: "Normal sinus rhythm · 25 mm/s · 10 mm/mV · 1 mV calibration",
    style: { color: t.inkSoft, fontSize: "14px" },
  },
  legend: { enabled: false },
  tooltip: { enabled: false },
  xAxis: { ...axisCommon, max: W_MM },
  yAxis: { ...axisCommon, max: H_MM },
  plotOptions: { series: { animation: false } },
  series,
});

window.__anyplotReady = true;
Runnable source as JSON, for any HTTP client: https://api.anyplot.ai/specs/ecg-twelve-lead/highcharts/code. Any spec id and library id listed in llms-full.txt fit the same URL shape; every URL below is complete and callable.
{
  "spec_id": "ecg-twelve-lead",
  "language": "javascript",
  "library": "highcharts",
  "page": "https://anyplot.ai/ecg-twelve-lead/javascript/highcharts",
  "hub": "https://anyplot.ai/ecg-twelve-lead",
  "code_json": "https://api.anyplot.ai/specs/ecg-twelve-lead/highcharts/code",
  "spec_json": "https://api.anyplot.ai/specs/ecg-twelve-lead",
  "render_light_png": "https://storage.googleapis.com/anyplot-images/plots/ecg-twelve-lead/javascript/highcharts/plot-light.png",
  "render_dark_png": "https://storage.googleapis.com/anyplot-images/plots/ecg-twelve-lead/javascript/highcharts/plot-dark.png",
  "interactive_light_html": "https://storage.googleapis.com/anyplot-images/plots/ecg-twelve-lead/javascript/highcharts/plot-light.html",
  "interactive_dark_html": "https://storage.googleapis.com/anyplot-images/plots/ecg-twelve-lead/javascript/highcharts/plot-dark.html",
  "quality_score": 91.0,
  "license": "MIT",
  "guide": "https://anyplot.ai/llms.txt"
}
Part of ECG/EKG 12-Lead Waveform Display on anyplot.ai.