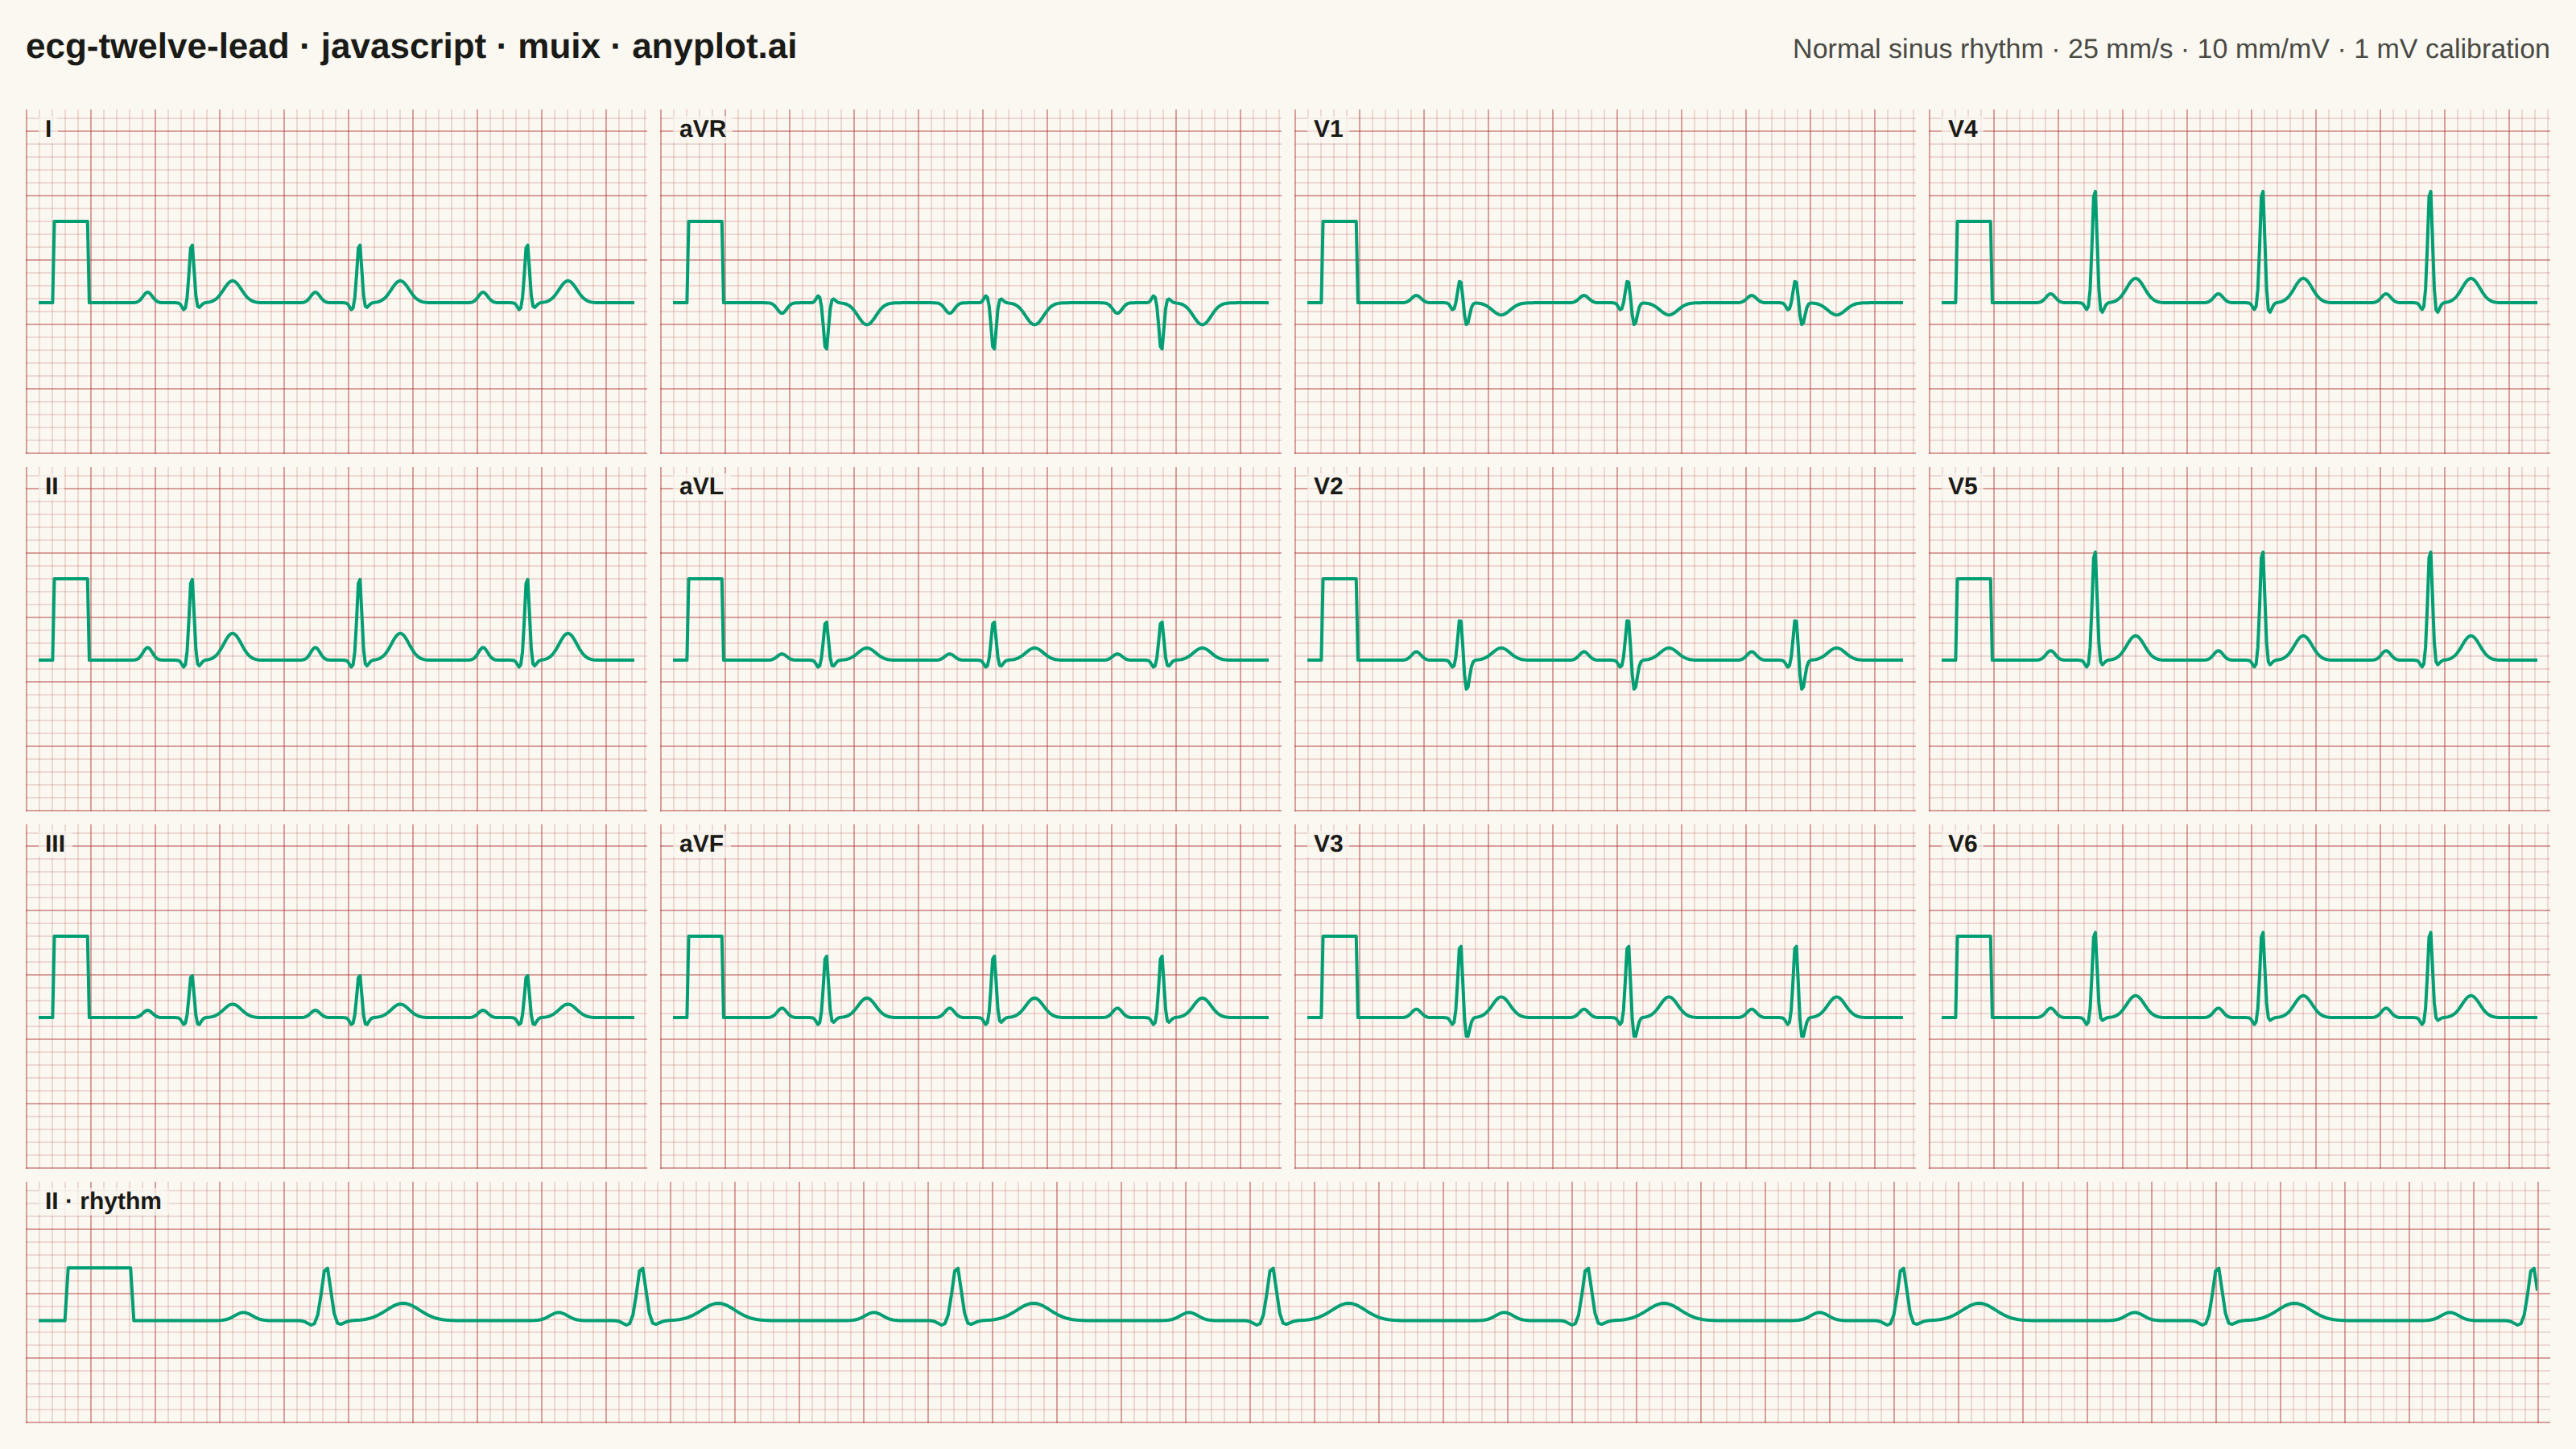
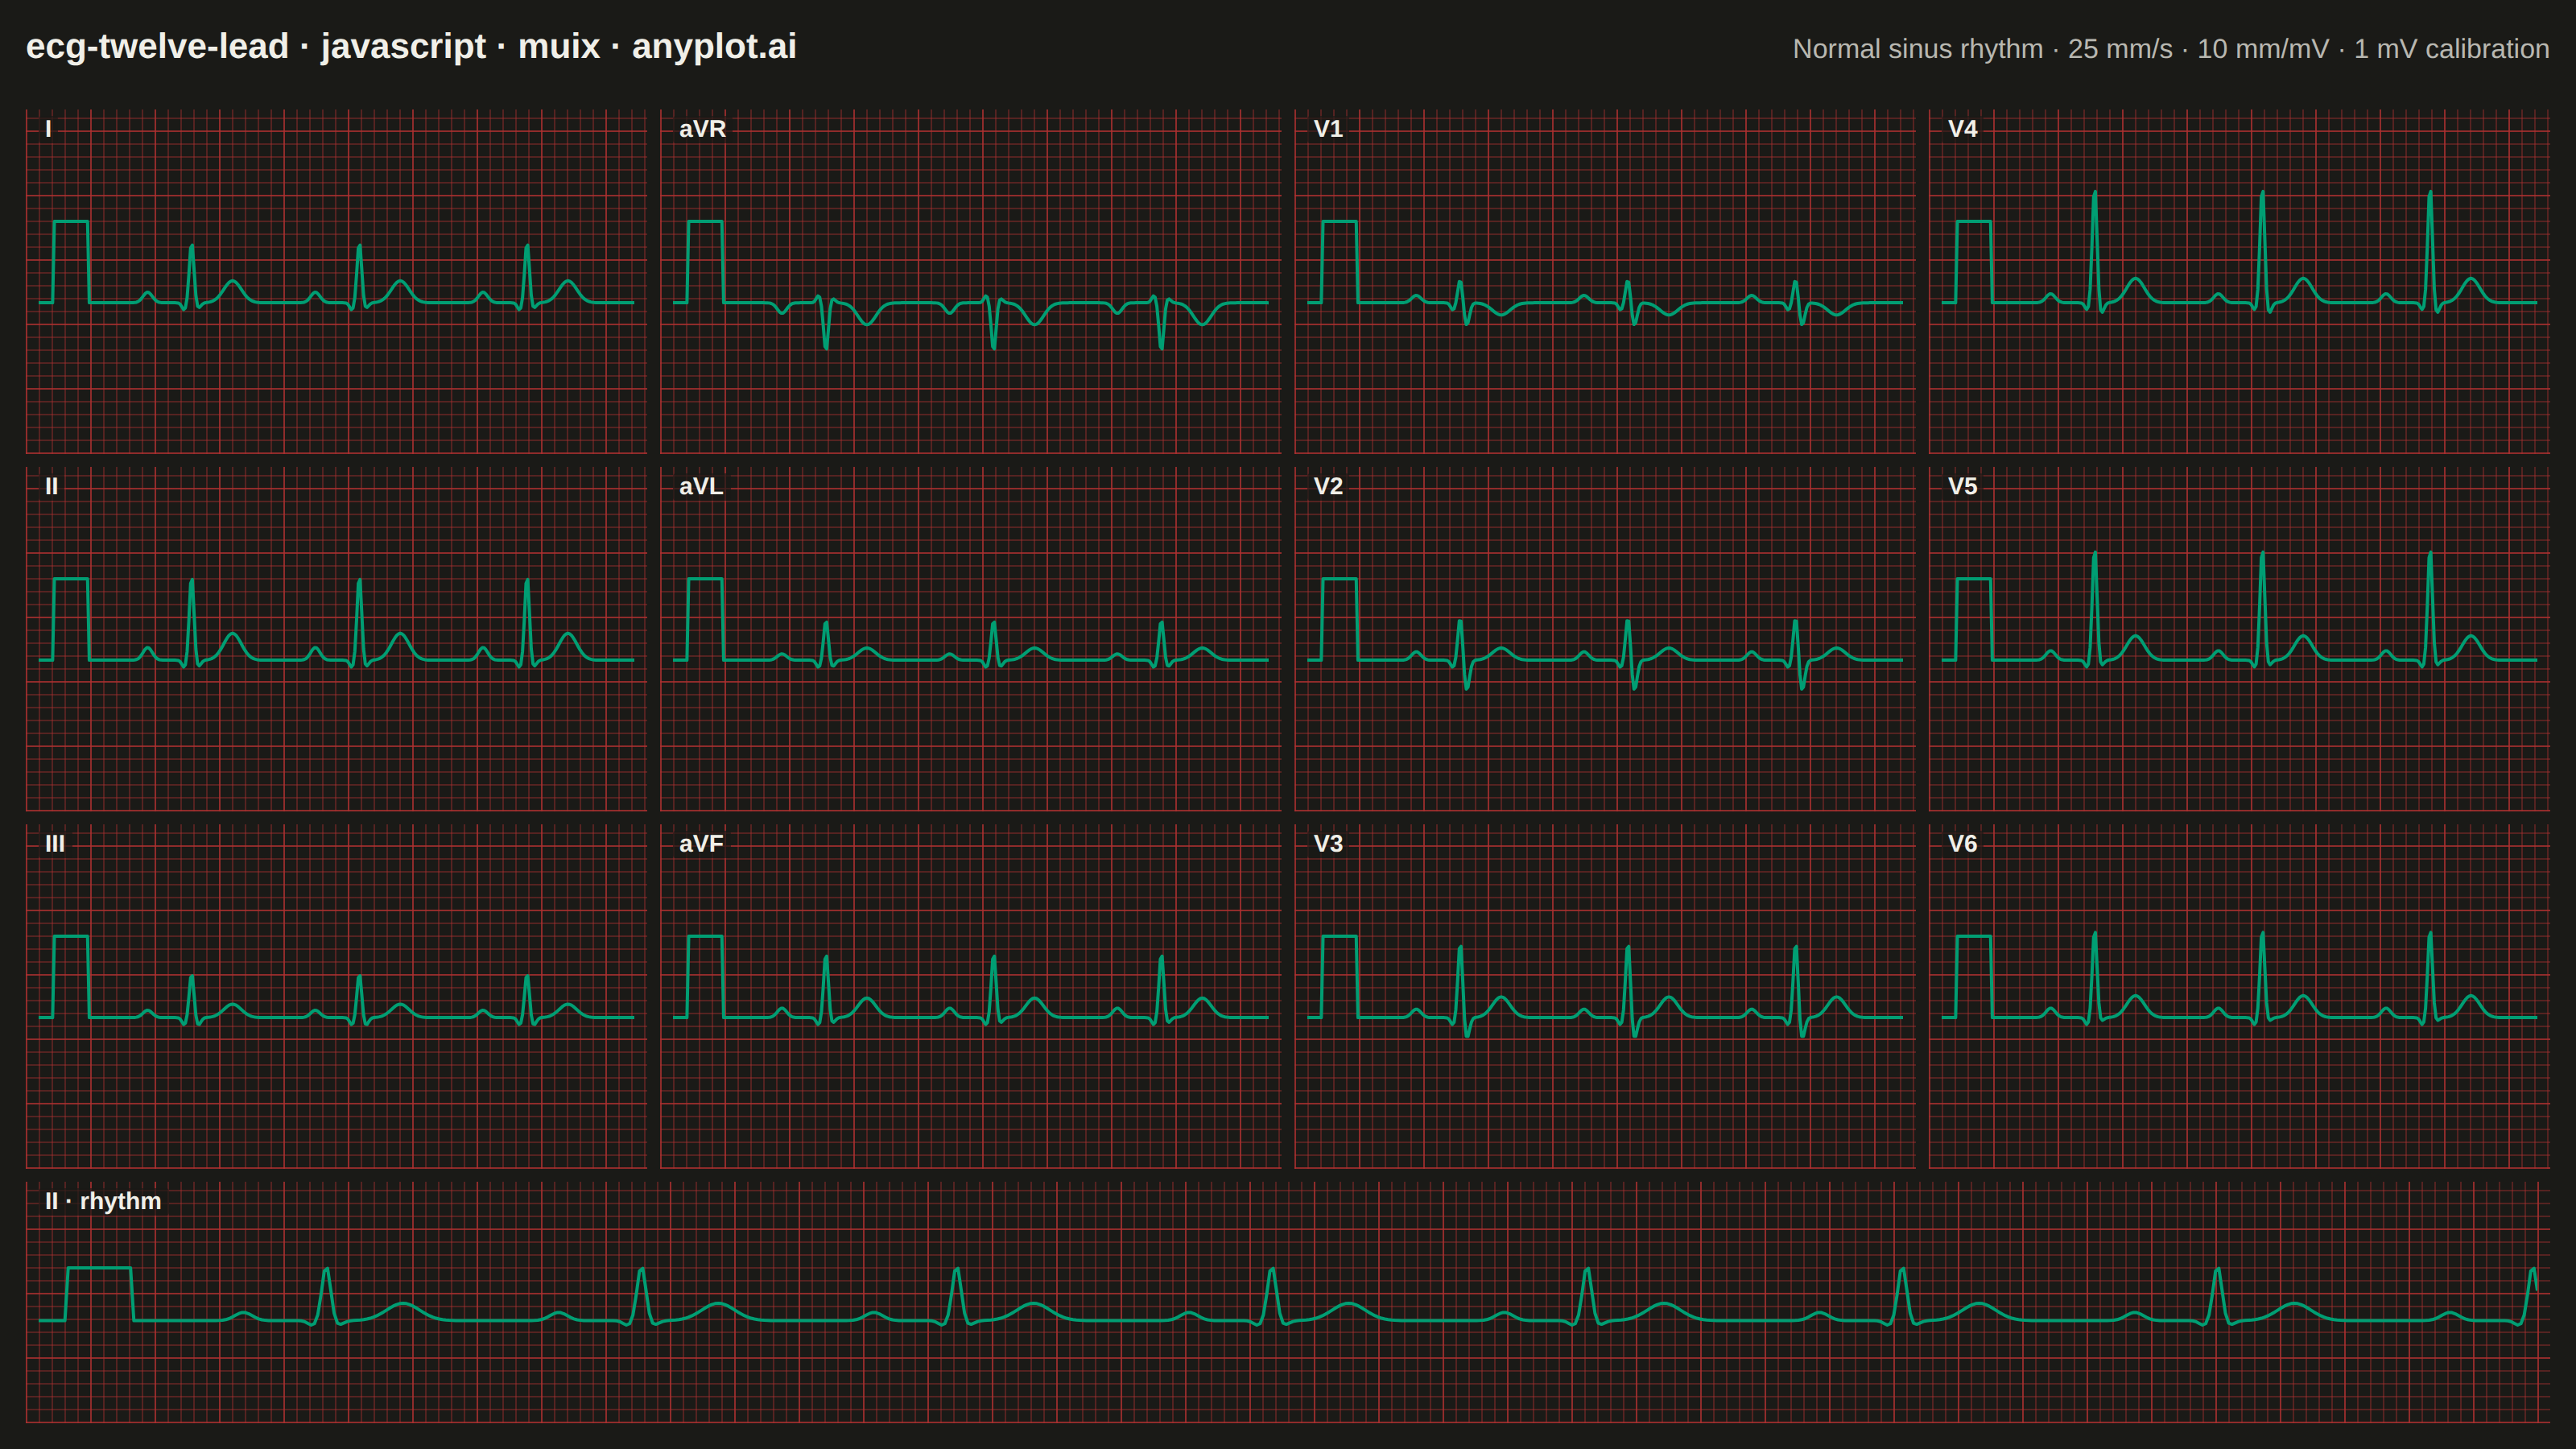
A multi-channel electrocardiogram display showing the 12 standard ECG leads arranged in clinical format. Each lead displays realistic P-QRS-T wave complexes on a medical-standard grid background with calibration markers. This visualization replicates the familiar layout used in hospitals and clinics worldwide, making it immediately recognizable to healthcare professionals and useful for medical education.
// anyplot.ai
// ecg-twelve-lead: ECG/EKG 12-Lead Waveform Display
// Library: muix 7.29.1 | JavaScript 22.22.3
// Quality: 93/100 | Created: 2026-06-17
//# anyplot-orientation: landscape
// anyplot.ai
// ecg-twelve-lead: ECG/EKG 12-Lead Waveform Display
// Library: MUI X Charts | React | Node 22
// License: @mui/x-charts — MIT (community). Pro/Premium are out of scope.
// Quality: pending | Created: 2026-06-17
import { LineChart } from "@mui/x-charts/LineChart";

const t = window.ANYPLOT_TOKENS;
const isLight = window.ANYPLOT_THEME !== "dark";

// Imprint palette: the waveform trace is brand green (position 1, always first
// series). ECG paper grid uses matte red (Imprint position 5) — the universally
// recognised colour of clinical ECG paper — at theme-adaptive alpha.
const TRACE = t.palette[0]; // #009E73 brand green
// Both themes derive from the same Imprint matte-red anchor (#AE3030 = rgba(174,48,48));
// the dark theme simply raises the alpha so the grid stays visible on the near-black
// surface, rather than introducing an off-palette brightened red.
const GRID_MINOR = isLight ? "rgba(174,48,48,0.16)" : "rgba(174,48,48,0.40)";
const GRID_MAJOR = isLight ? "rgba(174,48,48,0.34)" : "rgba(174,48,48,0.66)";

// --- Synthetic ECG model (in-memory, deterministic) ------------------------
// Normal sinus rhythm at 75 bpm. Each P-QRS-T complex is a sum of Gaussian
// deflections; per-lead profiles scale P/R/S/T amplitude and polarity to give
// each of the 12 leads its characteristic morphology (e.g. aVR fully inverted,
// V1 rS with inverted T, V4-V6 dominant R waves).
const FS = 120; // chart sampling (Hz) — smooth without bloating the SVG paths
const PERIOD = 0.8; // 75 bpm
const CAL_DUR = 0.34; // 1 mV calibration pulse occupies the strip margin

function ecgValue(tb, p) {
  const g = (c, a, w) => a * Math.exp(-((tb - c) ** 2) / (2 * w * w));
  return (
    g(0.18, 0.13 * p.p, 0.022) + // P wave
    g(0.355, -0.09, 0.011) + // Q
    g(0.39, 1.0 * p.r, 0.011) + // R
    g(0.42, -0.28 * p.s, 0.013) + // S
    g(0.585, 0.3 * p.t, 0.042) // T wave
  );
}

function buildStrip(p, seconds) {
  const xs = [];
  const ys = [];
  const total = CAL_DUR + seconds;
  const n = Math.round(total * FS);
  for (let i = 0; i <= n; i++) {
    const time = i / FS;
    xs.push(time);
    if (time < CAL_DUR) {
      // square 1 mV calibration pulse
      ys.push(time >= 0.07 && time < 0.24 ? 1.0 : 0.0);
    } else {
      const tb = (time - CAL_DUR) % PERIOD;
      ys.push(p.flip * ecgValue(tb, p));
    }
  }
  return { xs, ys };
}

// Per-lead morphology profiles (p=P-gain, r=R-gain, s=S-gain, t=T-gain, flip=polarity)
const PROFILE = {
  I: { p: 1.0, r: 0.75, s: 0.25, t: 0.9, flip: 1 },
  II: { p: 1.2, r: 1.05, s: 0.3, t: 1.1, flip: 1 },
  III: { p: 0.7, r: 0.55, s: 0.35, t: 0.55, flip: 1 },
  aVR: { p: 1.0, r: 0.6, s: 0.2, t: 0.9, flip: -1 },
  aVL: { p: 0.6, r: 0.5, s: 0.3, t: 0.5, flip: 1 },
  aVF: { p: 0.9, r: 0.8, s: 0.25, t: 0.8, flip: 1 },
  V1: { p: 0.7, r: 0.3, s: 1.0, t: -0.5, flip: 1 },
  V2: { p: 0.8, r: 0.55, s: 1.35, t: 0.5, flip: 1 },
  V3: { p: 0.8, r: 0.95, s: 0.95, t: 0.85, flip: 1 },
  V4: { p: 0.85, r: 1.45, s: 0.5, t: 1.0, flip: 1 },
  V5: { p: 0.9, r: 1.4, s: 0.25, t: 1.0, flip: 1 },
  V6: { p: 0.9, r: 1.1, s: 0.15, t: 0.9, flip: 1 },
};

// Standard clinical 3x4 layout (read left-to-right per row)
const GRID_LEADS = [
  ["I", "aVR", "V1", "V4"],
  ["II", "aVL", "V2", "V5"],
  ["III", "aVF", "V3", "V6"],
];

// --- Layout geometry (CSS px in the mount space) ---------------------------
const W = window.ANYPLOT_SIZE.width;
const H = window.ANYPLOT_SIZE.height;
const PAD = 16;
const TITLE_H = 44;
const GAP = 8;
const RHYTHM_H = 150;
const innerW = W - 2 * PAD;
const gridH = H - 2 * PAD - TITLE_H - GAP - RHYTHM_H - GAP;
const cellW = (innerW - 3 * GAP) / 4;
const cellH = (gridH - 2 * GAP) / 3;

// Common voltage window so every lead shares the standard 10 mm/mV scale
const Y_MIN = -1.7;
const Y_MAX = 1.9;

const STRIP_SECONDS = 2.5;
const RHYTHM_SECONDS = 6.0;

function ecgPaper() {
  const SM = 8; // 1 mm minor square
  const BIG = SM * 5; // 5 mm major square
  return {
    backgroundColor: t.pageBg,
    backgroundImage: [
      `repeating-linear-gradient(0deg, ${GRID_MAJOR}, ${GRID_MAJOR} 1px, transparent 1px, transparent ${BIG}px)`,
      `repeating-linear-gradient(90deg, ${GRID_MAJOR}, ${GRID_MAJOR} 1px, transparent 1px, transparent ${BIG}px)`,
      `repeating-linear-gradient(0deg, ${GRID_MINOR}, ${GRID_MINOR} 1px, transparent 1px, transparent ${SM}px)`,
      `repeating-linear-gradient(90deg, ${GRID_MINOR}, ${GRID_MINOR} 1px, transparent 1px, transparent ${SM}px)`,
    ].join(", "),
  };
}

function LeadTrace(props) {
  const { strip, width, height } = props;
  return (
    <LineChart
      width={width}
      height={height}
      margin={{ top: 24, right: 8, bottom: 8, left: 8 }}
      skipAnimation
      leftAxis={null}
      bottomAxis={null}
      xAxis={[{ data: strip.xs, scaleType: "linear", min: 0, max: strip.xs[strip.xs.length - 1] }]}
      yAxis={[{ min: Y_MIN, max: Y_MAX }]}
      series={[{ data: strip.ys, color: TRACE, showMark: false, curve: "linear" }]}
      sx={{
        "& .MuiLineElement-root": { strokeWidth: 2.0, strokeLinejoin: "round" },
      }}
    />
  );
}

function LeadPanel(props) {
  const { name, width, height } = props;
  const strip = buildStrip(PROFILE[name], STRIP_SECONDS);
  return (
    <div style={{ position: "relative", width, height, ...ecgPaper() }}>
      <span
        style={{
          position: "absolute",
          top: 4,
          left: 8,
          zIndex: 2,
          fontSize: 15,
          fontWeight: 700,
          color: t.ink,
          background: isLight ? "rgba(250,248,241,0.7)" : "rgba(26,26,23,0.7)",
          padding: "0 4px",
          borderRadius: 2,
        }}
      >
        {name}
      </span>
      <LeadTrace strip={strip} width={width} height={height} />
    </div>
  );
}

// --- Chart (default-exported component — the harness mounts it) -------------
export default function Chart() {
  const rhythm = buildStrip(PROFILE.II, RHYTHM_SECONDS);
  return (
    <div
      style={{
        width: W,
        height: H,
        boxSizing: "border-box",
        padding: PAD,
        display: "flex",
        flexDirection: "column",
        gap: GAP,
        background: t.pageBg,
        fontFamily:
          '-apple-system, BlinkMacSystemFont, "Segoe UI", Roboto, Helvetica, Arial, sans-serif',
      }}
    >
      {/* Header */}
      <div
        style={{
          height: TITLE_H,
          display: "flex",
          alignItems: "baseline",
          justifyContent: "space-between",
        }}
      >
        <span style={{ fontSize: 22, fontWeight: 700, color: t.ink }}>
          ecg-twelve-lead · javascript · muix · anyplot.ai
        </span>
        <span style={{ fontSize: 17, color: t.inkSoft }}>
          Normal sinus rhythm · 25 mm/s · 10 mm/mV · 1 mV calibration
        </span>
      </div>

      {/* 3x4 lead grid */}
      <div
        style={{
          display: "grid",
          gridTemplateColumns: `repeat(4, ${cellW}px)`,
          gridTemplateRows: `repeat(3, ${cellH}px)`,
          gap: GAP,
        }}
      >
        {GRID_LEADS.flat().map((name) => (
          <LeadPanel key={name} name={name} width={cellW} height={cellH} />
        ))}
      </div>

      {/* Full-length Lead II rhythm strip */}
      <div style={{ position: "relative", width: innerW, height: RHYTHM_H, ...ecgPaper() }}>
        <span
          style={{
            position: "absolute",
            top: 4,
            left: 8,
            zIndex: 2,
            fontSize: 15,
            fontWeight: 700,
            color: t.ink,
            background: isLight ? "rgba(250,248,241,0.7)" : "rgba(26,26,23,0.7)",
            padding: "0 4px",
            borderRadius: 2,
          }}
        >
          II · rhythm
        </span>
        <LineChart
          width={innerW}
          height={RHYTHM_H}
          margin={{ top: 24, right: 8, bottom: 8, left: 8 }}
          skipAnimation
          leftAxis={null}
          bottomAxis={null}
          xAxis={[{ data: rhythm.xs, scaleType: "linear", min: 0, max: rhythm.xs[rhythm.xs.length - 1] }]}
          yAxis={[{ min: Y_MIN, max: Y_MAX }]}
          series={[{ data: rhythm.ys, color: TRACE, showMark: false, curve: "linear" }]}
          sx={{ "& .MuiLineElement-root": { strokeWidth: 2.0, strokeLinejoin: "round" } }}
        />
      </div>
    </div>
  );
}
Runnable source as JSON, for any HTTP client: https://api.anyplot.ai/specs/ecg-twelve-lead/muix/code. Any spec id and library id listed in llms-full.txt fit the same URL shape; every URL below is complete and callable.
{
  "spec_id": "ecg-twelve-lead",
  "language": "javascript",
  "library": "muix",
  "page": "https://anyplot.ai/ecg-twelve-lead/javascript/muix",
  "hub": "https://anyplot.ai/ecg-twelve-lead",
  "code_json": "https://api.anyplot.ai/specs/ecg-twelve-lead/muix/code",
  "spec_json": "https://api.anyplot.ai/specs/ecg-twelve-lead",
  "render_light_png": "https://storage.googleapis.com/anyplot-images/plots/ecg-twelve-lead/javascript/muix/plot-light.png",
  "render_dark_png": "https://storage.googleapis.com/anyplot-images/plots/ecg-twelve-lead/javascript/muix/plot-dark.png",
  "interactive_light_html": "https://storage.googleapis.com/anyplot-images/plots/ecg-twelve-lead/javascript/muix/plot-light.html",
  "interactive_dark_html": "https://storage.googleapis.com/anyplot-images/plots/ecg-twelve-lead/javascript/muix/plot-dark.html",
  "quality_score": 93.0,
  "license": "MIT",
  "guide": "https://anyplot.ai/llms.txt"
}
Part of ECG/EKG 12-Lead Waveform Display on anyplot.ai.