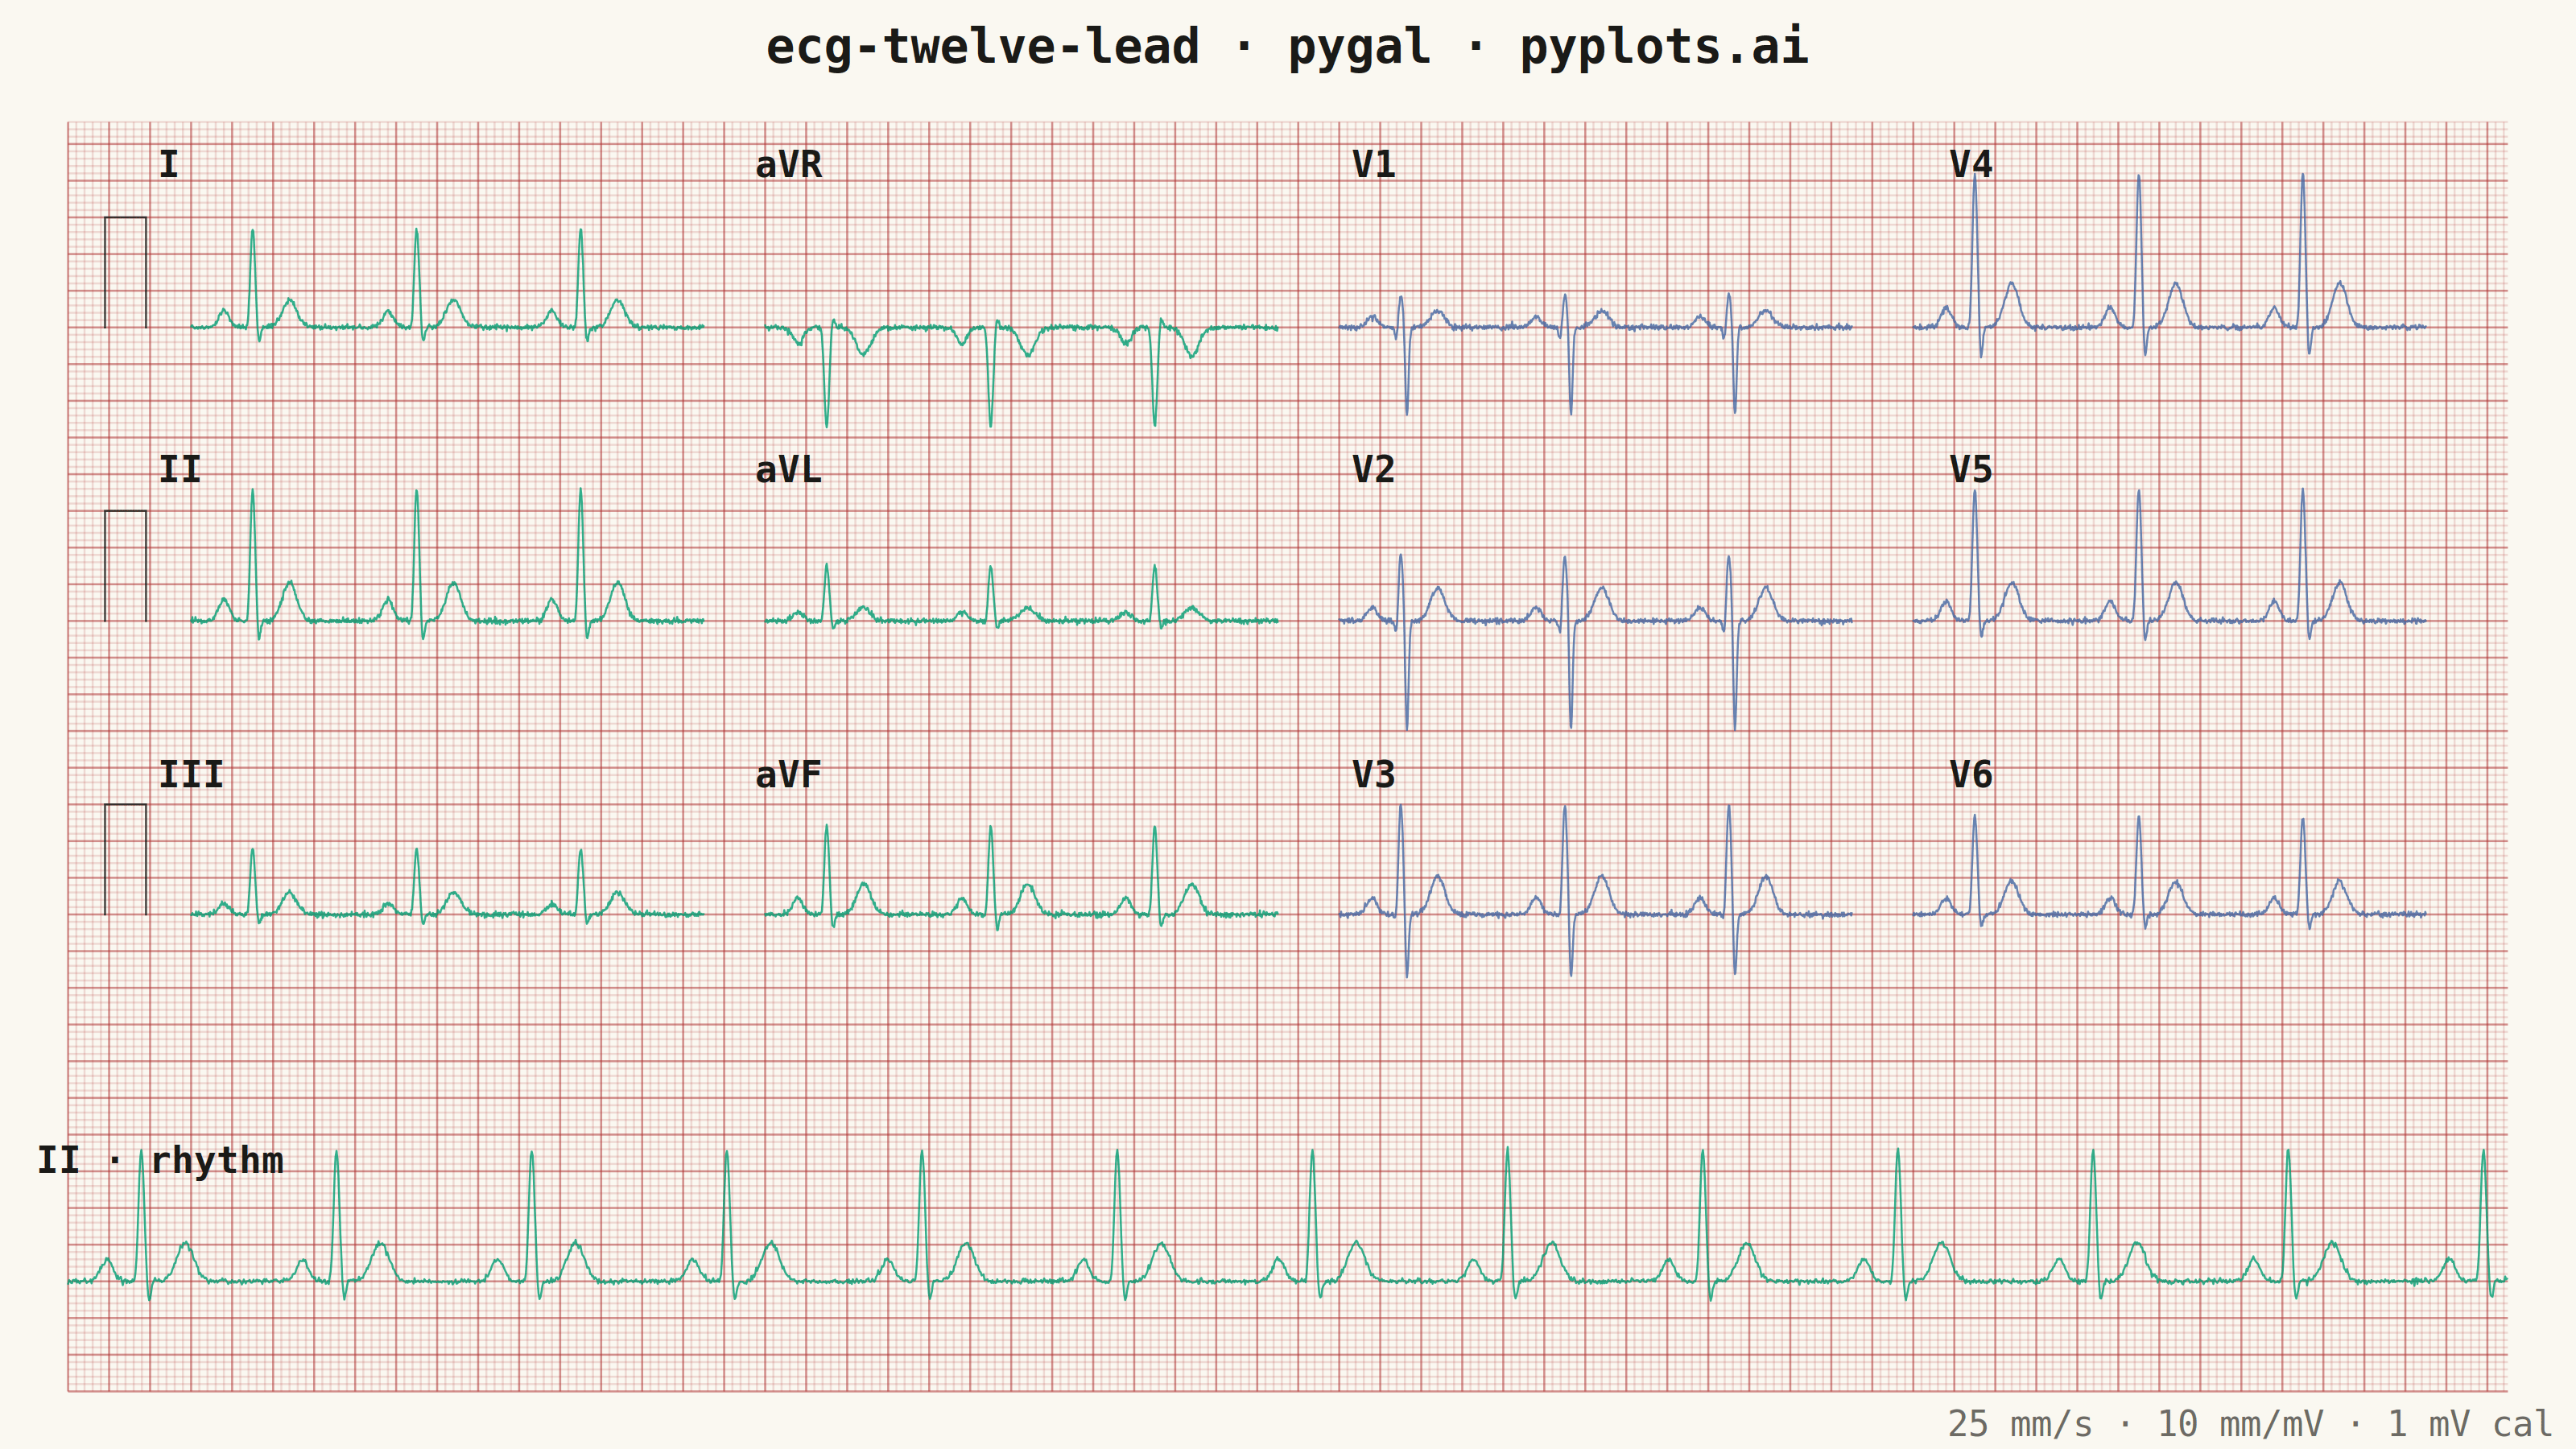
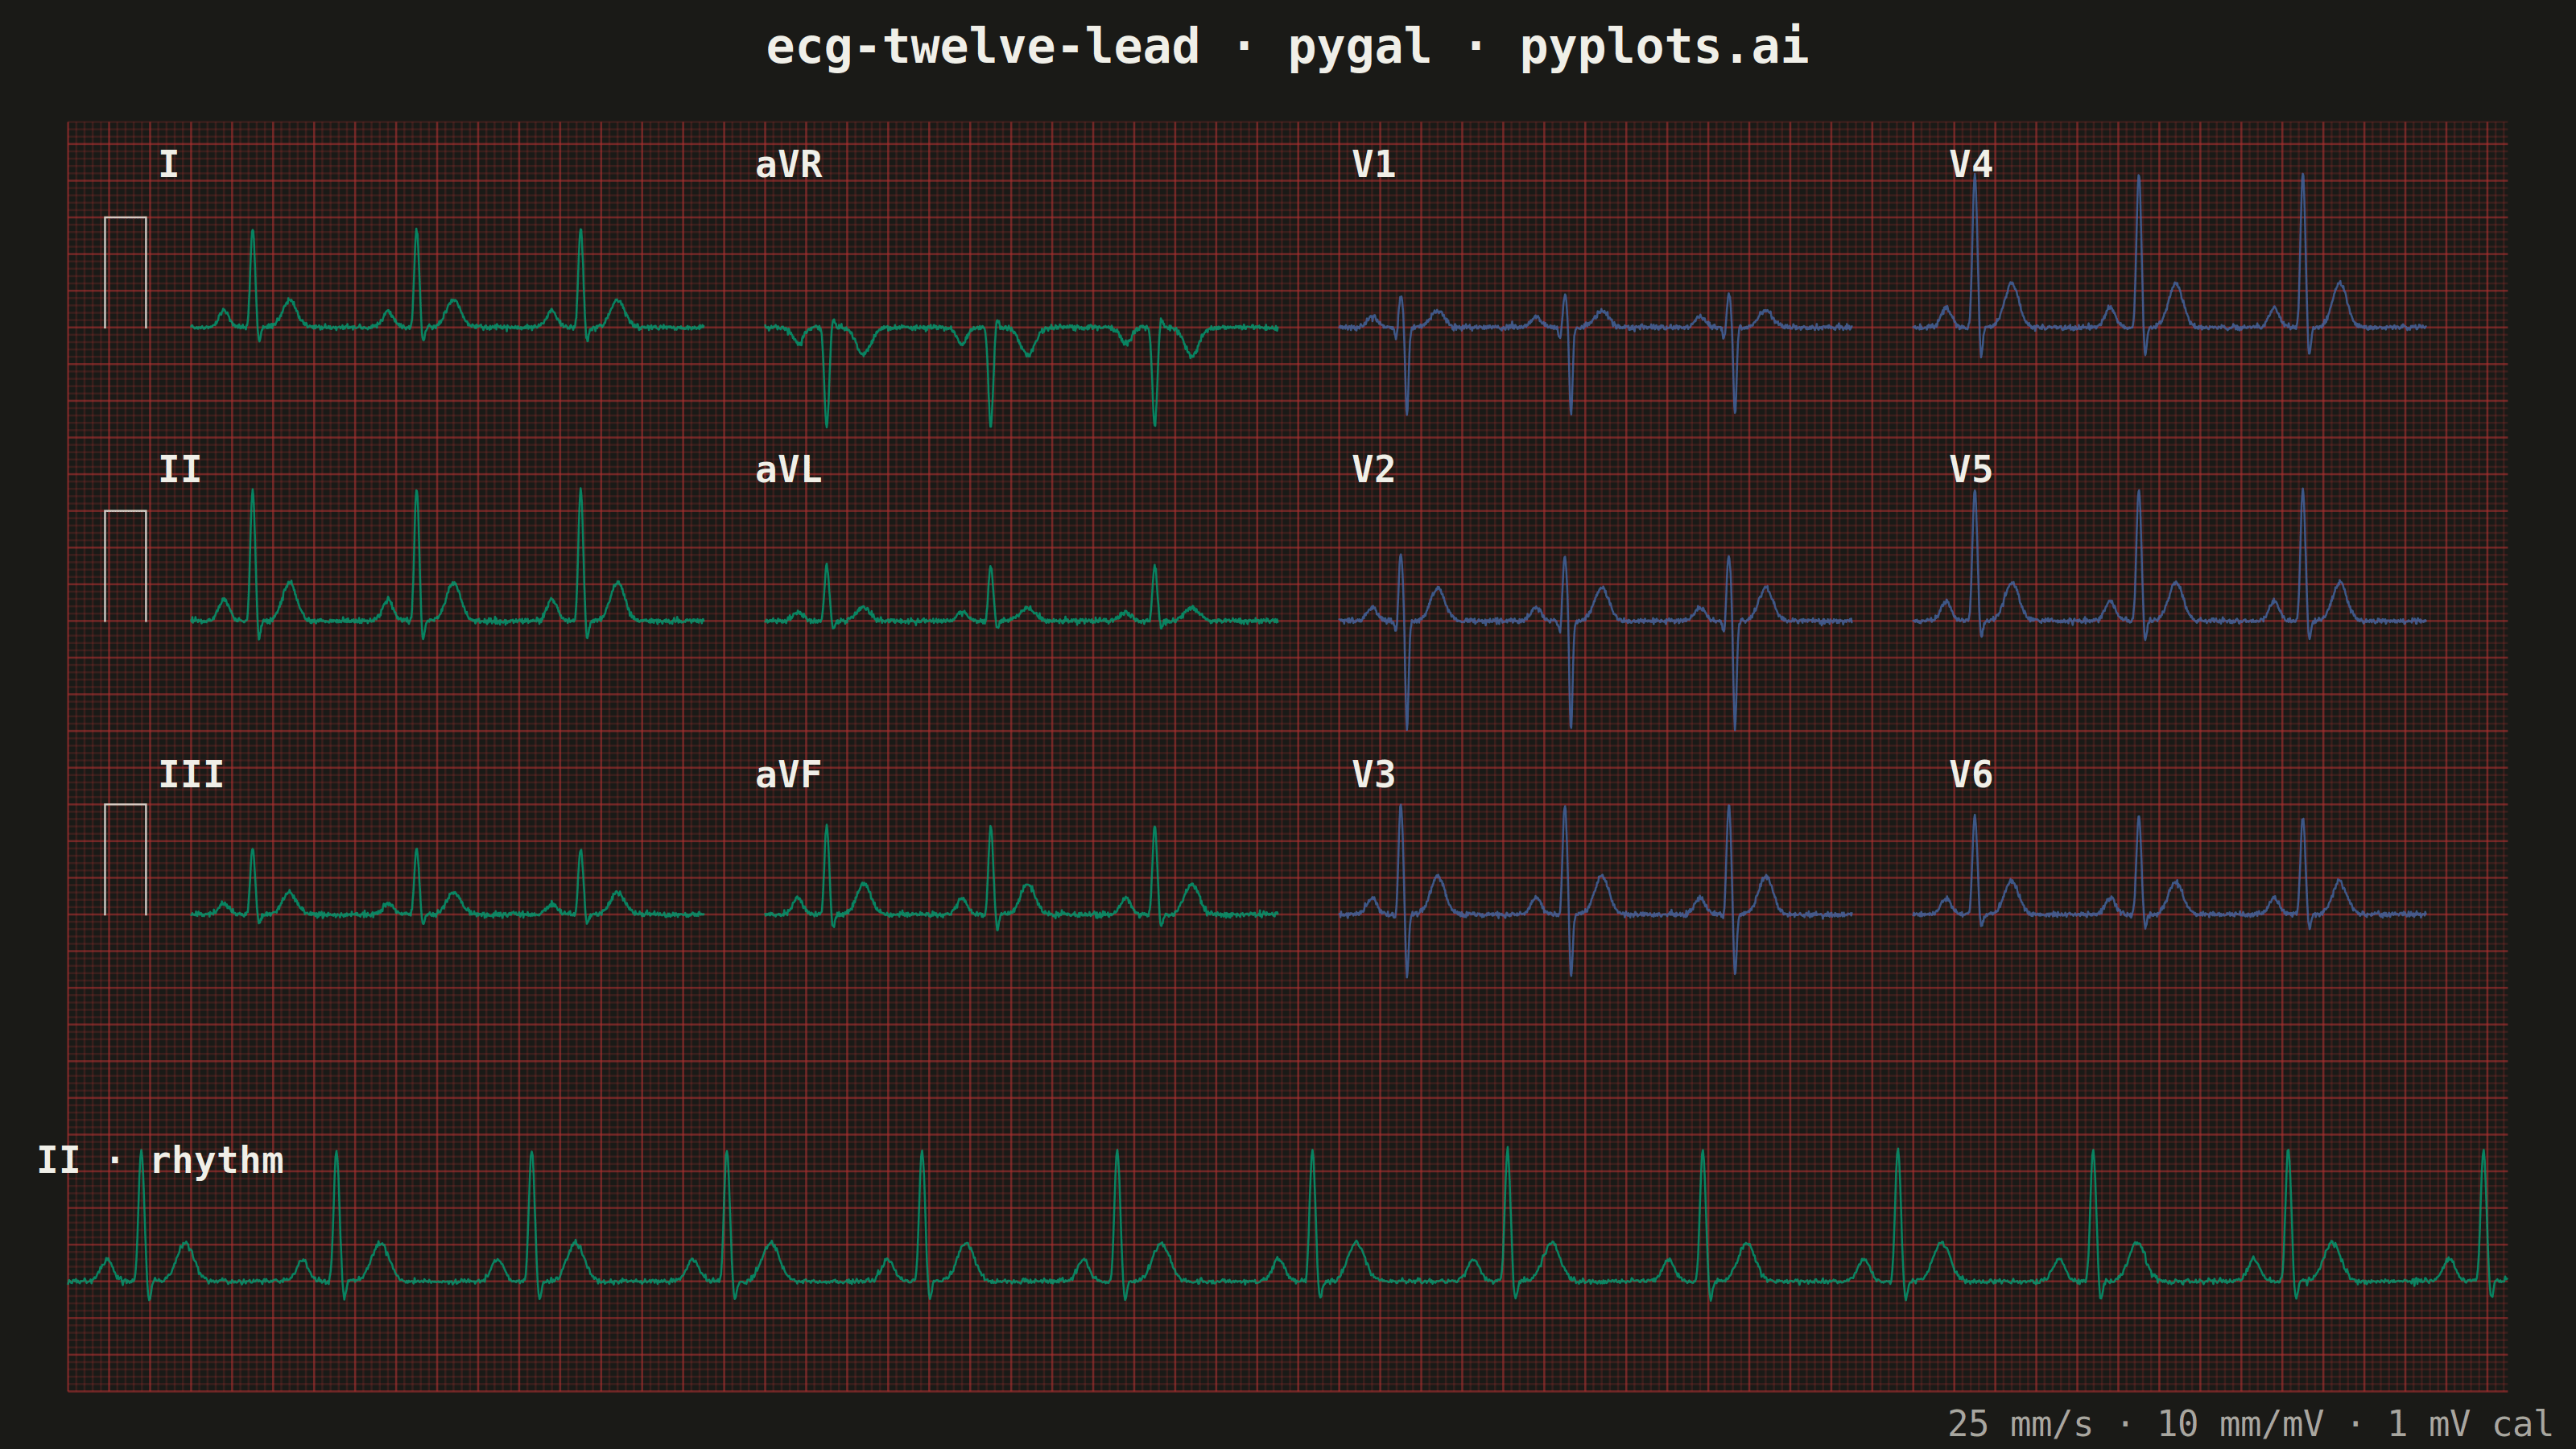
A multi-channel electrocardiogram display showing the 12 standard ECG leads arranged in clinical format. Each lead displays realistic P-QRS-T wave complexes on a medical-standard grid background with calibration markers. This visualization replicates the familiar layout used in hospitals and clinics worldwide, making it immediately recognizable to healthcare professionals and useful for medical education.
""" anyplot.ai
ecg-twelve-lead: ECG/EKG 12-Lead Waveform Display
Library: pygal 3.1.0 | Python 3.13.13
Quality: 90/100 | Updated: 2026-06-17
"""

import os

import cairosvg
import numpy as np
import pygal
from pygal.style import Style


# Theme-adaptive chrome (Imprint palette) — single script renders both themes
THEME = os.getenv("ANYPLOT_THEME", "light")
PAGE_BG = "#FAF8F1" if THEME == "light" else "#1A1A17"
INK = "#1A1A17" if THEME == "light" else "#F0EFE8"
INK_MUTED = "#6B6A63" if THEME == "light" else "#A8A79F"

# Imprint palette positions used here:
#   limb leads      -> brand green  #009E73 (first categorical series, always)
#   precordial V1-6 -> blue         #4467A3
#   ECG paper grid  -> matte red    #AE3030 (semantic: ECG grid is universally red)
LIMB = "#009E73"
PRECORDIAL = "#4467A3"
# Grid intensity tuned per theme so the red ECG grid reads on cream and near-black.
GRID_MAJOR = "rgba(174,48,48,0.55)" if THEME == "light" else "rgba(174,48,48,0.60)"
GRID_MINOR = "rgba(174,48,48,0.20)" if THEME == "light" else "rgba(174,48,48,0.26)"

# Data — synthetic ECG via Gaussian pulse model (flat script, no helper functions)
np.random.seed(42)
sampling_rate = 1000
duration = 2.5
num_samples = int(sampling_rate * duration)
t = np.linspace(0, duration, num_samples)
cycle_duration = 0.8

# Lead parameters: (p_amp, q_amp, r_amp, s_amp, t_amp)
lead_params = {
    "I": (0.15, -0.08, 0.9, -0.15, 0.25),
    "II": (0.20, -0.10, 1.2, -0.20, 0.35),
    "III": (0.10, -0.05, 0.6, -0.10, 0.20),
    "aVR": (-0.15, 0.05, -0.9, 0.10, -0.25),
    "aVL": (0.08, -0.06, 0.5, -0.08, 0.12),
    "aVF": (0.15, -0.08, 0.8, -0.15, 0.28),
    "V1": (0.10, -0.15, 0.3, -0.80, 0.15),
    "V2": (0.12, -0.20, 0.6, -1.00, 0.30),
    "V3": (0.15, -0.15, 1.0, -0.60, 0.35),
    "V4": (0.18, -0.10, 1.4, -0.30, 0.40),
    "V5": (0.18, -0.08, 1.2, -0.20, 0.35),
    "V6": (0.15, -0.06, 0.9, -0.15, 0.30),
}

# Generate all lead signals inline
leads = {}
for name, (p_a, q_a, r_a, s_a, t_a) in lead_params.items():
    signal = np.zeros_like(t)
    for cycle_start in np.arange(0, duration, cycle_duration):
        tc = t - cycle_start
        mask = (tc >= 0) & (tc < cycle_duration)
        signal[mask] += p_a * np.exp(-((tc[mask] - 0.16) ** 2) / (2 * 0.025**2))
        signal[mask] += q_a * np.exp(-((tc[mask] - 0.28) ** 2) / (2 * 0.008**2))
        signal[mask] += r_a * np.exp(-((tc[mask] - 0.30) ** 2) / (2 * 0.012**2))
        signal[mask] += s_a * np.exp(-((tc[mask] - 0.33) ** 2) / (2 * 0.008**2))
        signal[mask] += t_a * np.exp(-((tc[mask] - 0.48) ** 2) / (2 * 0.035**2))
    signal += np.random.normal(0, 0.012, len(t))
    leads[name] = signal

# Rhythm strip (Lead II, longer duration)
rhythm_duration = 10.0
rhythm_samples = int(rhythm_duration * sampling_rate)
rhythm_t = np.linspace(0, rhythm_duration, rhythm_samples)
rhythm_signal = np.zeros(rhythm_samples)
for cycle_start in np.arange(0, rhythm_duration, cycle_duration):
    tc = rhythm_t - cycle_start
    mask = (tc >= 0) & (tc < cycle_duration)
    rhythm_signal[mask] += 0.20 * np.exp(-((tc[mask] - 0.16) ** 2) / (2 * 0.025**2))
    rhythm_signal[mask] += -0.10 * np.exp(-((tc[mask] - 0.28) ** 2) / (2 * 0.008**2))
    rhythm_signal[mask] += 1.2 * np.exp(-((tc[mask] - 0.30) ** 2) / (2 * 0.012**2))
    rhythm_signal[mask] += -0.20 * np.exp(-((tc[mask] - 0.33) ** 2) / (2 * 0.008**2))
    rhythm_signal[mask] += 0.35 * np.exp(-((tc[mask] - 0.48) ** 2) / (2 * 0.035**2))
rhythm_signal += np.random.normal(0, 0.012, rhythm_samples)

# Clinical 3x4 grid layout
grid_layout = [["I", "aVR", "V1", "V4"], ["II", "aVL", "V2", "V5"], ["III", "aVF", "V3", "V6"]]

# Layout parameters (data units)
col_width = 2.5
col_gap = 0.3
col_offset = col_width + col_gap
row_height = 4.0
num_rows = 3
num_cols = 4
amp_scale = 1.5

# Chart coordinate range
x_min = -0.6
x_max = num_cols * col_offset + 0.1
y_min = -num_rows * row_height - 2.5
y_max = row_height * 0.7

# Canvas (hard rule: landscape 3200x1800) and margins (kept pure so the
# injected-label affine transform below matches pygal's plot box).
WIDTH, HEIGHT = 3200, 1800
M_TOP, M_BOTTOM, M_LEFT, M_RIGHT = 120, 40, 24, 24

# Series colors in add() order: 4 grid + 3 calibration + 12 waveforms + 1 rhythm
grid_colors = (GRID_MAJOR, GRID_MAJOR, GRID_MINOR, GRID_MINOR)
cal_colors = (INK,) * num_rows
waveform_colors = ()
for row_leads in grid_layout:
    for lead_name in row_leads:
        waveform_colors += (PRECORDIAL,) if lead_name.startswith("V") else (LIMB,)
rhythm_color = (LIMB,)
all_colors = grid_colors + cal_colors + waveform_colors + rhythm_color

ecg_style = Style(
    background=PAGE_BG,
    plot_background=PAGE_BG,
    foreground=INK,
    foreground_strong=INK,
    foreground_subtle=INK_MUTED,
    colors=all_colors,
    label_font_size=0,
    major_label_font_size=0,
    legend_font_size=0,
    value_font_size=0,
    stroke_width=2.5,
    font_family="monospace",
)

chart = pygal.XY(
    width=WIDTH,
    height=HEIGHT,
    style=ecg_style,
    show_dots=False,
    stroke=True,
    show_x_guides=False,
    show_y_guides=False,
    show_legend=False,
    show_x_labels=False,
    show_y_labels=False,
    allow_interruptions=True,
    js=[],
    print_values=False,
    margin_top=M_TOP,
    margin_bottom=M_BOTTOM,
    margin_left=M_LEFT,
    margin_right=M_RIGHT,
    range=(y_min, y_max),
    xrange=(x_min, x_max),
)

# ECG paper grid — major lines every 0.5 mV / 0.2 s, minor every 0.1 mV / 0.04 s
major_h = []
for y_val in np.arange(y_min, y_max + 0.01, 0.5):
    major_h.extend([(x_min, float(y_val)), (x_max, float(y_val)), None])
chart.add(None, major_h, show_dots=False, stroke_style={"width": 1.6})

major_v = []
for x_val in np.arange(x_min, x_max + 0.01, 0.2):
    major_v.extend([(float(x_val), y_min), (float(x_val), y_max), None])
chart.add(None, major_v, show_dots=False, stroke_style={"width": 1.6})

minor_h = []
for y_val in np.arange(y_min, y_max + 0.01, 0.1):
    minor_h.extend([(x_min, float(y_val)), (x_max, float(y_val)), None])
chart.add(None, minor_h, show_dots=False, stroke_style={"width": 0.6})

minor_v = []
for x_val in np.arange(x_min, x_max + 0.01, 0.04):
    minor_v.extend([(float(x_val), y_min), (float(x_val), y_max), None])
chart.add(None, minor_v, show_dots=False, stroke_style={"width": 0.6})

# 1 mV calibration pulse at the left margin of each row
for row in range(num_rows):
    y_base = -row * row_height
    cal = [(-0.42, y_base), (-0.42, y_base + 1.0 * amp_scale), (-0.22, y_base + 1.0 * amp_scale), (-0.22, y_base)]
    chart.add(None, cal, show_dots=False, stroke_style={"width": 3.0, "linecap": "square", "linejoin": "miter"})

# ECG waveforms — limb leads green, precordial leads blue (downsampled for size)
ds = 3
t_ds = t[::ds]
for row_idx, row_leads in enumerate(grid_layout):
    for col_idx, lead_name in enumerate(row_leads):
        signal = leads[lead_name][::ds] * amp_scale
        x_off = col_idx * col_offset
        y_off = -row_idx * row_height
        pts = list(zip((t_ds + x_off).tolist(), (signal + y_off).tolist(), strict=True))
        stroke_w = 3.6 if lead_name.startswith("V") else 3.0
        chart.add(None, pts, show_dots=False, stroke_style={"width": stroke_w, "linecap": "round", "linejoin": "round"})

# Lead II rhythm strip across the bottom (full width)
rhythm_x_scale = (x_max - x_min) / rhythm_duration
rhythm_ds = 4
rx = rhythm_t[::rhythm_ds] * rhythm_x_scale + x_min
ry = rhythm_signal[::rhythm_ds] * amp_scale + (-num_rows * row_height - 1.0)
rhythm_pts = list(zip(rx.tolist(), ry.tolist(), strict=True))
chart.add(None, rhythm_pts, show_dots=False, stroke_style={"width": 3.2, "linecap": "round", "linejoin": "round"})

# Render SVG, then inject title + lead labels + scale annotation as text.
svg = chart.render(is_unicode=True)

# Affine transform: data coords -> source pixels within the pure margin box.
plot_x0, plot_w = M_LEFT, WIDTH - M_LEFT - M_RIGHT
plot_y0, plot_h = M_TOP, HEIGHT - M_TOP - M_BOTTOM


def to_px(x, y):
    px = plot_x0 + (x - x_min) / (x_max - x_min) * plot_w
    py = plot_y0 + (y_max - y) / (y_max - y_min) * plot_h
    return px, py


labels_svg = ""

# Title (centered, INK)
labels_svg += (
    f'<text x="{WIDTH / 2:.0f}" y="78" font-family="monospace" font-size="60" '
    f'font-weight="bold" text-anchor="middle" fill="{INK}">'
    "ecg-twelve-lead · python · pygal · anyplot.ai</text>\n"
)

# Lead labels above each waveform
for row_idx, row_leads in enumerate(grid_layout):
    for col_idx, lead_name in enumerate(row_leads):
        x_off = col_idx * col_offset
        y_off = -row_idx * row_height
        px, py = to_px(x_off + 0.05, y_off + 1.75)
        labels_svg += (
            f'<text x="{px:.0f}" y="{py:.0f}" font-family="monospace" font-size="46" '
            f'font-weight="bold" fill="{INK}">{lead_name}</text>\n'
        )

# Rhythm strip label
rpx, rpy = to_px(x_min + 0.08, -num_rows * row_height - 1.0 + 1.7)
labels_svg += (
    f'<text x="{rpx:.0f}" y="{rpy:.0f}" font-family="monospace" font-size="46" '
    f'font-weight="bold" fill="{INK}">II · rhythm</text>\n'
)

# Single scale annotation, bottom-right (no longer duplicated with x_title)
labels_svg += (
    f'<text x="{WIDTH - M_RIGHT - 6}" y="{HEIGHT - 16}" font-family="monospace" '
    f'font-size="44" fill="{INK_MUTED}" text-anchor="end">'
    "25 mm/s · 10 mm/mV · 1 mV cal</text>\n"
)

svg = svg.replace("</svg>", labels_svg + "</svg>")

# Save — theme-suffixed PNG (gallery) + HTML (interactive detail view)
with open(f"plot-{THEME}.html", "w") as f:
    f.write(svg)
cairosvg.svg2png(bytestring=svg.encode("utf-8"), write_to=f"plot-{THEME}.png", output_width=WIDTH, output_height=HEIGHT)
Runnable source as JSON, for any HTTP client: https://api.anyplot.ai/specs/ecg-twelve-lead/pygal/code. Any spec id and library id listed in llms-full.txt fit the same URL shape; every URL below is complete and callable.
{
  "spec_id": "ecg-twelve-lead",
  "language": "python",
  "library": "pygal",
  "page": "https://anyplot.ai/ecg-twelve-lead/python/pygal",
  "hub": "https://anyplot.ai/ecg-twelve-lead",
  "code_json": "https://api.anyplot.ai/specs/ecg-twelve-lead/pygal/code",
  "spec_json": "https://api.anyplot.ai/specs/ecg-twelve-lead",
  "render_light_png": "https://storage.googleapis.com/anyplot-images/plots/ecg-twelve-lead/python/pygal/plot-light.png",
  "render_dark_png": "https://storage.googleapis.com/anyplot-images/plots/ecg-twelve-lead/python/pygal/plot-dark.png",
  "interactive_light_html": "https://storage.googleapis.com/anyplot-images/plots/ecg-twelve-lead/python/pygal/plot-light.html",
  "interactive_dark_html": "https://storage.googleapis.com/anyplot-images/plots/ecg-twelve-lead/python/pygal/plot-dark.html",
  "quality_score": 90.0,
  "license": "MIT",
  "guide": "https://anyplot.ai/llms.txt"
}
Part of ECG/EKG 12-Lead Waveform Display on anyplot.ai.