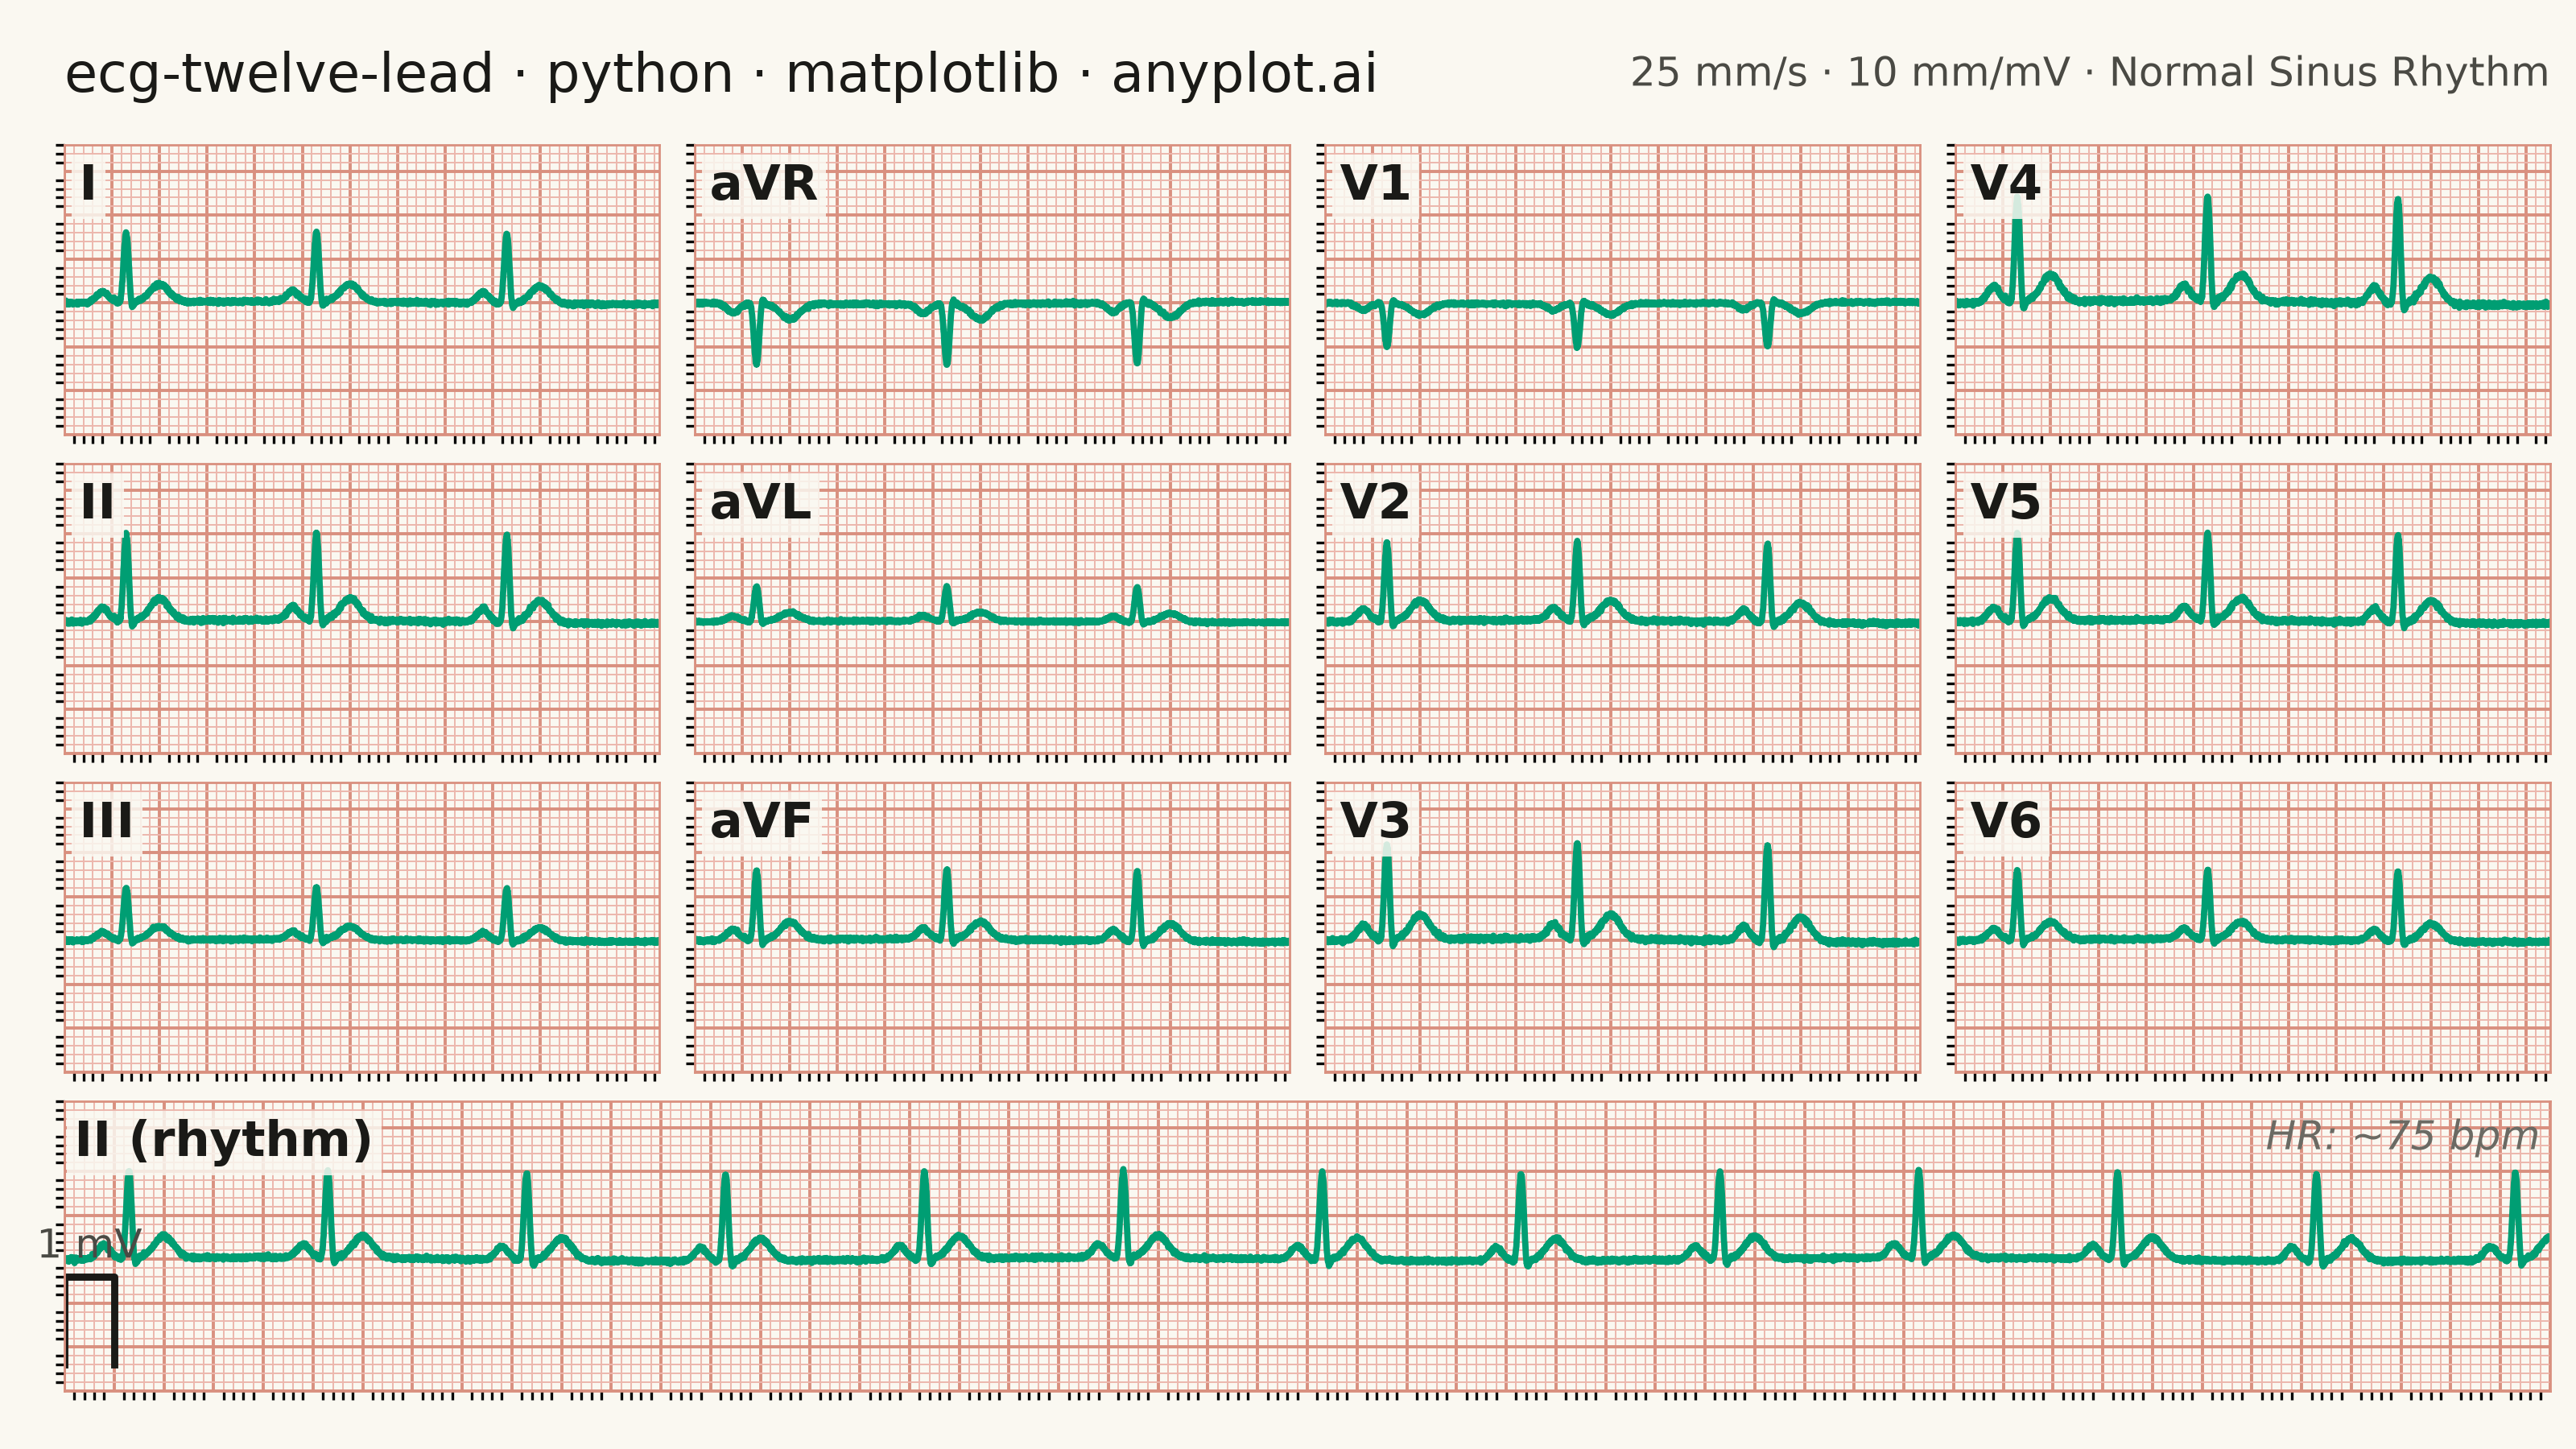
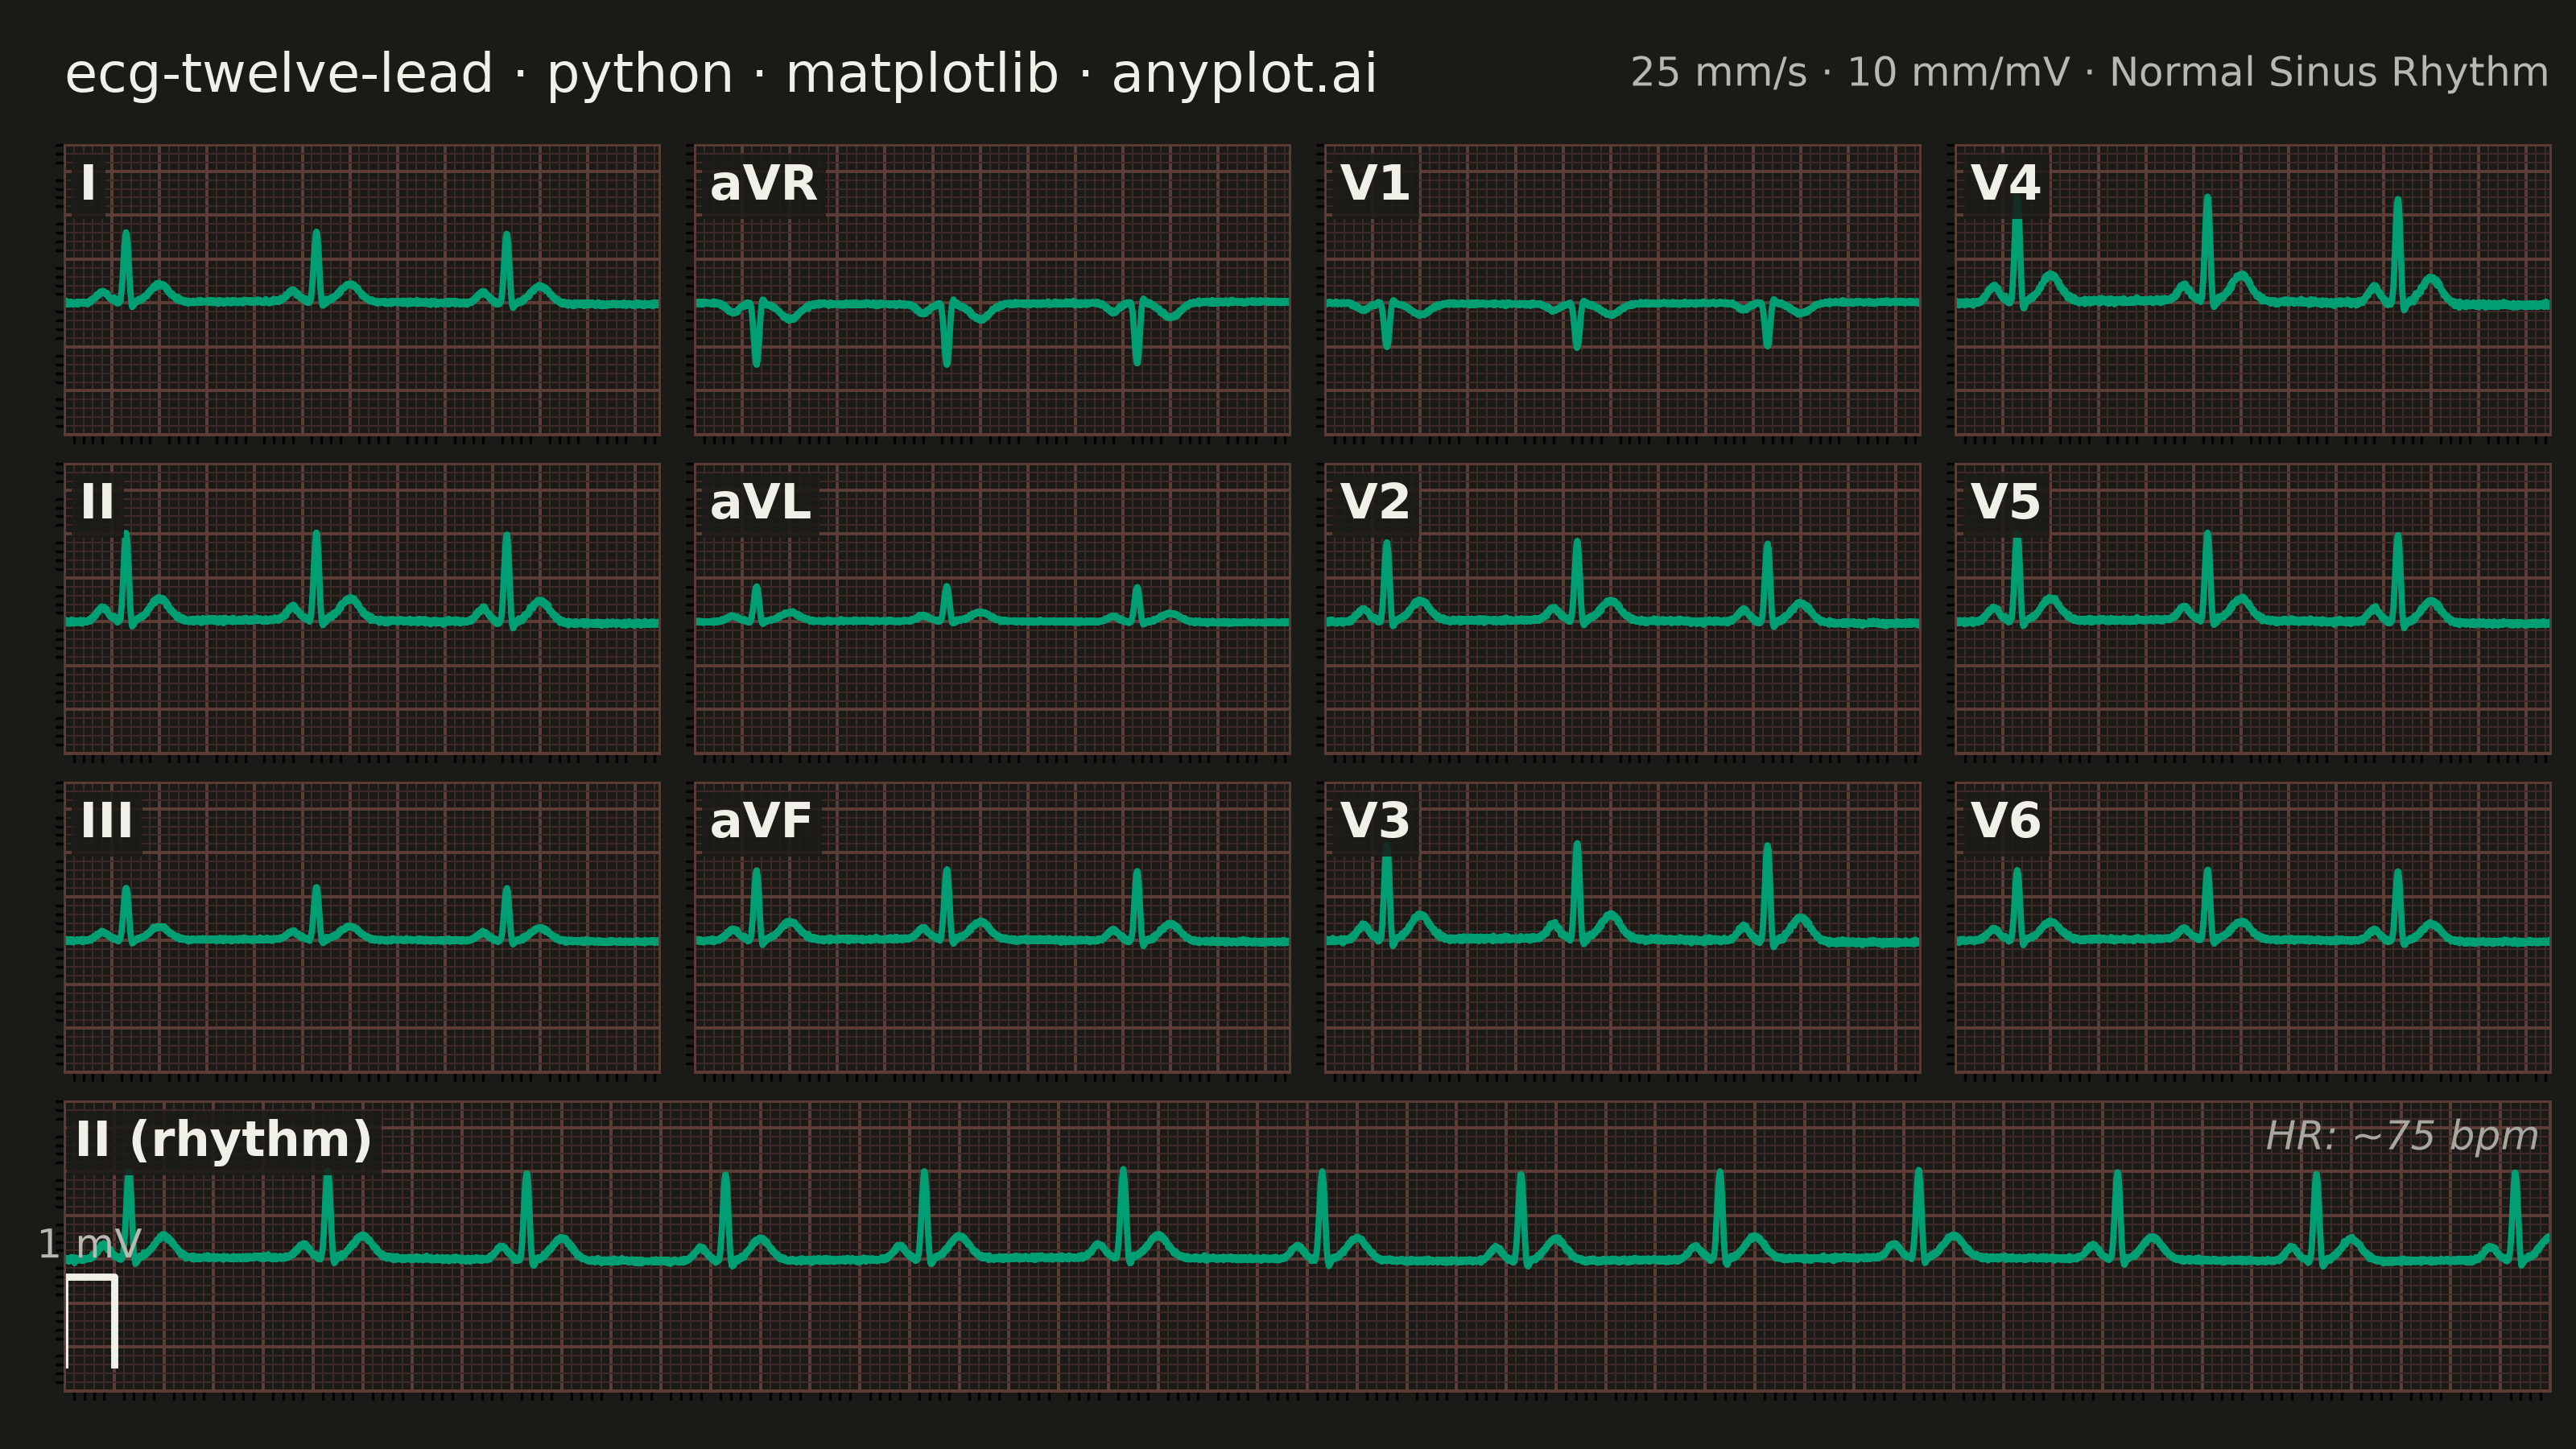
A multi-channel electrocardiogram display showing the 12 standard ECG leads arranged in clinical format. Each lead displays realistic P-QRS-T wave complexes on a medical-standard grid background with calibration markers. This visualization replicates the familiar layout used in hospitals and clinics worldwide, making it immediately recognizable to healthcare professionals and useful for medical education.
""" anyplot.ai
ecg-twelve-lead: ECG/EKG 12-Lead Waveform Display
Library: matplotlib 3.11.0 | Python 3.13.14
Quality: 90/100 | Updated: 2026-06-17
"""

import os

import matplotlib.pyplot as plt
import matplotlib.ticker as ticker
import numpy as np


# Theme-adaptive chrome (Imprint palette + theme tokens)
THEME = os.getenv("ANYPLOT_THEME", "light")
PAGE_BG = "#FAF8F1" if THEME == "light" else "#1A1A17"
INK = "#1A1A17" if THEME == "light" else "#F0EFE8"
INK_SOFT = "#4A4A44" if THEME == "light" else "#B8B7B0"
INK_MUTED = "#6B6A63" if THEME == "light" else "#A8A79F"

# ECG trace — Imprint brand green (position 1), the classic cardiac-monitor hue
TRACE = "#009E73"
# ECG paper grid — domain-standard red ruling, dialed for each surface
GRID_MINOR = "#ECB7AD" if THEME == "light" else "#3E2A27"
GRID_MAJOR = "#D9907F" if THEME == "light" else "#5E3D37"

np.random.seed(42)

# Data — synthetic ECG using a Gaussian-based P-QRS-T model
sampling_rate = 1000
duration = 2.5
t = np.linspace(0, duration, int(sampling_rate * duration), endpoint=False)

# Beat parameters: (amplitude mV, center within beat s, width s)
wave_params = [
    (0.15, 0.16, 0.025),  # P wave
    (-0.10, 0.24, 0.008),  # Q wave
    (1.00, 0.26, 0.012),  # R wave
    (-0.20, 0.28, 0.008),  # S wave
    (0.25, 0.40, 0.040),  # T wave
]

beat_period = 0.8  # ~75 bpm
n_beats = int(np.ceil(duration / beat_period)) + 1


def build_signal(time_axis):
    """Sum Gaussian P-QRS-T peaks across beats, plus baseline wander + noise."""
    n = int(np.ceil(time_axis[-1] / beat_period)) + 1
    sig = np.zeros_like(time_axis)
    for i in range(n):
        ts = time_axis - i * beat_period
        for amp, center, width in wave_params:
            sig += amp * np.exp(-((ts - center) ** 2) / (2 * width**2))
    sig += 0.02 * np.sin(2 * np.pi * 0.3 * time_axis)
    sig += np.random.normal(0, 0.01, len(time_axis))
    return sig


signal_template = build_signal(t)

# Lead-specific scaling (scale_factor, invert_flag) for realistic morphology
lead_config = {
    "I": (0.8, False),
    "II": (1.0, False),
    "III": (0.6, False),
    "aVR": (0.7, True),
    "aVL": (0.4, False),
    "aVF": (0.8, False),
    "V1": (0.5, True),
    "V2": (0.9, False),
    "V3": (1.1, False),
    "V4": (1.2, False),
    "V5": (1.0, False),
    "V6": (0.8, False),
}

leads = {}
for name, (scale, invert) in lead_config.items():
    sig = signal_template * scale
    sig += np.random.normal(0, 0.005, len(t))
    leads[name] = -sig if invert else sig

# Rhythm strip: 10 s of Lead II
t_long = np.linspace(0, 10.0, int(sampling_rate * 10.0), endpoint=False)
signal_long = build_signal(t_long)

# Standard clinical 3x4 grid layout
grid_layout = [["I", "aVR", "V1", "V4"], ["II", "aVL", "V2", "V5"], ["III", "aVF", "V3", "V6"]]

# Plot — landscape 3200x1800 (figsize 8x4.5 @ dpi 400), no bbox_inches="tight"
fig = plt.figure(figsize=(8, 4.5), dpi=400, facecolor=PAGE_BG)
gs = fig.add_gridspec(4, 4, hspace=0.10, wspace=0.06, left=0.025, right=0.99, top=0.90, bottom=0.04)


def setup_ecg_grid(ax, x_min, x_max, y_min=-1.5, y_max=1.8):
    """ECG paper grid via matplotlib's native tick/grid system."""
    ax.set_facecolor(PAGE_BG)
    ax.set_xlim(x_min, x_max)
    ax.set_ylim(y_min, y_max)

    # Major grid at 5 mm (0.2 s / 0.5 mV); minor grid at 1 mm (0.04 s / 0.1 mV)
    ax.xaxis.set_major_locator(ticker.MultipleLocator(0.2))
    ax.yaxis.set_major_locator(ticker.MultipleLocator(0.5))
    ax.xaxis.set_minor_locator(ticker.MultipleLocator(0.04))
    ax.yaxis.set_minor_locator(ticker.MultipleLocator(0.1))

    ax.grid(which="minor", color=GRID_MINOR, linewidth=0.35)
    ax.grid(which="major", color=GRID_MAJOR, linewidth=0.7)

    ax.set_xticklabels([])
    ax.set_yticklabels([])
    ax.tick_params(axis="both", length=0)
    for spine in ax.spines.values():
        spine.set_linewidth(0.5)
        spine.set_color(GRID_MAJOR)


for row_idx, row_leads in enumerate(grid_layout):
    for col_idx, lead_name in enumerate(row_leads):
        ax = fig.add_subplot(gs[row_idx, col_idx])
        setup_ecg_grid(ax, 0, duration)
        ax.plot(t, leads[lead_name], color=TRACE, linewidth=1.4)
        ax.text(
            0.025,
            0.94,
            lead_name,
            transform=ax.transAxes,
            fontsize=11,
            fontweight="bold",
            color=INK,
            va="top",
            bbox={"boxstyle": "square,pad=0.15", "facecolor": PAGE_BG, "edgecolor": "none", "alpha": 0.85},
        )

# Rhythm strip (Lead II, full width)
ax_rhythm = fig.add_subplot(gs[3, :])
setup_ecg_grid(ax_rhythm, 0, 10.0)
ax_rhythm.plot(t_long, signal_long, color=TRACE, linewidth=1.4)
ax_rhythm.text(
    0.004,
    0.94,
    "II (rhythm)",
    transform=ax_rhythm.transAxes,
    fontsize=11,
    fontweight="bold",
    color=INK,
    va="top",
    bbox={"boxstyle": "square,pad=0.15", "facecolor": PAGE_BG, "edgecolor": "none", "alpha": 0.85},
)

# 1 mV calibration pulse
ax_rhythm.plot([0.0, 0.0, 0.2, 0.2], [-1.2, -0.2, -0.2, -1.2], color=INK, linewidth=1.6)
ax_rhythm.text(0.10, 0.02, "1 mV", fontsize=9, ha="center", color=INK_SOFT, fontweight="medium")

# Heart-rate annotation
ax_rhythm.text(
    0.996,
    0.94,
    "HR: ~75 bpm",
    transform=ax_rhythm.transAxes,
    fontsize=9,
    ha="right",
    va="top",
    color=INK_MUTED,
    fontstyle="italic",
)

# Title + metadata
fig.suptitle(
    "ecg-twelve-lead · python · matplotlib · anyplot.ai",
    fontsize=12,
    fontweight="medium",
    x=0.025,
    y=0.965,
    ha="left",
    color=INK,
)
fig.text(0.99, 0.962, "25 mm/s · 10 mm/mV · Normal Sinus Rhythm", fontsize=9, ha="right", va="top", color=INK_SOFT)

# Save — theme-suffixed PNG, bbox_inches stays default (None)
plt.savefig(f"plot-{THEME}.png", dpi=400, facecolor=PAGE_BG)
Runnable source as JSON, for any HTTP client: https://api.anyplot.ai/specs/ecg-twelve-lead/matplotlib/code. Any spec id and library id listed in llms-full.txt fit the same URL shape; every URL below is complete and callable.
{
  "spec_id": "ecg-twelve-lead",
  "language": "python",
  "library": "matplotlib",
  "page": "https://anyplot.ai/ecg-twelve-lead/python/matplotlib",
  "hub": "https://anyplot.ai/ecg-twelve-lead",
  "code_json": "https://api.anyplot.ai/specs/ecg-twelve-lead/matplotlib/code",
  "spec_json": "https://api.anyplot.ai/specs/ecg-twelve-lead",
  "render_light_png": "https://storage.googleapis.com/anyplot-images/plots/ecg-twelve-lead/python/matplotlib/plot-light.png",
  "render_dark_png": "https://storage.googleapis.com/anyplot-images/plots/ecg-twelve-lead/python/matplotlib/plot-dark.png",
  "quality_score": 90.0,
  "license": "MIT",
  "guide": "https://anyplot.ai/llms.txt"
}
Part of ECG/EKG 12-Lead Waveform Display on anyplot.ai.