The same plot in 14 other libraries — JavaScript: D3.js, Apache ECharts, Highcharts, MUI X Charts; Python: Altair, Bokeh, lets-plot, Matplotlib, Plotly, plotnine, Pygal, Seaborn; R: ggplot2; Julia: Makie.jl. Compare all 15 side by side: Atomic Energy Level Diagram in Python, R, Julia and JavaScript.
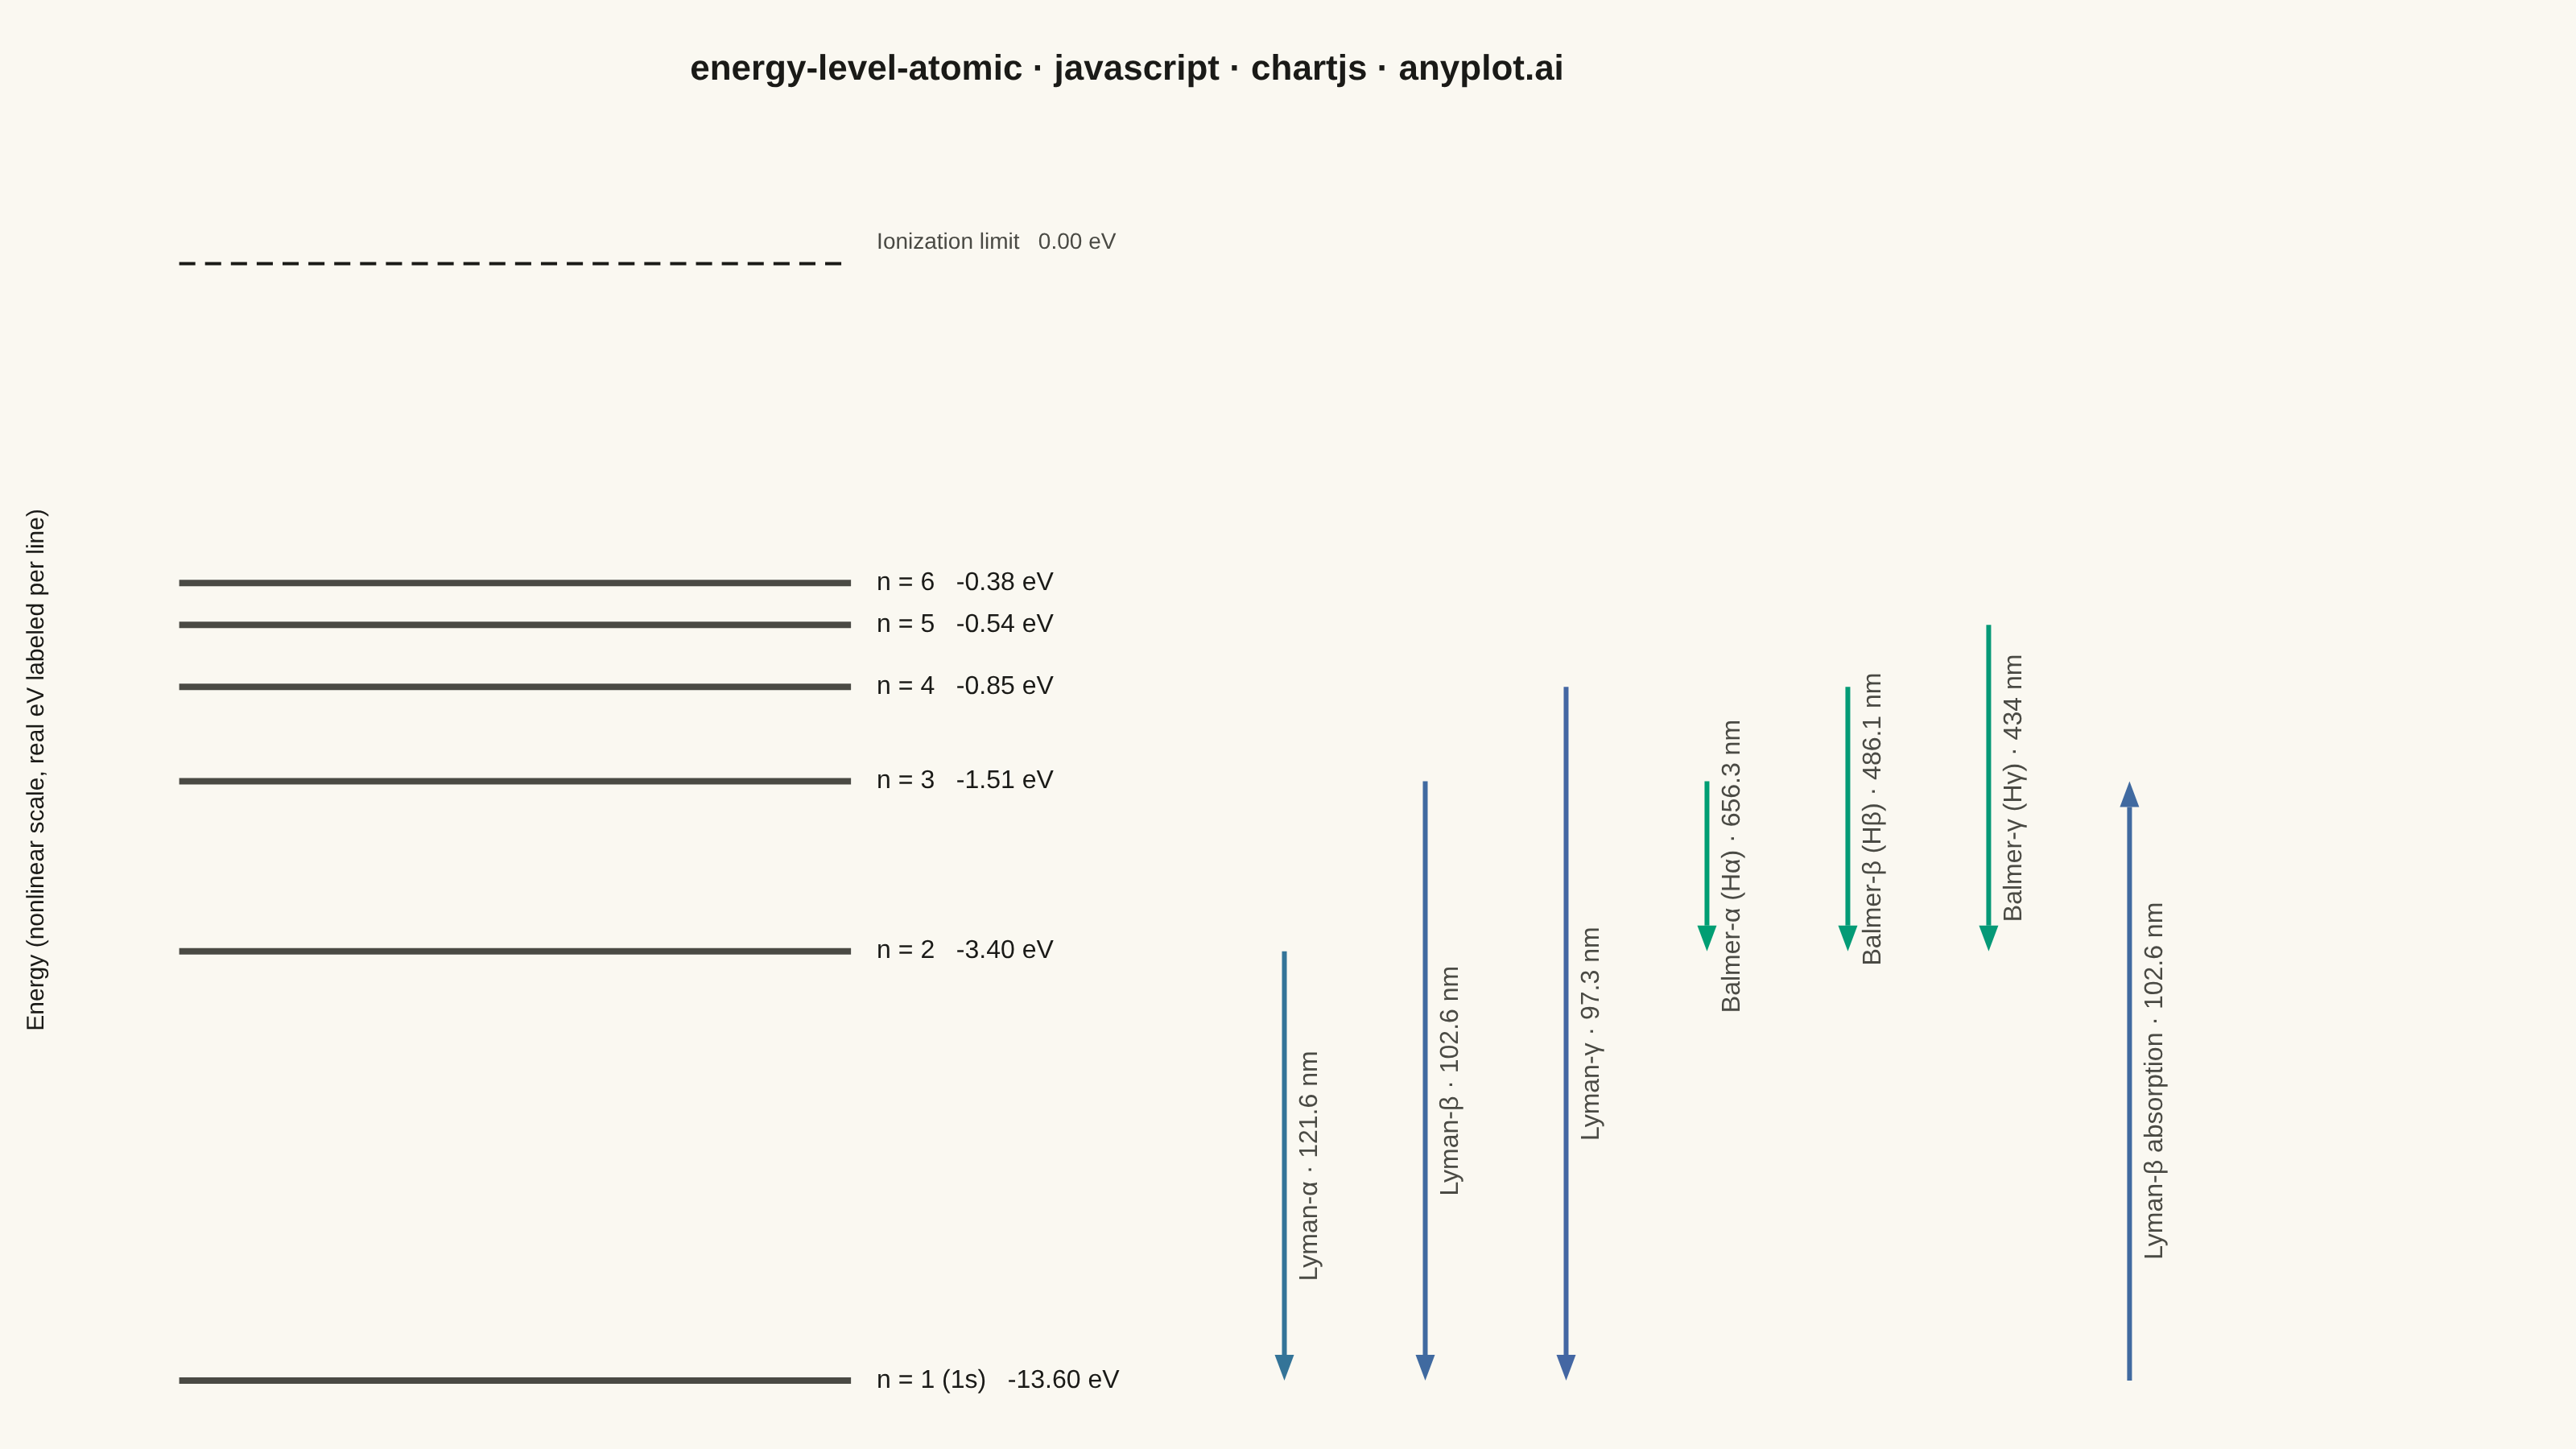
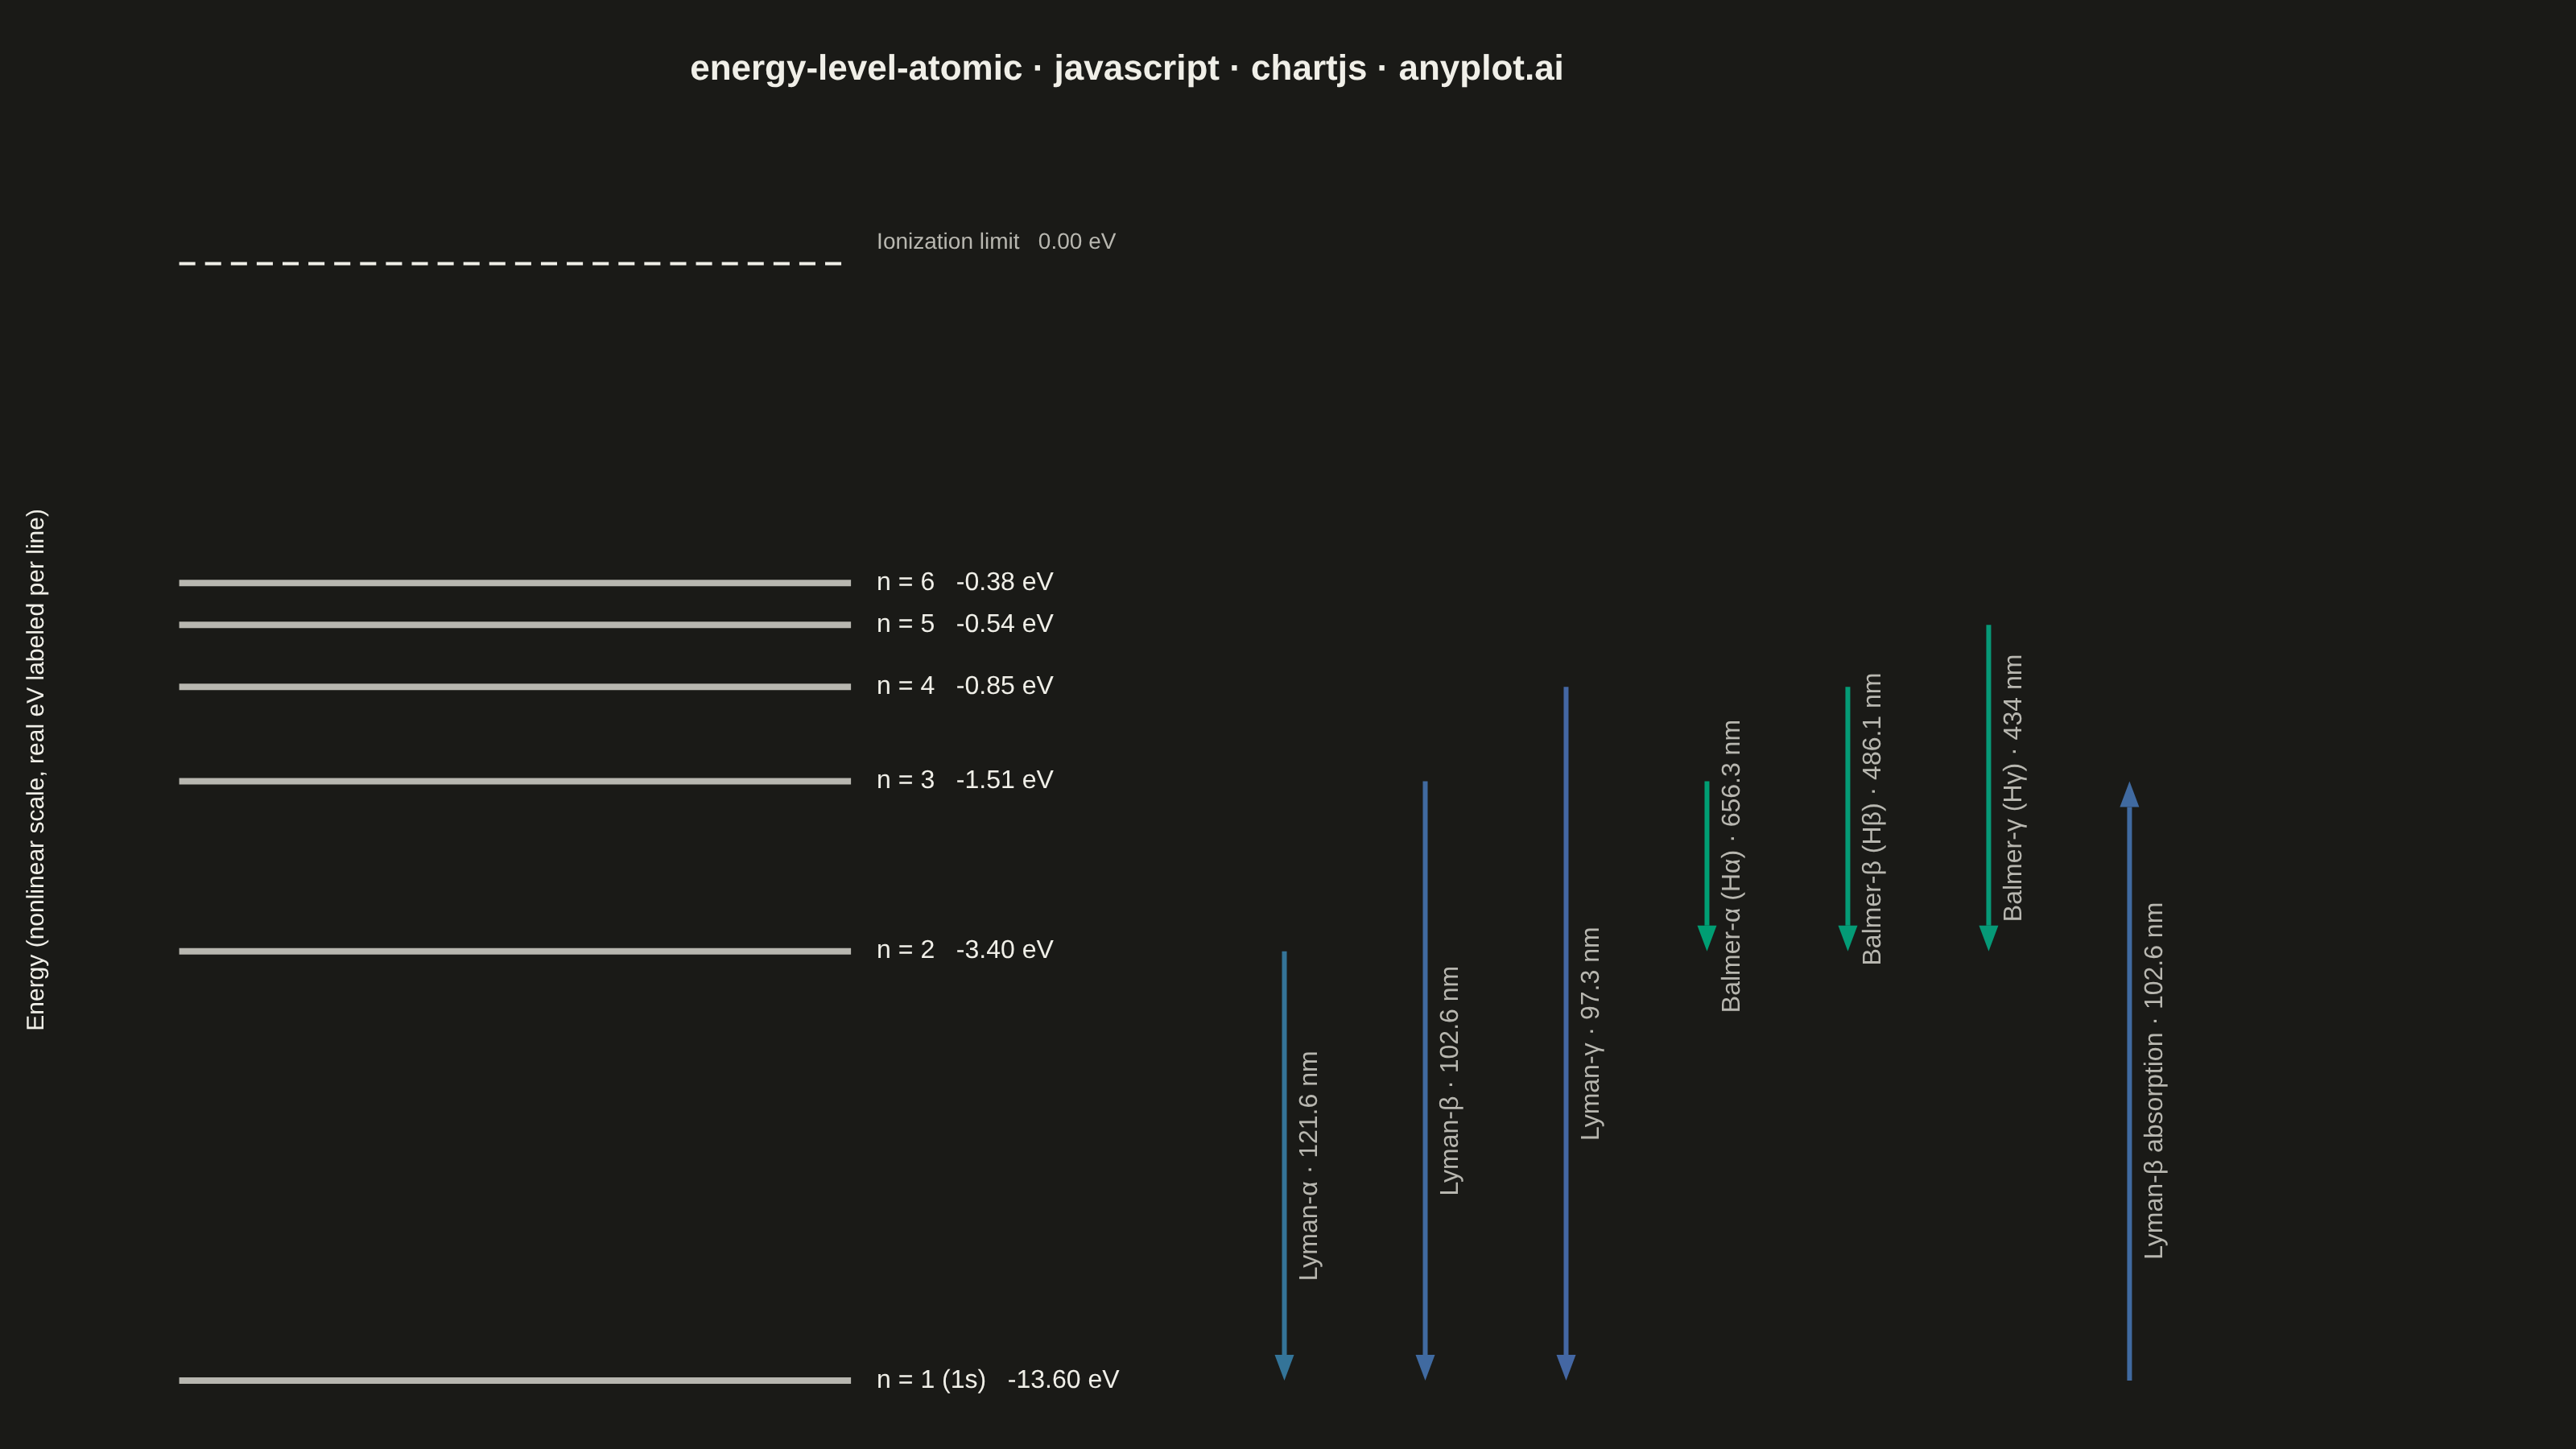
An energy level diagram displays quantized energy states as horizontal lines positioned at their respective energy values, with vertical arrows representing transitions between levels. This visualization reveals the discrete nature of atomic and molecular energy structures, making it essential for understanding spectral series, electron configurations, and quantum state transitions. It provides an intuitive way to connect abstract quantum numbers to observable spectral phenomena.
// anyplot.ai
// energy-level-atomic: Atomic Energy Level Diagram
// Library: chartjs 4.4.7 | JavaScript 22.23.2
// Quality: 93/100 | Updated: 2026-08-25

const t = window.ANYPLOT_TOKENS;

// --- Data: hydrogen atom energy levels (eV) --------------------------------
const levels = [
  { n: 1, label: "n = 1 (1s)", energy: -13.6 },
  { n: 2, label: "n = 2", energy: -3.4 },
  { n: 3, label: "n = 3", energy: -1.51 },
  { n: 4, label: "n = 4", energy: -0.85 },
  { n: 5, label: "n = 5", energy: -0.54 },
  { n: 6, label: "n = 6", energy: -0.38 },
];
const ionizationEnergy = 0;
const levelByN = new Map(levels.map((lvl) => [lvl.n, lvl]));

// Transitions: "from" -> "to" gives the physical direction. Emission drops
// from a higher level to a lower one (arrow points down); absorption climbs
// from a lower level to a higher one (arrow points up).
const transitions = [
  { from: 2, to: 1, series: "Lyman-α", wavelengthNm: 121.6 },
  { from: 3, to: 1, series: "Lyman-β", wavelengthNm: 102.6 },
  { from: 4, to: 1, series: "Lyman-γ", wavelengthNm: 97.3 },
  { from: 3, to: 2, series: "Balmer-α (Hα)", wavelengthNm: 656.3 },
  { from: 4, to: 2, series: "Balmer-β (Hβ)", wavelengthNm: 486.1 },
  { from: 5, to: 2, series: "Balmer-γ (Hγ)", wavelengthNm: 434.0 },
  { from: 1, to: 3, series: "Lyman-β absorption", wavelengthNm: 102.6 },
];

// Levels converge toward the ionization limit as n grows, so a linear energy
// axis crowds n=4..6 into an unreadable sliver. Compress |E| with a power
// law (exponent < 1 spreads high-n levels apart, preserves ordering) and
// label each line with its real eV value directly instead of numeric ticks.
const COMPRESSION = 0.35;
const toPlotY = (energyEv) =>
  energyEv === 0 ? 0 : -Math.pow(Math.abs(energyEv), COMPRESSION);

const deltaEs = transitions.map((tr) =>
  Math.abs(levelByN.get(tr.from).energy - levelByN.get(tr.to).energy),
);
const minDelta = Math.min(...deltaEs);
const maxDelta = Math.max(...deltaEs);

const lerpColor = (hexA, hexB, frac) => {
  const a = parseInt(hexA.slice(1), 16);
  const b = parseInt(hexB.slice(1), 16);
  const ar = (a >> 16) & 255, ag = (a >> 8) & 255, ab = a & 255;
  const br = (b >> 16) & 255, bg = (b >> 8) & 255, bb = b & 255;
  const r = Math.round(ar + (br - ar) * frac);
  const g = Math.round(ag + (bg - ag) * frac);
  const bl = Math.round(ab + (bb - ab) * frac);
  return `rgb(${r}, ${g}, ${bl})`;
};

// --- Layout (x is a 0-1 layout axis, not a data quantity) -------------------
const LEVEL_X0 = 0.05;
const LEVEL_X1 = 0.36;
const ARROW_X0 = 0.56;
const ARROW_X1 = 0.95;

// --- Mount -------------------------------------------------------------------
const canvas = document.createElement("canvas");
document.getElementById("container").appendChild(canvas);

// --- Datasets: each energy level is a short horizontal line segment --------
const levelDatasets = levels.map((lvl) => ({
  label: lvl.label,
  data: [
    { x: LEVEL_X0, y: toPlotY(lvl.energy) },
    { x: LEVEL_X1, y: toPlotY(lvl.energy) },
  ],
  borderColor: t.inkSoft,
  borderWidth: 4,
  pointRadius: 0,
  showLine: true,
}));

// --- Custom plugin: level labels + transition arrows colored by wavelength -
// drawArrow points from (x, yStartPx) to (x, yEndPx); the arrowhead lands at
// the end, so the same helper draws both downward (emission) and upward
// (absorption) arrows depending on which pixel coordinate is larger.
const drawArrow = (ctx, x, yStartPx, yEndPx, color) => {
  const headLen = 16;
  const headWidth = 12;
  const dir = yEndPx >= yStartPx ? 1 : -1;
  const shaftEndPx = yEndPx - dir * headLen;
  ctx.strokeStyle = color;
  ctx.fillStyle = color;
  ctx.lineWidth = 3;
  ctx.beginPath();
  ctx.moveTo(x, yStartPx);
  ctx.lineTo(x, shaftEndPx);
  ctx.stroke();
  ctx.beginPath();
  ctx.moveTo(x - headWidth / 2, shaftEndPx);
  ctx.lineTo(x + headWidth / 2, shaftEndPx);
  ctx.lineTo(x, yEndPx);
  ctx.closePath();
  ctx.fill();
};

// Dashed line whose dash+gap period is rescaled to divide evenly into the
// segment length, so the pattern always ends on a full dash/gap instead of
// leaving a stray partial dash near the endpoint.
const drawEvenDashedLine = (ctx, x0Px, x1Px, yPx, color, dashLen, gapLen, lineWidth) => {
  const totalPx = x1Px - x0Px;
  const period = dashLen + gapLen;
  const periods = Math.max(1, Math.round(totalPx / period));
  const scale = totalPx / (period * periods);
  ctx.save();
  ctx.strokeStyle = color;
  ctx.lineWidth = lineWidth;
  ctx.setLineDash([dashLen * scale, gapLen * scale]);
  ctx.beginPath();
  ctx.moveTo(x0Px, yPx);
  ctx.lineTo(x1Px, yPx);
  ctx.stroke();
  ctx.restore();
};

const energyDiagramPlugin = {
  id: "energyDiagram",
  afterDraw(chart) {
    const { ctx, scales } = chart;
    const xScale = scales.x;
    const yScale = scales.y;
    ctx.save();

    // Ionization line, dashed with a period rescaled to end cleanly (no
    // stray partial dash) right before its label.
    drawEvenDashedLine(
      ctx,
      xScale.getPixelForValue(LEVEL_X0),
      xScale.getPixelForValue(LEVEL_X1),
      yScale.getPixelForValue(toPlotY(ionizationEnergy)),
      t.ink,
      10,
      6,
      2,
    );

    // Level + ionization labels, placed to the right of each line
    ctx.font = "16px sans-serif";
    ctx.textAlign = "left";
    ctx.textBaseline = "middle";
    const labelX = xScale.getPixelForValue(LEVEL_X1) + 16;
    levels.forEach((lvl) => {
      ctx.fillStyle = t.ink;
      ctx.fillText(
        `${lvl.label}   ${lvl.energy.toFixed(2)} eV`,
        labelX,
        yScale.getPixelForValue(toPlotY(lvl.energy)),
      );
    });
    ctx.font = "14px sans-serif";
    ctx.fillStyle = t.inkSoft;
    ctx.textBaseline = "bottom";
    ctx.fillText(
      "Ionization limit   0.00 eV",
      labelX,
      yScale.getPixelForValue(toPlotY(ionizationEnergy)) - 6,
    );

    // Transition arrows, spaced evenly across the right-hand column. Arrow
    // direction follows tr.from -> tr.to: downward for emission (from a
    // higher level to a lower one), upward for absorption (from a lower
    // level to a higher one).
    const step =
      transitions.length > 1
        ? (ARROW_X1 - ARROW_X0) / (transitions.length - 1)
        : 0;
    transitions.forEach((tr, i) => {
      const xData = ARROW_X0 + i * step;
      const xPx = xScale.getPixelForValue(xData);
      const fromEnergy = levelByN.get(tr.from).energy;
      const toEnergy = levelByN.get(tr.to).energy;
      const yStartPx = yScale.getPixelForValue(toPlotY(fromEnergy));
      const yEndPx = yScale.getPixelForValue(toPlotY(toEnergy));
      const deltaE = Math.abs(fromEnergy - toEnergy);
      const frac =
        maxDelta > minDelta ? (deltaE - minDelta) / (maxDelta - minDelta) : 0;
      const color = lerpColor(t.seq[0], t.seq[1], frac);
      drawArrow(ctx, xPx, yStartPx, yEndPx, color);

      ctx.save();
      ctx.translate(xPx + 16, (yStartPx + yEndPx) / 2);
      ctx.rotate(-Math.PI / 2);
      ctx.textAlign = "center";
      ctx.textBaseline = "middle";
      ctx.font = "16px sans-serif";
      ctx.fillStyle = t.inkSoft;
      ctx.fillText(`${tr.series} · ${tr.wavelengthNm} nm`, 0, 0);
      ctx.restore();
    });

    ctx.restore();
  },
};

// --- Chart -------------------------------------------------------------------
const title = "energy-level-atomic · javascript · chartjs · anyplot.ai";

new Chart(canvas, {
  type: "line",
  data: { datasets: levelDatasets },
  options: {
    responsive: true,
    maintainAspectRatio: false,
    animation: false,
    layout: { padding: { top: 20, right: 210, bottom: 10, left: 10 } },
    plugins: {
      title: { display: true, text: title, color: t.ink, font: { size: 22 } },
      legend: { display: false },
    },
    scales: {
      x: { type: "linear", min: 0, max: 1, display: false },
      y: {
        type: "linear",
        min: toPlotY(-15.5),
        max: toPlotY(ionizationEnergy) + 0.35,
        title: {
          display: true,
          text: "Energy (nonlinear scale, real eV labeled per line)",
          color: t.ink,
          font: { size: 15 },
        },
        ticks: { display: false },
        grid: { display: false },
        border: { display: false },
      },
    },
  },
  plugins: [energyDiagramPlugin],
});
Runnable source as JSON, for any HTTP client: https://api.anyplot.ai/specs/energy-level-atomic/chartjs/code. Any spec id and library id listed in llms-full.txt fit the same URL shape; every URL below is complete and callable.
{
  "spec_id": "energy-level-atomic",
  "language": "javascript",
  "library": "chartjs",
  "page": "https://anyplot.ai/energy-level-atomic/javascript/chartjs",
  "hub": "https://anyplot.ai/energy-level-atomic",
  "code_json": "https://api.anyplot.ai/specs/energy-level-atomic/chartjs/code",
  "spec_json": "https://api.anyplot.ai/specs/energy-level-atomic",
  "render_light_png": "https://storage.googleapis.com/anyplot-images/plots/energy-level-atomic/javascript/chartjs/plot-light.png",
  "render_dark_png": "https://storage.googleapis.com/anyplot-images/plots/energy-level-atomic/javascript/chartjs/plot-dark.png",
  "interactive_light_html": "https://storage.googleapis.com/anyplot-images/plots/energy-level-atomic/javascript/chartjs/plot-light.html",
  "interactive_dark_html": "https://storage.googleapis.com/anyplot-images/plots/energy-level-atomic/javascript/chartjs/plot-dark.html",
  "quality_score": 93.0,
  "license": "MIT",
  "guide": "https://anyplot.ai/llms.txt"
}
Part of Atomic Energy Level Diagram on anyplot.ai.