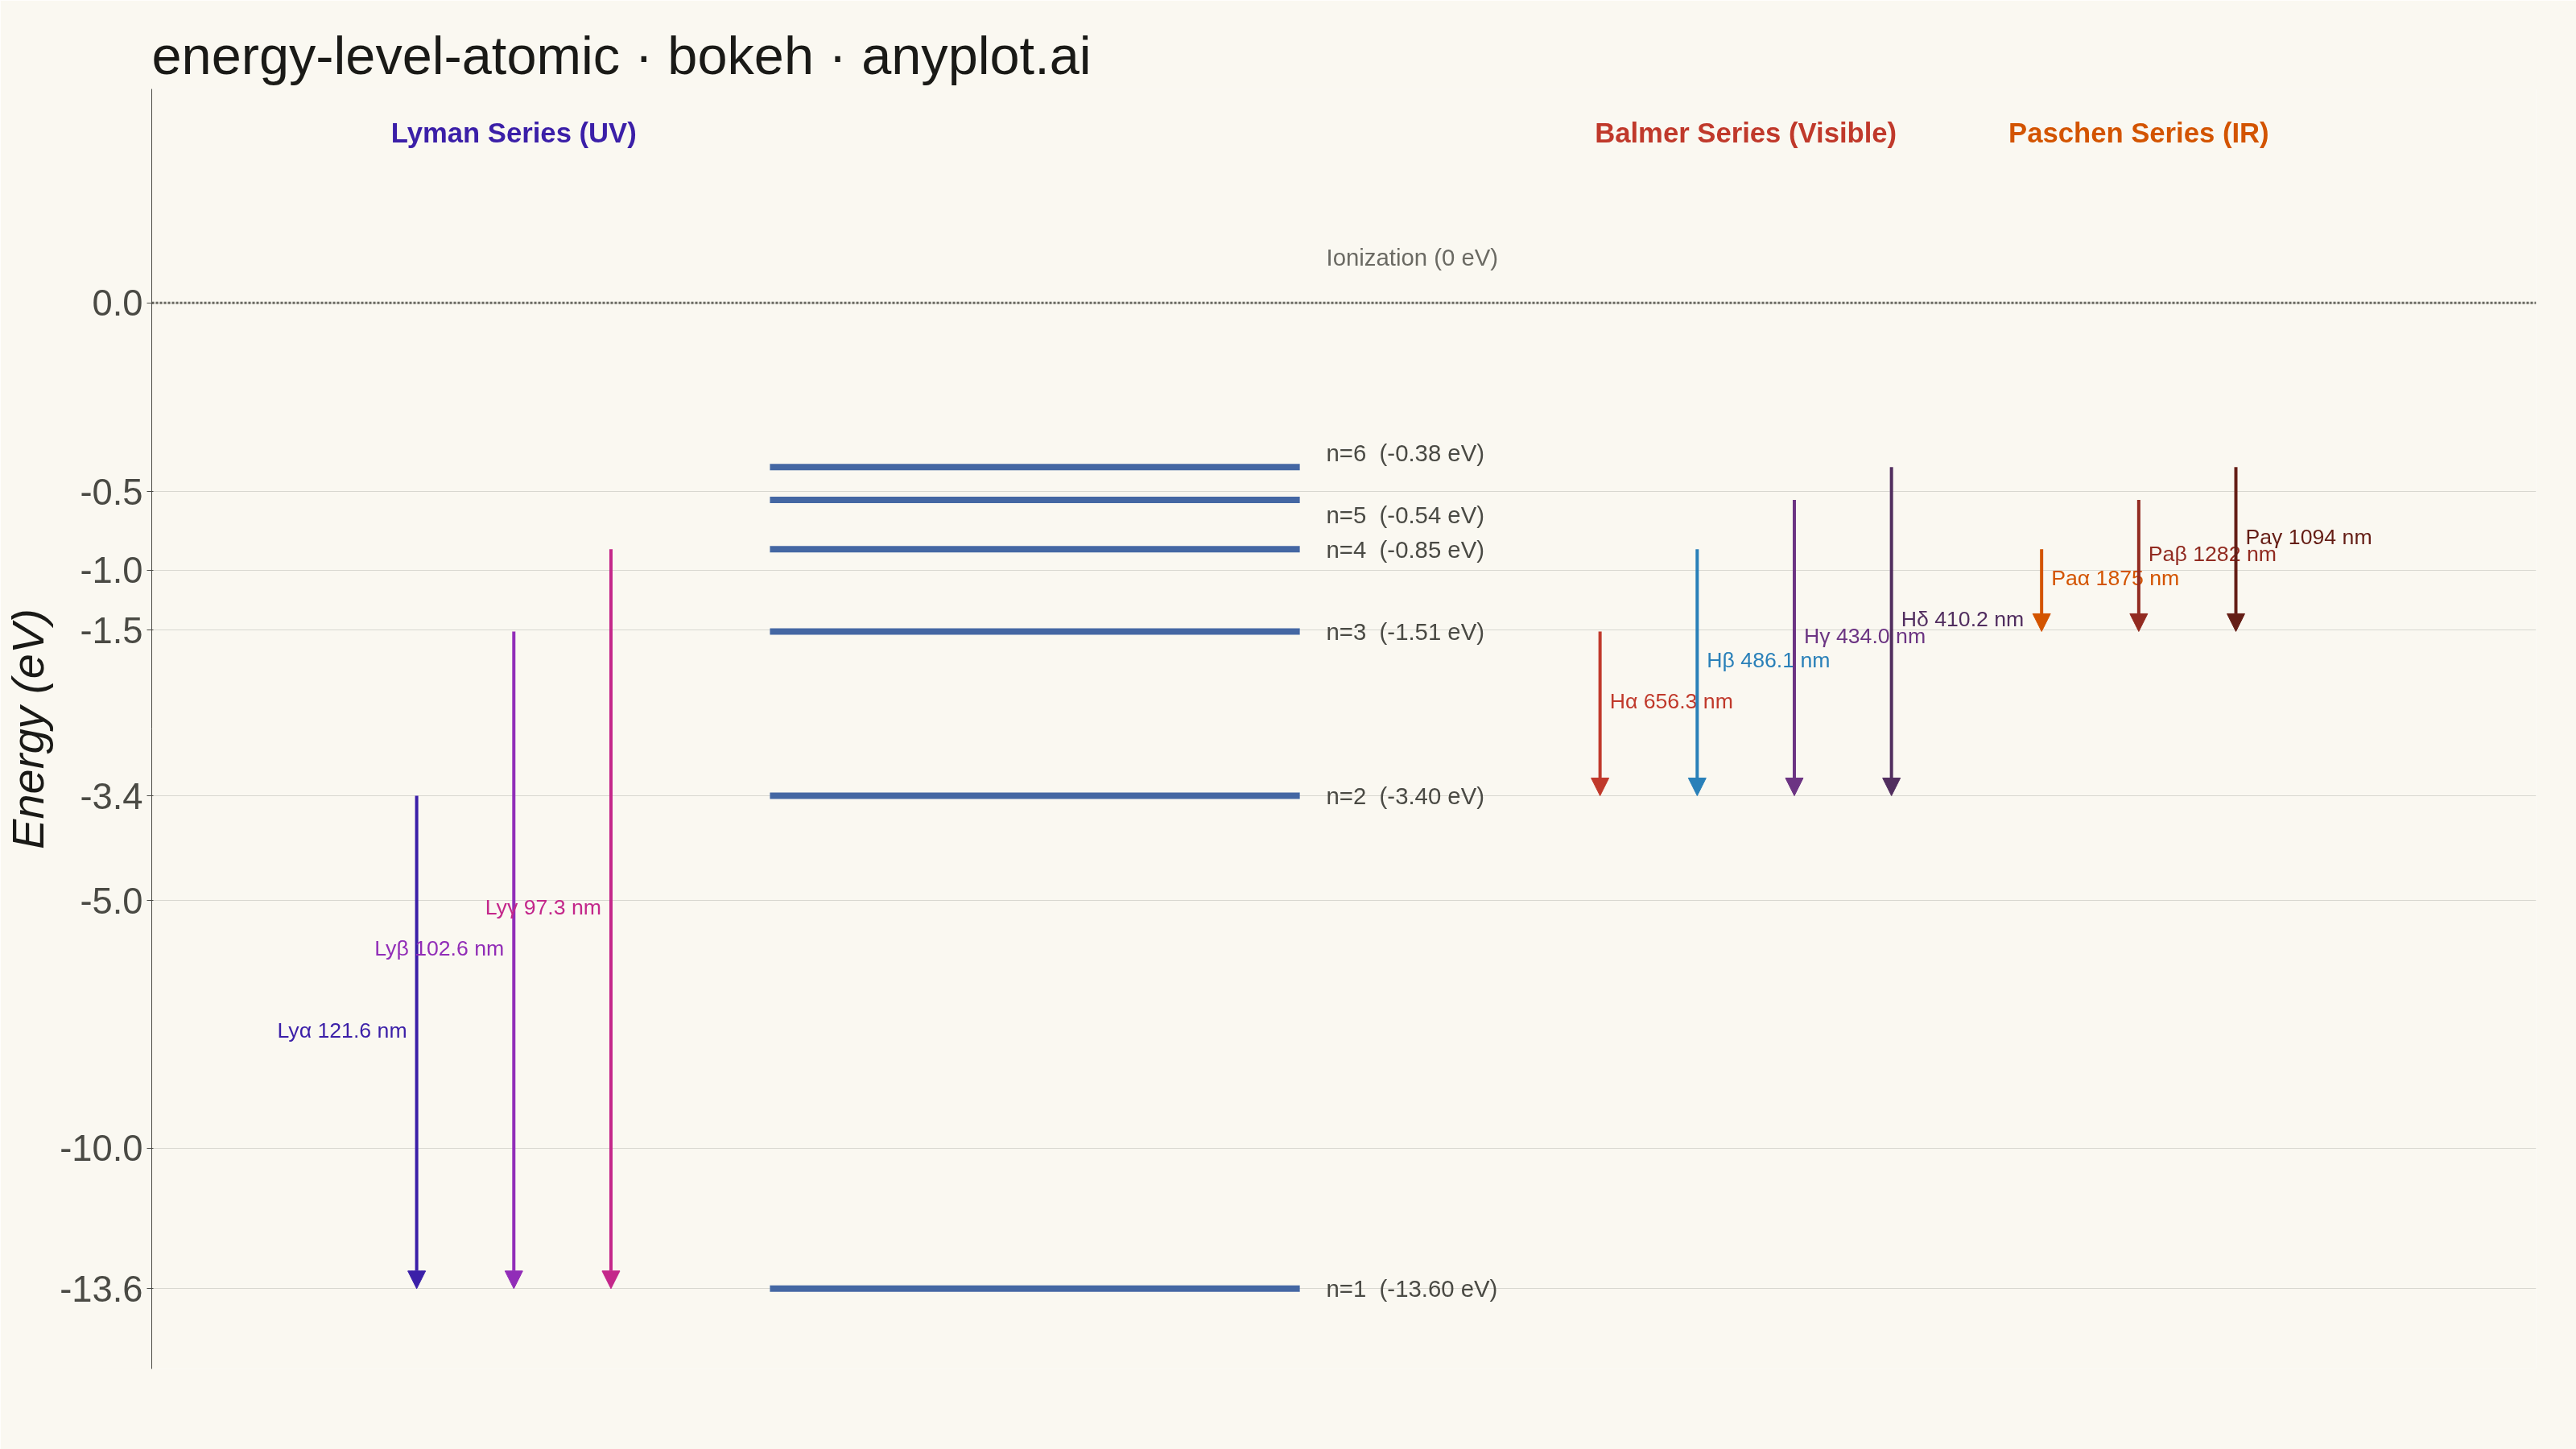
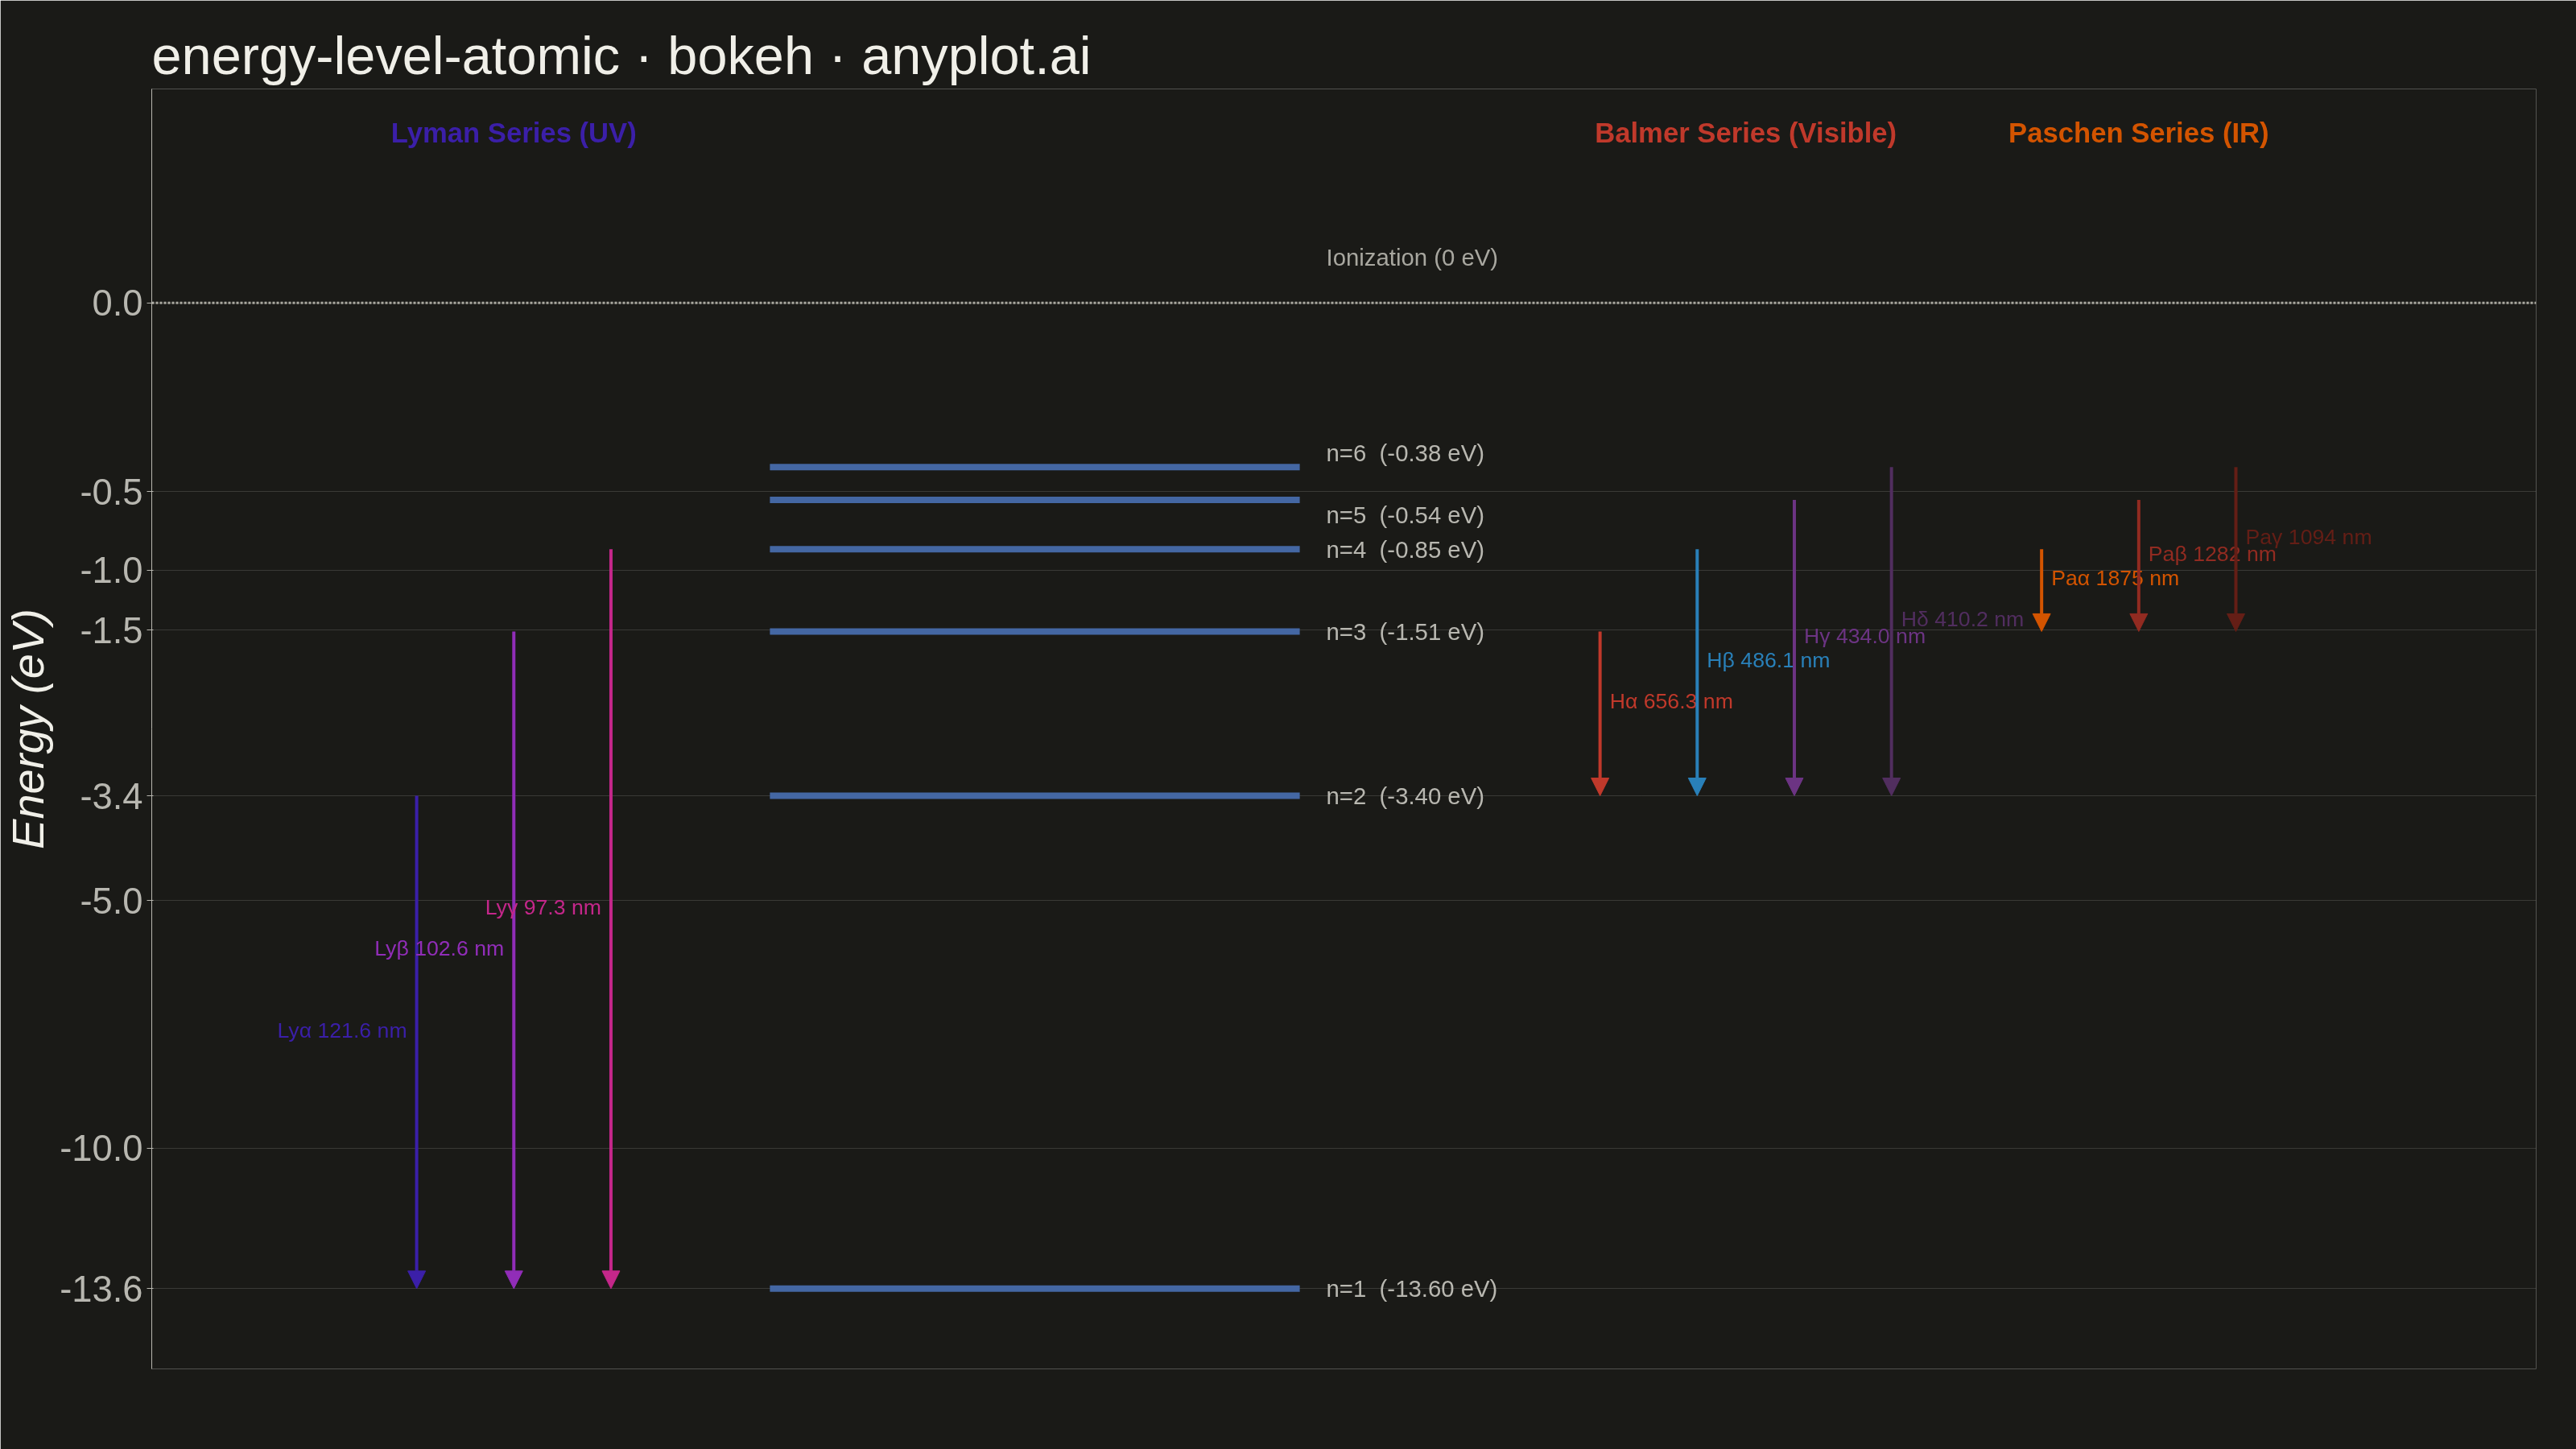
An energy level diagram displays quantized energy states as horizontal lines positioned at their respective energy values, with vertical arrows representing transitions between levels. This visualization reveals the discrete nature of atomic and molecular energy structures, making it essential for understanding spectral series, electron configurations, and quantum state transitions. It provides an intuitive way to connect abstract quantum numbers to observable spectral phenomena.
""" anyplot.ai
energy-level-atomic: Atomic Energy Level Diagram
Library: bokeh 3.9.0 | Python 3.13.13
Quality: 91/100 | Updated: 2026-05-30
"""

import os
import time
from pathlib import Path

import numpy as np
from bokeh.io import output_file, save
from bokeh.models import Arrow, ColumnDataSource, HoverTool, Label, NormalHead, Range1d
from bokeh.plotting import figure
from selenium import webdriver
from selenium.webdriver.chrome.options import Options


# --- Theme ---
THEME = os.getenv("ANYPLOT_THEME", "light")

# Theme-adaptive chrome tokens (Imprint palette system)
PAGE_BG = "#FAF8F1" if THEME == "light" else "#1A1A17"
INK = "#1A1A17" if THEME == "light" else "#F0EFE8"
INK_SOFT = "#4A4A44" if THEME == "light" else "#B8B7B0"
INK_MUTED = "#6B6A63" if THEME == "light" else "#A8A79F"

# --- Data ---
# Hydrogen atom energy levels (E_n = -13.6 / n² eV)
levels = [1, 2, 3, 4, 5, 6]
energies = {n: -13.6 / n**2 for n in levels}

# Visual y-positions: sqrt compression for nonlinear mapping
visual_y = {n: -np.sqrt(abs(energies[n])) for n in levels}
ionization_visual_y = 0.0

# Spectral series transitions: (upper_level, lower_level, color, label)
# Lyman series (n→1, UV) — hue-varied for better visual differentiation
lyman = [
    (2, 1, "#3B1FA8", "Lyα 121.6 nm"),  # deep blue-violet
    (3, 1, "#912DB8", "Lyβ 102.6 nm"),  # purple-magenta
    (4, 1, "#C4278A", "Lyγ 97.3 nm"),  # rose-magenta
]

# Balmer series (n→2, visible light) — spectral colors
balmer = [
    (3, 2, "#C0392B", "Hα 656.3 nm"),
    (4, 2, "#2980B9", "Hβ 486.1 nm"),
    (5, 2, "#6C3483", "Hγ 434.0 nm"),
    (6, 2, "#512E5F", "Hδ 410.2 nm"),
]

# Paschen series (n→3, IR) — warm tones
paschen = [(4, 3, "#D35400", "Paα 1875 nm"), (5, 3, "#922B21", "Paβ 1282 nm"), (6, 3, "#641E16", "Paγ 1094 nm")]

# Layout: level lines extended to ±1.5 for better canvas utilization
level_x0, level_x1 = -1.5, 1.5
lyman_x_start = -3.5  # 3 arrows: -3.50, -2.95, -2.40
balmer_x_start = 3.2  # 4 arrows:  3.20,  3.75,  4.30,  4.85
paschen_x_start = 5.7  # 3 arrows:  5.70,  6.25,  6.80
arrow_spacing = 0.55

# Custom y-axis ticks for sqrt-compressed nonlinear scale
tick_energies = [0, -0.5, -1.0, -1.5, -3.4, -5.0, -10.0, -13.6]
tick_visual = [-np.sqrt(abs(e)) if e != 0 else 0.0 for e in tick_energies]
tick_labels = [f"{e:.1f}" for e in tick_energies]

# ColumnDataSource for energy level lines (enables HoverTool)
level_source = ColumnDataSource(
    data={
        "x0": [level_x0] * len(levels),
        "y0": [visual_y[n] for n in levels],
        "x1": [level_x1] * len(levels),
        "y1": [visual_y[n] for n in levels],
        "quantum_n": [f"n = {n}" for n in levels],
        "energy": [f"{energies[n]:.2f} eV" for n in levels],
        "degeneracy": [f"{n**2}-fold" for n in levels],
    }
)

# --- Plot (3200×1800 landscape canvas) ---
W, H = 3200, 1800

p = figure(
    width=W,
    height=H,
    title="energy-level-atomic · bokeh · anyplot.ai",
    x_range=Range1d(-5.0, 8.5),
    y_range=Range1d(visual_y[1] - 0.3, ionization_visual_y + 0.8),
    toolbar_location=None,
    min_border_bottom=100,
    min_border_left=180,
    min_border_top=110,
    min_border_right=50,
)

# Custom y-axis ticks
p.yaxis.ticker = tick_visual
p.yaxis.major_label_overrides = dict(zip(tick_visual, tick_labels, strict=True))
p.yaxis.axis_label = "Energy (eV)"

# Energy level lines (Imprint blue #4467A3)
level_glyph = p.segment(x0="x0", y0="y0", x1="x1", y1="y1", source=level_source, line_width=8, line_color="#4467A3")

# HoverTool for interactive HTML
hover = HoverTool(
    renderers=[level_glyph], tooltips=[("Level", "@quantum_n"), ("Energy", "@energy"), ("Degeneracy", "@degeneracy")]
)
p.add_tools(hover)

# Level labels (right of level lines)
for n in levels:
    vy = visual_y[n]
    e = energies[n]
    y_off = 18 if n == 6 else (-18 if n == 5 else 0)
    p.add_layout(
        Label(
            x=level_x1 + 0.15,
            y=vy,
            text=f"n={n}  ({e:.2f} eV)",
            text_font_size="22pt",
            text_color=INK_SOFT,
            text_baseline="middle",
            y_offset=y_off,
        )
    )

# Ionization limit dashed line
p.segment(
    x0=[-5.0],
    y0=[ionization_visual_y],
    x1=[8.5],
    y1=[ionization_visual_y],
    line_width=3,
    line_color=INK_MUTED,
    line_dash="dashed",
)
p.add_layout(
    Label(
        x=level_x1 + 0.15,
        y=ionization_visual_y + 0.12,
        text="Ionization (0 eV)",
        text_font_size="22pt",
        text_color=INK_MUTED,
    )
)

# Transition arrows and labels
all_series = [(lyman, lyman_x_start, "left"), (balmer, balmer_x_start, "right"), (paschen, paschen_x_start, "right")]

for transitions, x_start, label_side in all_series:
    for i, (n_upper, n_lower, color, label_text) in enumerate(transitions):
        x_pos = x_start + i * arrow_spacing
        p.add_layout(
            Arrow(
                end=NormalHead(size=22, fill_color=color, line_color=color),
                x_start=x_pos,
                y_start=visual_y[n_upper],
                x_end=x_pos,
                y_end=visual_y[n_lower],
                line_color=color,
                line_width=4,
            )
        )
        mid_y = (visual_y[n_upper] + visual_y[n_lower]) / 2
        align = "right" if label_side == "left" else "left"
        x_off = -12 if label_side == "left" else 12
        p.add_layout(
            Label(
                x=x_pos,
                y=mid_y,
                text=label_text,
                text_font_size="20pt",
                text_color=color,
                text_align=align,
                x_offset=x_off,
            )
        )

# Series header labels
header_y = ionization_visual_y + 0.58
lyman_cx = lyman_x_start + arrow_spacing  # center of 3 arrows
balmer_cx = balmer_x_start + 1.5 * arrow_spacing  # center of 4 arrows
paschen_cx = paschen_x_start + arrow_spacing  # center of 3 arrows

for cx, text, color in [
    (lyman_cx, "Lyman Series (UV)", "#3B1FA8"),
    (balmer_cx, "Balmer Series (Visible)", "#C0392B"),
    (paschen_cx, "Paschen Series (IR)", "#D35400"),
]:
    p.add_layout(
        Label(
            x=cx,
            y=header_y,
            text=text,
            text_font_size="26pt",
            text_font_style="bold",
            text_color=color,
            text_align="center",
        )
    )

# --- Style (theme-adaptive chrome) ---
p.title.text_font_size = "50pt"
p.title.text_font_style = "normal"
p.title.text_color = INK

p.yaxis.axis_label_text_font_size = "42pt"
p.yaxis.major_label_text_font_size = "34pt"
p.yaxis.axis_label_text_color = INK
p.yaxis.major_label_text_color = INK_SOFT
p.yaxis.axis_line_color = INK_SOFT
p.yaxis.major_tick_line_color = INK_SOFT

p.xaxis.visible = False
p.xgrid.visible = False
p.ygrid.grid_line_alpha = 0.15
p.ygrid.grid_line_color = INK
p.ygrid.grid_line_width = 1

p.outline_line_color = None
p.background_fill_color = PAGE_BG
p.border_fill_color = PAGE_BG

# --- Save ---
output_file(f"plot-{THEME}.html", title="Atomic Energy Level Diagram")
save(p)

# Screenshot with headless Chrome (Selenium 4 / Selenium Manager)
opts = Options()
for arg in (
    "--headless=new",
    "--no-sandbox",
    "--disable-dev-shm-usage",
    "--disable-gpu",
    f"--window-size={W},{H}",
    "--hide-scrollbars",
):
    opts.add_argument(arg)
driver = webdriver.Chrome(options=opts)
# Force viewport to exactly W×H via CDP — Chrome's window chrome otherwise
# shrinks the visible area (e.g. 3200×1800 window → 3200×1661 viewport).
driver.execute_cdp_cmd(
    "Emulation.setDeviceMetricsOverride", {"width": W, "height": H, "deviceScaleFactor": 1, "mobile": False}
)
driver.get(f"file://{Path(f'plot-{THEME}.html').resolve()}")
time.sleep(3)
driver.save_screenshot(f"plot-{THEME}.png")
driver.quit()
Runnable source as JSON, for any HTTP client: https://api.anyplot.ai/specs/energy-level-atomic/bokeh/code. Any spec id and library id listed in llms-full.txt fit the same URL shape; every URL below is complete and callable.
{
  "spec_id": "energy-level-atomic",
  "language": "python",
  "library": "bokeh",
  "page": "https://anyplot.ai/energy-level-atomic/python/bokeh",
  "hub": "https://anyplot.ai/energy-level-atomic",
  "code_json": "https://api.anyplot.ai/specs/energy-level-atomic/bokeh/code",
  "spec_json": "https://api.anyplot.ai/specs/energy-level-atomic",
  "render_light_png": "https://storage.googleapis.com/anyplot-images/plots/energy-level-atomic/python/bokeh/plot-light.png",
  "render_dark_png": "https://storage.googleapis.com/anyplot-images/plots/energy-level-atomic/python/bokeh/plot-dark.png",
  "interactive_light_html": "https://storage.googleapis.com/anyplot-images/plots/energy-level-atomic/python/bokeh/plot-light.html",
  "interactive_dark_html": "https://storage.googleapis.com/anyplot-images/plots/energy-level-atomic/python/bokeh/plot-dark.html",
  "quality_score": 91.0,
  "license": "MIT",
  "guide": "https://anyplot.ai/llms.txt"
}
Part of Atomic Energy Level Diagram on anyplot.ai.