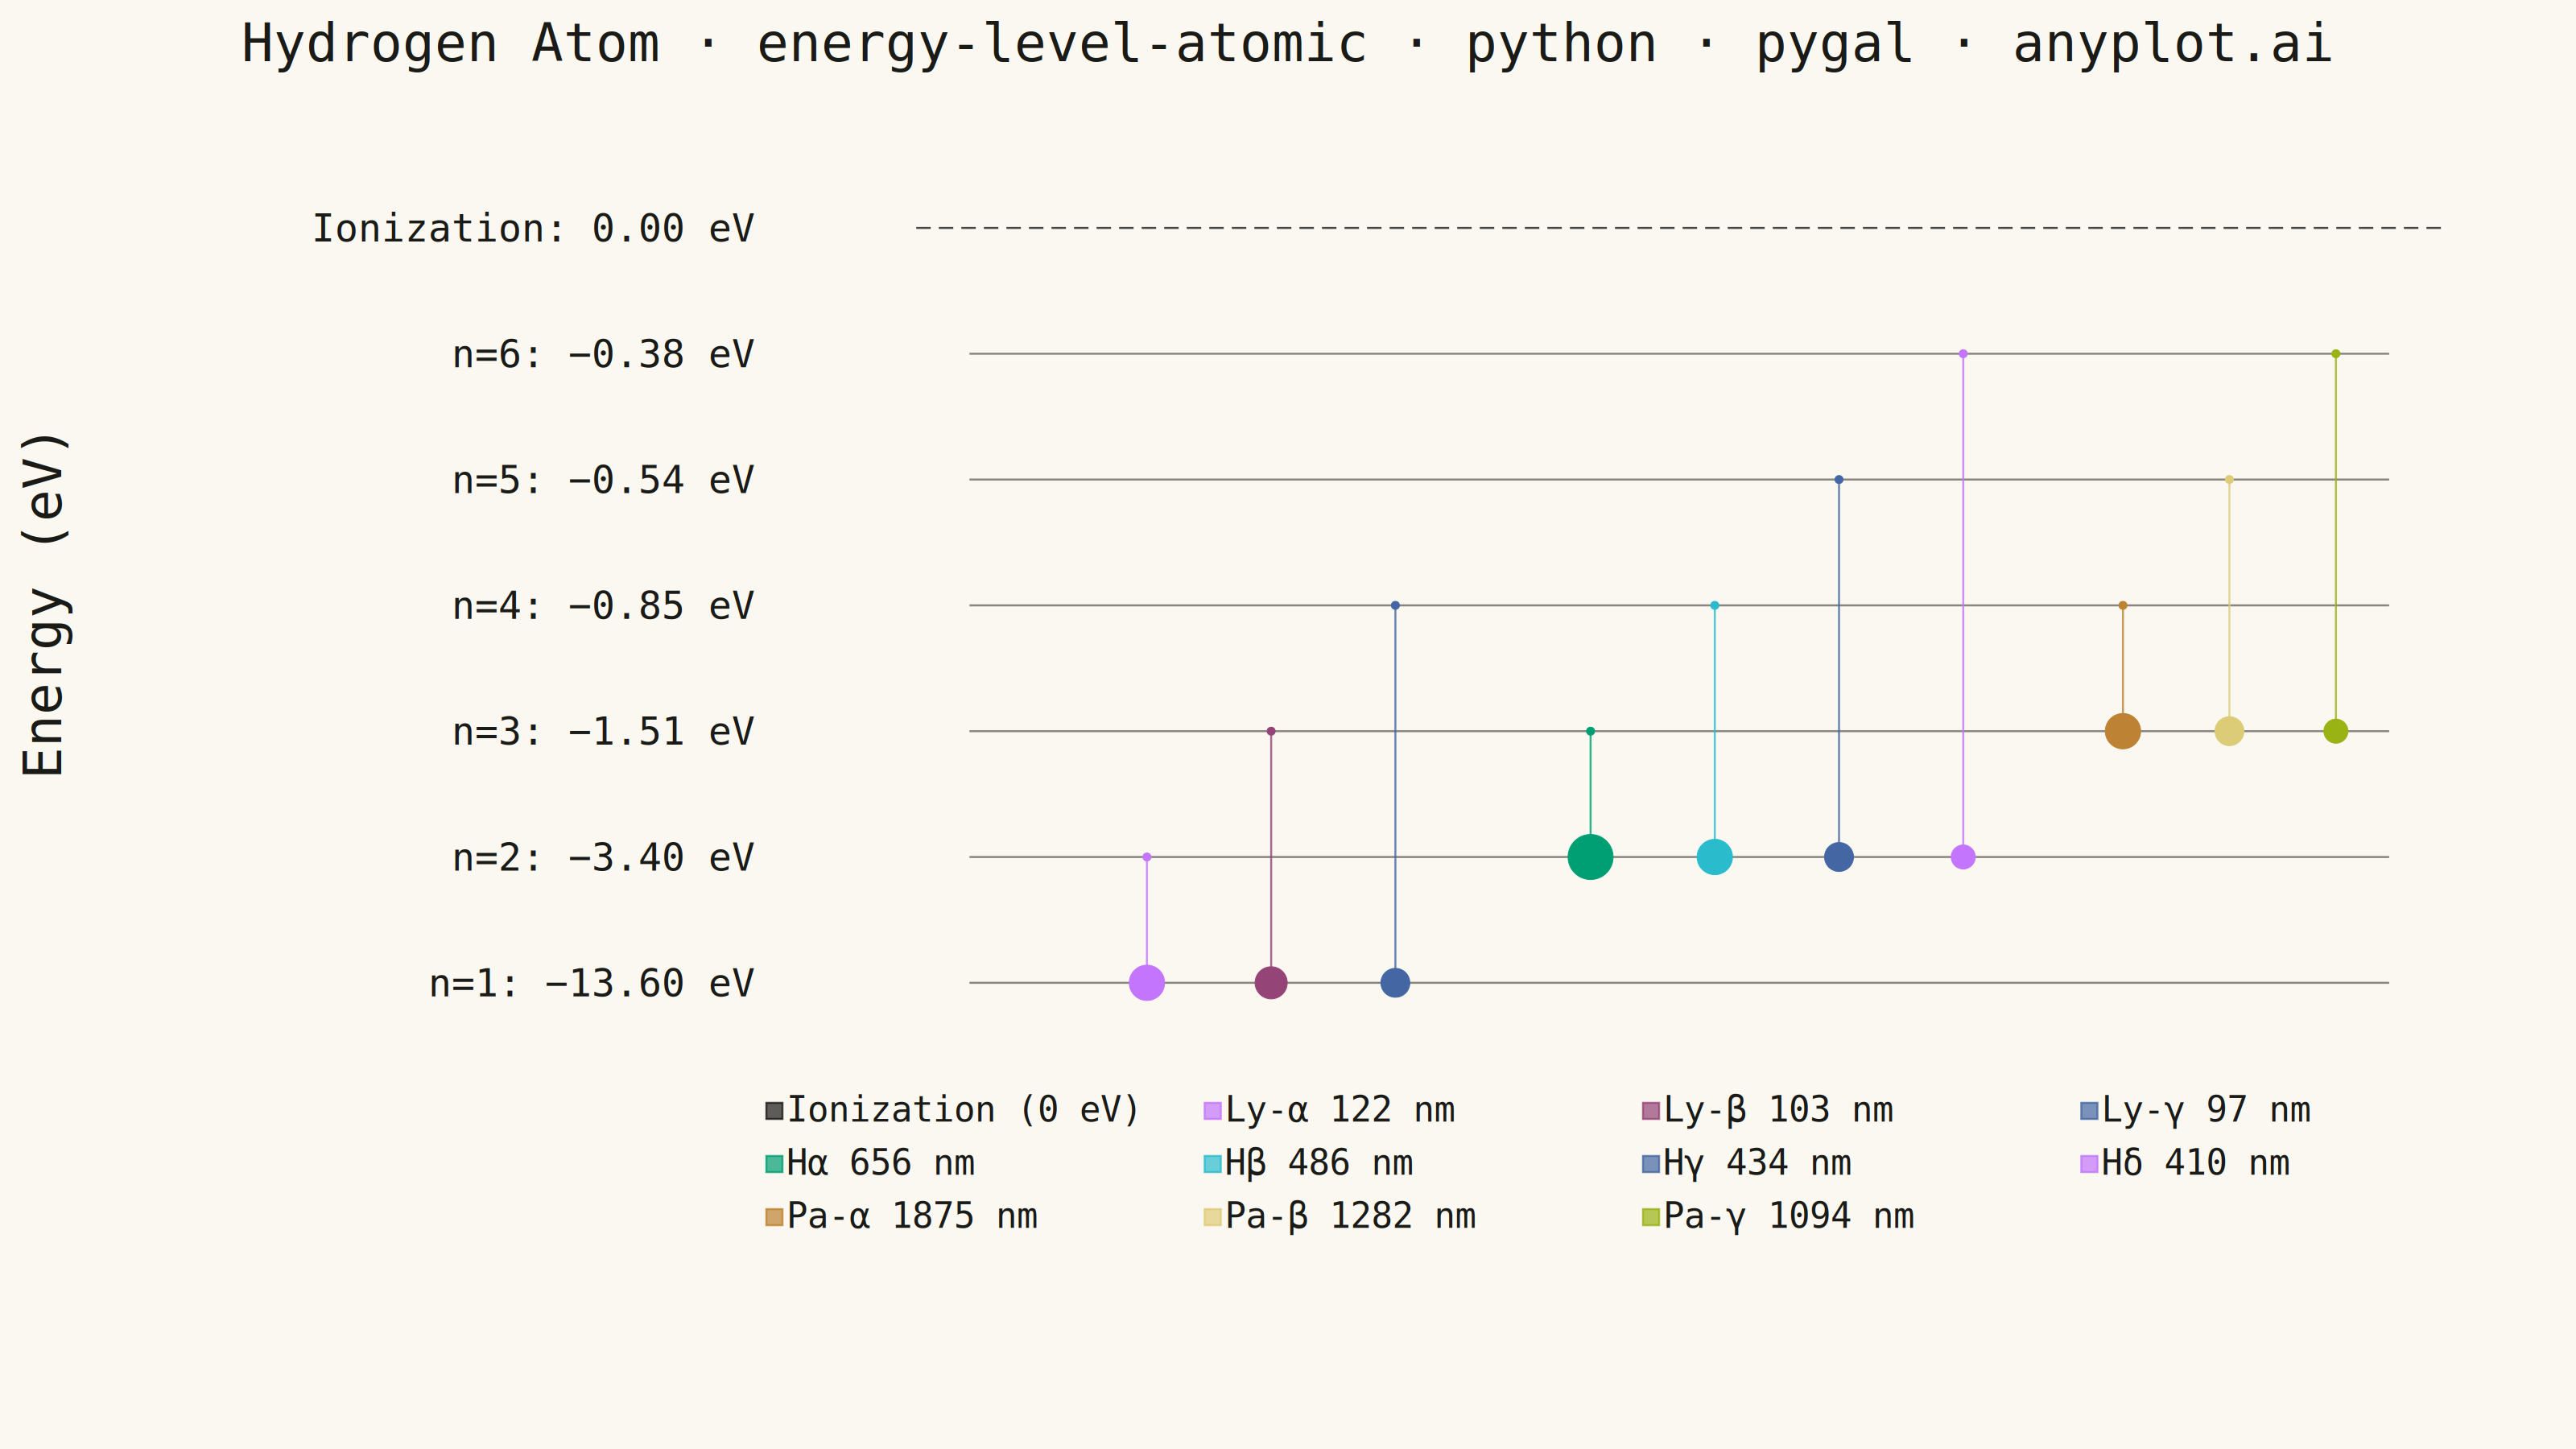
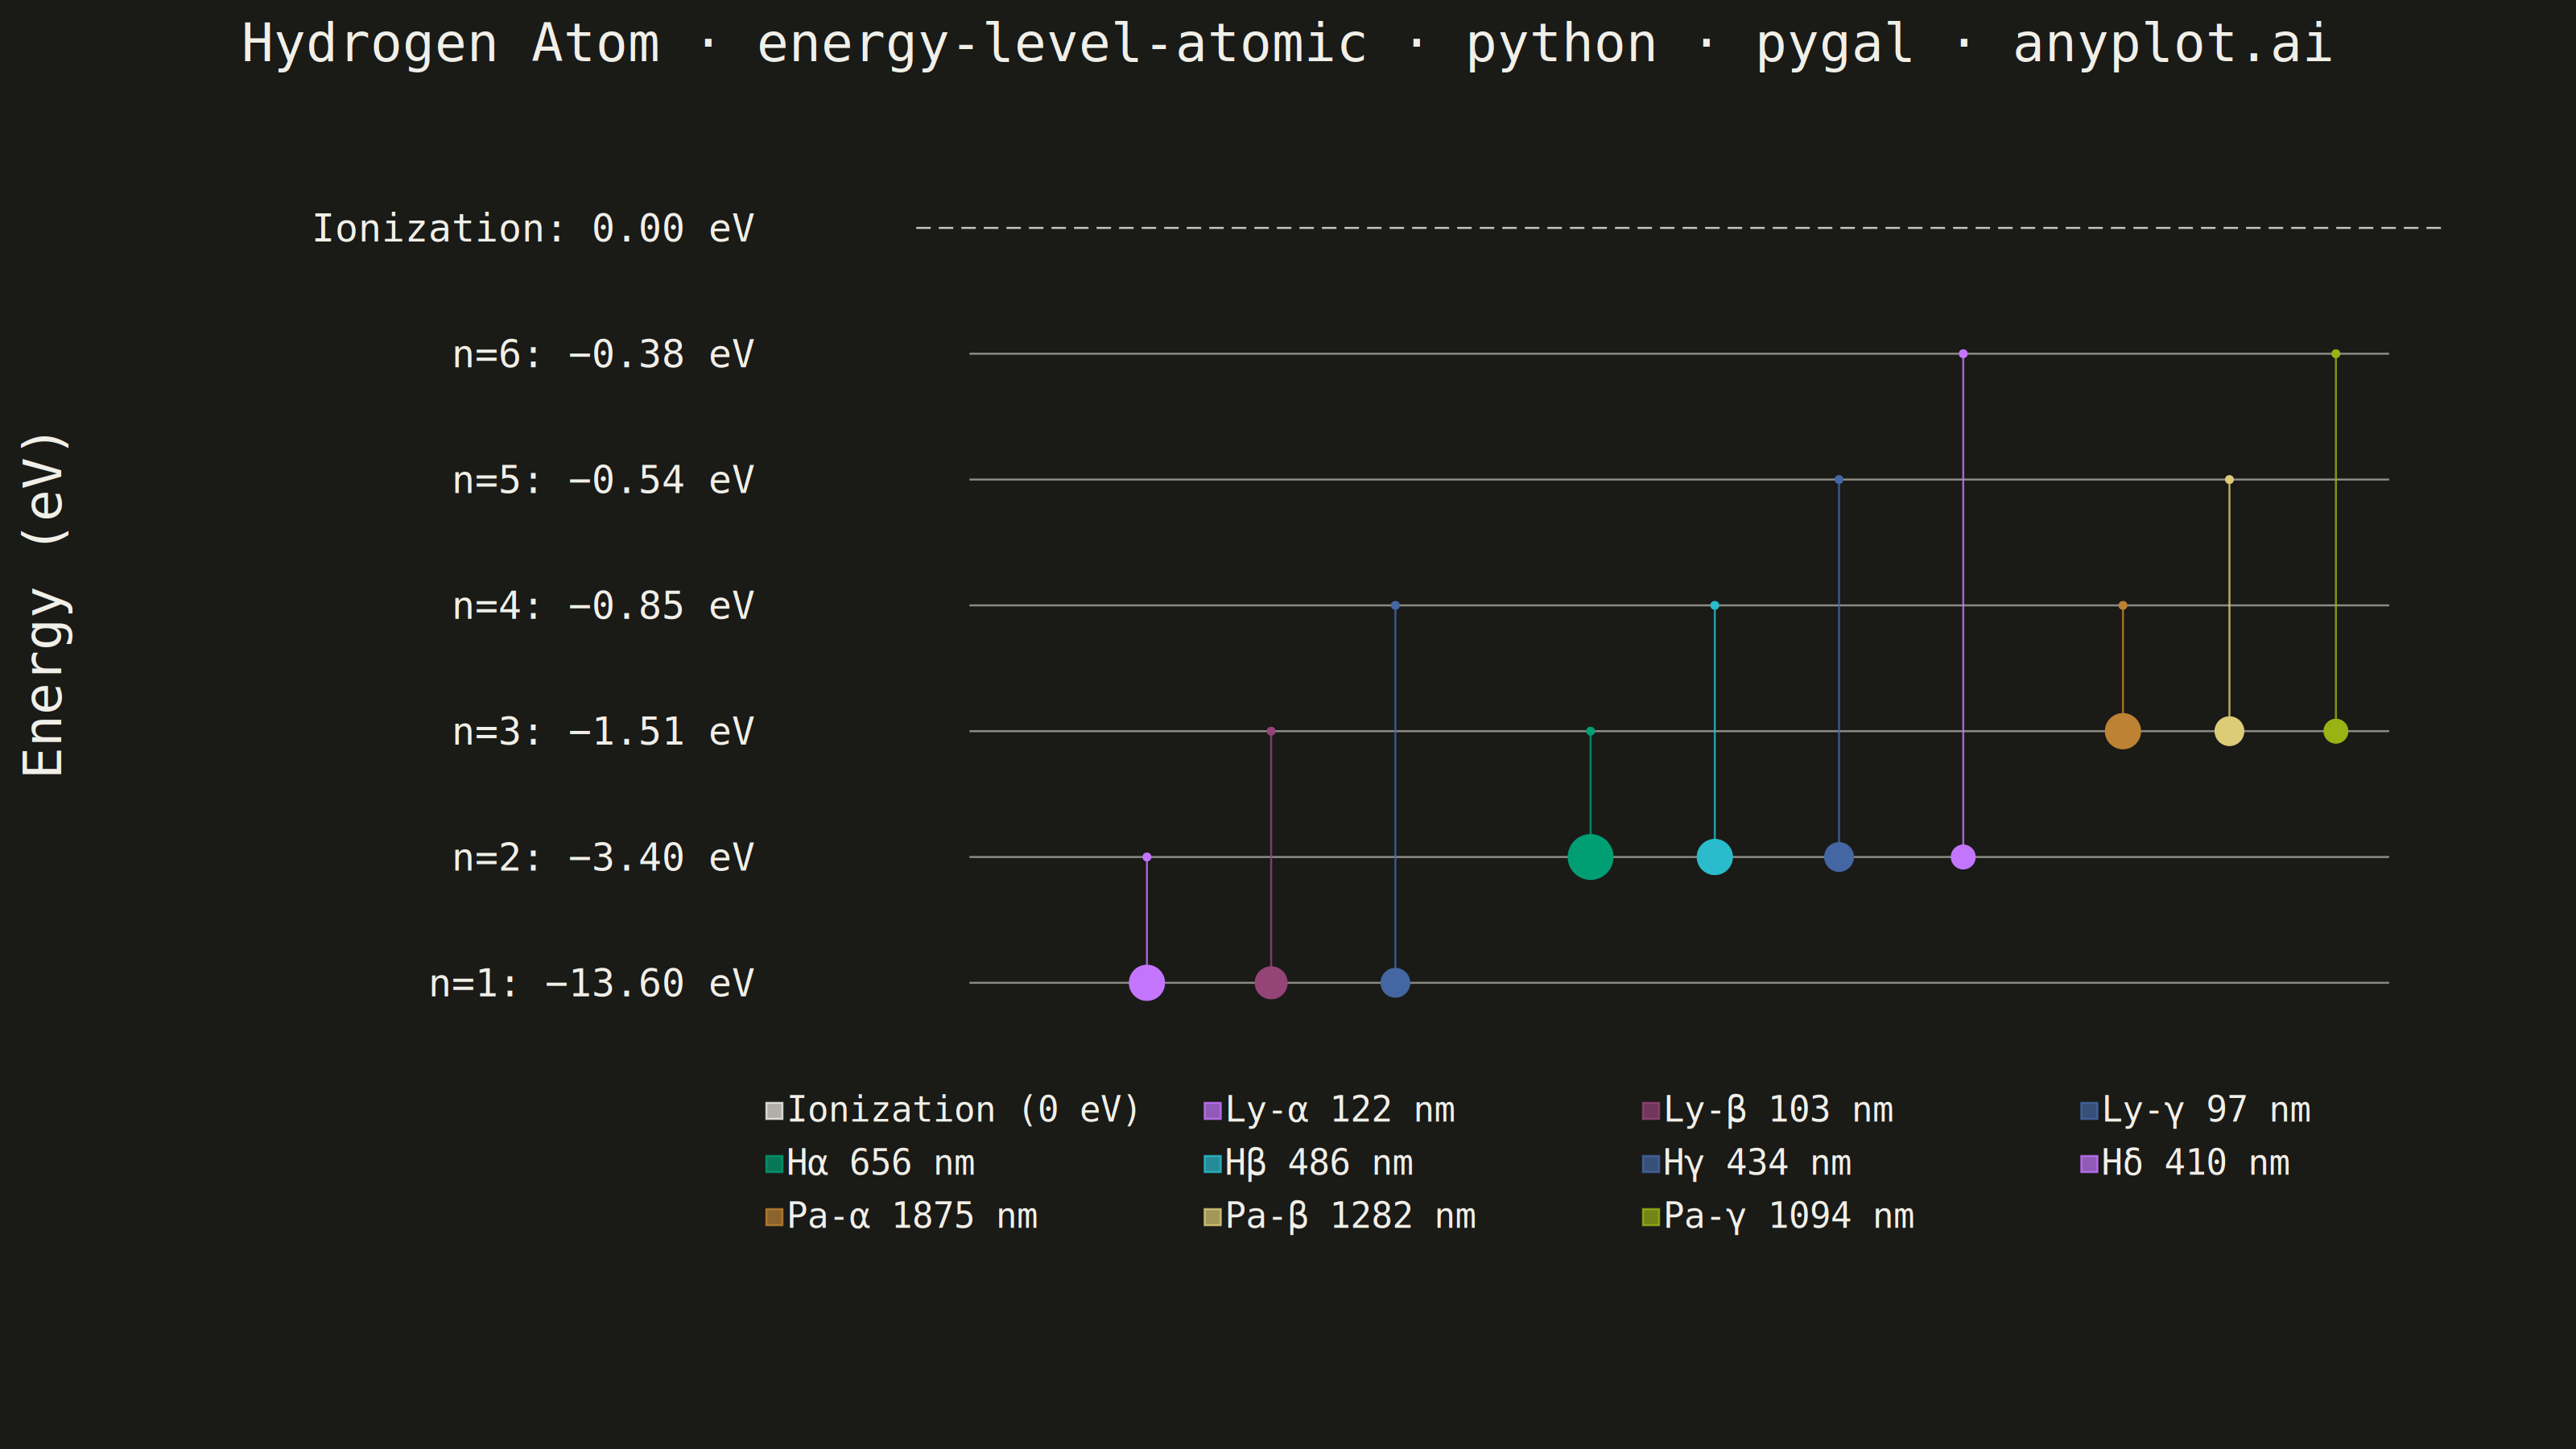
An energy level diagram displays quantized energy states as horizontal lines positioned at their respective energy values, with vertical arrows representing transitions between levels. This visualization reveals the discrete nature of atomic and molecular energy structures, making it essential for understanding spectral series, electron configurations, and quantum state transitions. It provides an intuitive way to connect abstract quantum numbers to observable spectral phenomena.
""" anyplot.ai
energy-level-atomic: Atomic Energy Level Diagram
Library: pygal 3.1.0 | Python 3.13.13
Quality: 87/100 | Updated: 2026-05-30
"""

import os

import pygal
from pygal.style import Style


# Theme tokens
THEME = os.getenv("ANYPLOT_THEME", "light")
PAGE_BG = "#FAF8F1" if THEME == "light" else "#1A1A17"
INK = "#1A1A17" if THEME == "light" else "#F0EFE8"
INK_MUTED = "#6B6A63" if THEME == "light" else "#A8A79F"

# Data — Hydrogen atom spectral series
# Evenly-spaced visual y positions (nonlinear scale for converging upper levels)
visual_y = {1: 1.0, 2: 2.5, 3: 4.0, 4: 5.5, 5: 7.0, 6: 8.5}
ionization_y = 10.0

lyman_transitions = [(2, 1, "Ly-α 122 nm"), (3, 1, "Ly-β 103 nm"), (4, 1, "Ly-γ 97 nm")]
balmer_transitions = [(3, 2, "Hα 656 nm"), (4, 2, "Hβ 486 nm"), (5, 2, "Hγ 434 nm"), (6, 2, "Hδ 410 nm")]
paschen_transitions = [(4, 3, "Pa-α 1875 nm"), (5, 3, "Pa-β 1282 nm"), (6, 3, "Pa-γ 1094 nm")]

level_x_start = 1.0
level_x_end = 9.0
lyman_x_positions = [2.0, 2.7, 3.4]
balmer_x_positions = [4.5, 5.2, 5.9, 6.6]
paschen_x_positions = [7.5, 8.1, 8.7]

# Colors: level lines → INK_MUTED (theme-adaptive), ionization → INK (theme-adaptive)
# Transitions: Imprint palette with spectral semantic mapping
#   Lyman UV (< 400 nm): lavender, rose, blue
#   Balmer visible (400–700 nm): green (#009E73 brand anchor for focal H-alpha), cyan, blue, violet
#   Paschen IR (> 800 nm): ochre, amber, lime
all_colors = (
    INK_MUTED,
    INK_MUTED,
    INK_MUTED,  # levels n=1–3
    INK_MUTED,
    INK_MUTED,
    INK_MUTED,  # levels n=4–6
    INK,  # ionization limit
    "#C475FD",
    "#954477",
    "#4467A3",  # Lyman: lavender, rose, blue
    "#009E73",
    "#2ABCCD",
    "#4467A3",
    "#C475FD",  # Balmer: green (H-alpha focal), cyan, blue, violet
    "#BD8233",
    "#DDCC77",
    "#99B314",  # Paschen: ochre, amber, lime
)

title_str = "Hydrogen Atom · energy-level-atomic · python · pygal · anyplot.ai"
title_fontsize = round(66 * (67 / len(title_str) if len(title_str) > 67 else 1.0))

custom_style = Style(
    background=PAGE_BG,
    plot_background=PAGE_BG,
    foreground=INK,
    foreground_strong=INK,
    foreground_subtle=INK_MUTED,
    colors=all_colors,
    title_font_size=title_fontsize,
    label_font_size=48,
    major_label_font_size=44,
    legend_font_size=44,
    value_font_size=36,
    stroke_width=2.5,
)

# Plot
chart = pygal.XY(
    width=3200,
    height=1800,
    style=custom_style,
    title=title_str,
    y_title="Energy (eV)",
    show_legend=True,
    legend_at_bottom=True,
    legend_at_bottom_columns=4,
    show_x_guides=False,
    show_y_guides=False,
    show_x_labels=False,
    dots_size=10,
    stroke=True,
    margin=60,
    margin_left=280,
    margin_right=80,
    margin_bottom=200,
    margin_top=80,
    range=(0, 11),
    xrange=(0, 9.5),
    truncate_legend=-1,
    tooltip_border_radius=8,
    print_values=False,
    print_labels=False,
    legend_box_size=20,
)

# Y-axis labels showing quantum numbers and actual energy values
chart.y_labels = [
    {"label": "n=1:  −13.60 eV", "value": visual_y[1]},
    {"label": "n=2:  −3.40 eV", "value": visual_y[2]},
    {"label": "n=3:  −1.51 eV", "value": visual_y[3]},
    {"label": "n=4:  −0.85 eV", "value": visual_y[4]},
    {"label": "n=5:  −0.54 eV", "value": visual_y[5]},
    {"label": "n=6:  −0.38 eV", "value": visual_y[6]},
    {"label": "Ionization:  0.00 eV", "value": ionization_y},
]

# Energy level horizontal lines (hidden from legend, no dots)
for n in range(1, 7):
    chart.add(
        None,
        [
            {"value": (level_x_start, visual_y[n]), "node": {"r": 0}},
            {"value": (level_x_end, visual_y[n]), "node": {"r": 0}},
        ],
        stroke_style={"width": 2},
    )

# Ionization limit (dashed reference line)
chart.add(
    "Ionization (0 eV)",
    [
        {"value": (level_x_start - 0.3, ionization_y), "node": {"r": 0}},
        {"value": (level_x_end + 0.3, ionization_y), "node": {"r": 0}},
    ],
    stroke_style={"width": 3, "dasharray": "18, 10"},
)

# Lyman series (UV transitions to n=1) — emission downward: large dot at destination (n=1), small at origin
lyman_widths = [9, 8, 7]
lyman_lower_nodes = [22, 20, 18]  # destination (n=1, lower energy) — large
lyman_upper_nodes = [5, 5, 5]  # origin (upper level) — small
for i, (upper, lower, label) in enumerate(lyman_transitions):
    x = lyman_x_positions[i]
    chart.add(
        label,
        [
            {"value": (x, visual_y[upper]), "node": {"r": lyman_upper_nodes[i]}},
            {"value": (x, visual_y[lower]), "node": {"r": lyman_lower_nodes[i]}},
        ],
        stroke_style={"width": lyman_widths[i]},
    )

# Balmer series (visible transitions to n=2) — emission downward: large dot at destination (n=2), small at origin
# Hα is focal point: brand green, widest stroke, largest destination dot
balmer_widths = [11, 9, 7, 6]
balmer_lower_nodes = [28, 22, 18, 15]  # destination (n=2) — large; Hα biggest
balmer_upper_nodes = [5, 5, 5, 5]  # origin (upper level) — small
for i, (upper, lower, label) in enumerate(balmer_transitions):
    x = balmer_x_positions[i]
    chart.add(
        label,
        [
            {"value": (x, visual_y[upper]), "node": {"r": balmer_upper_nodes[i]}},
            {"value": (x, visual_y[lower]), "node": {"r": balmer_lower_nodes[i]}},
        ],
        stroke_style={"width": balmer_widths[i]},
    )

# Paschen series (IR transitions to n=3) — emission downward: large dot at destination (n=3), small at origin
paschen_widths = [9, 7, 6]
paschen_lower_nodes = [22, 18, 15]  # destination (n=3) — large
paschen_upper_nodes = [5, 5, 5]  # origin (upper level) — small
for i, (upper, lower, label) in enumerate(paschen_transitions):
    x = paschen_x_positions[i]
    chart.add(
        label,
        [
            {"value": (x, visual_y[upper]), "node": {"r": paschen_upper_nodes[i]}},
            {"value": (x, visual_y[lower]), "node": {"r": paschen_lower_nodes[i]}},
        ],
        stroke_style={"width": paschen_widths[i]},
    )

# Save
chart.render_to_png(f"plot-{THEME}.png")
with open(f"plot-{THEME}.html", "wb") as f:
    f.write(chart.render())
Runnable source as JSON, for any HTTP client: https://api.anyplot.ai/specs/energy-level-atomic/pygal/code. Any spec id and library id listed in llms-full.txt fit the same URL shape; every URL below is complete and callable.
{
  "spec_id": "energy-level-atomic",
  "language": "python",
  "library": "pygal",
  "page": "https://anyplot.ai/energy-level-atomic/python/pygal",
  "hub": "https://anyplot.ai/energy-level-atomic",
  "code_json": "https://api.anyplot.ai/specs/energy-level-atomic/pygal/code",
  "spec_json": "https://api.anyplot.ai/specs/energy-level-atomic",
  "render_light_png": "https://storage.googleapis.com/anyplot-images/plots/energy-level-atomic/python/pygal/plot-light.png",
  "render_dark_png": "https://storage.googleapis.com/anyplot-images/plots/energy-level-atomic/python/pygal/plot-dark.png",
  "interactive_light_html": "https://storage.googleapis.com/anyplot-images/plots/energy-level-atomic/python/pygal/plot-light.html",
  "interactive_dark_html": "https://storage.googleapis.com/anyplot-images/plots/energy-level-atomic/python/pygal/plot-dark.html",
  "quality_score": 87.0,
  "license": "MIT",
  "guide": "https://anyplot.ai/llms.txt"
}
Part of Atomic Energy Level Diagram on anyplot.ai.