The same plot in 14 other libraries — JavaScript: Chart.js, D3.js, Highcharts, MUI X Charts; Python: Altair, Bokeh, lets-plot, Matplotlib, Plotly, plotnine, Pygal, Seaborn; R: ggplot2; Julia: Makie.jl. Compare all 15 side by side: Atomic Energy Level Diagram in Python, R, Julia and JavaScript.
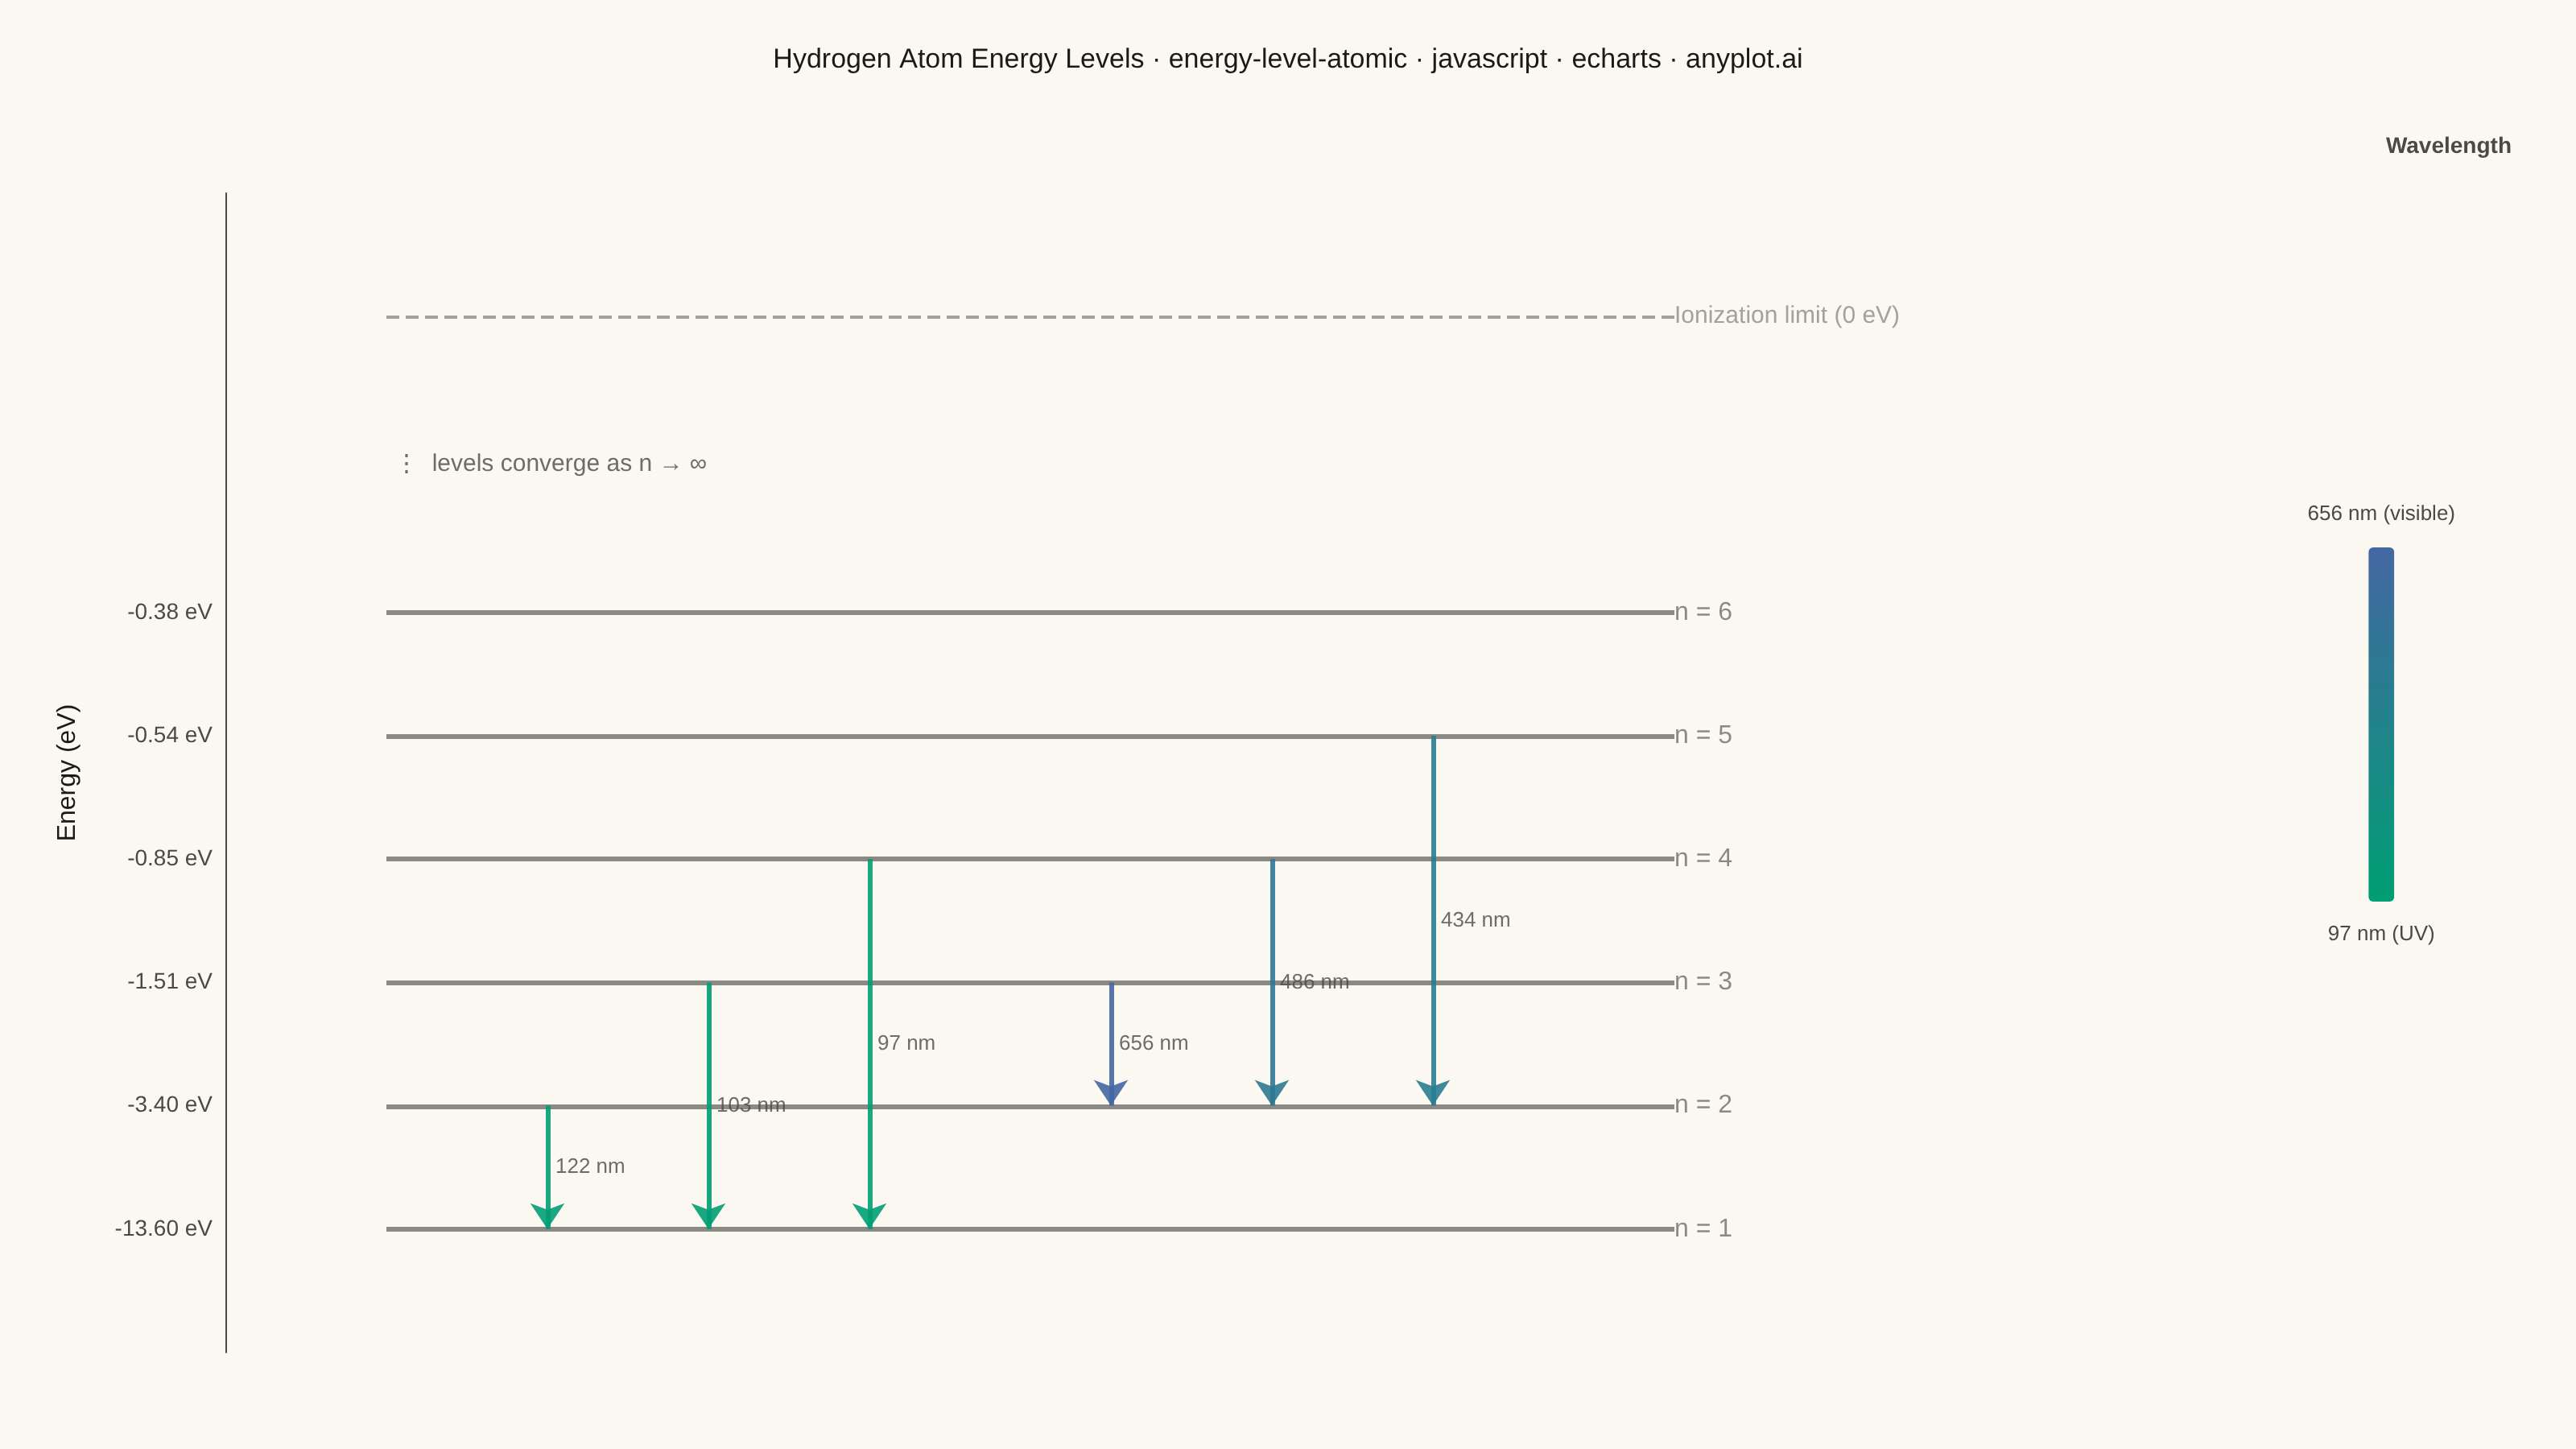
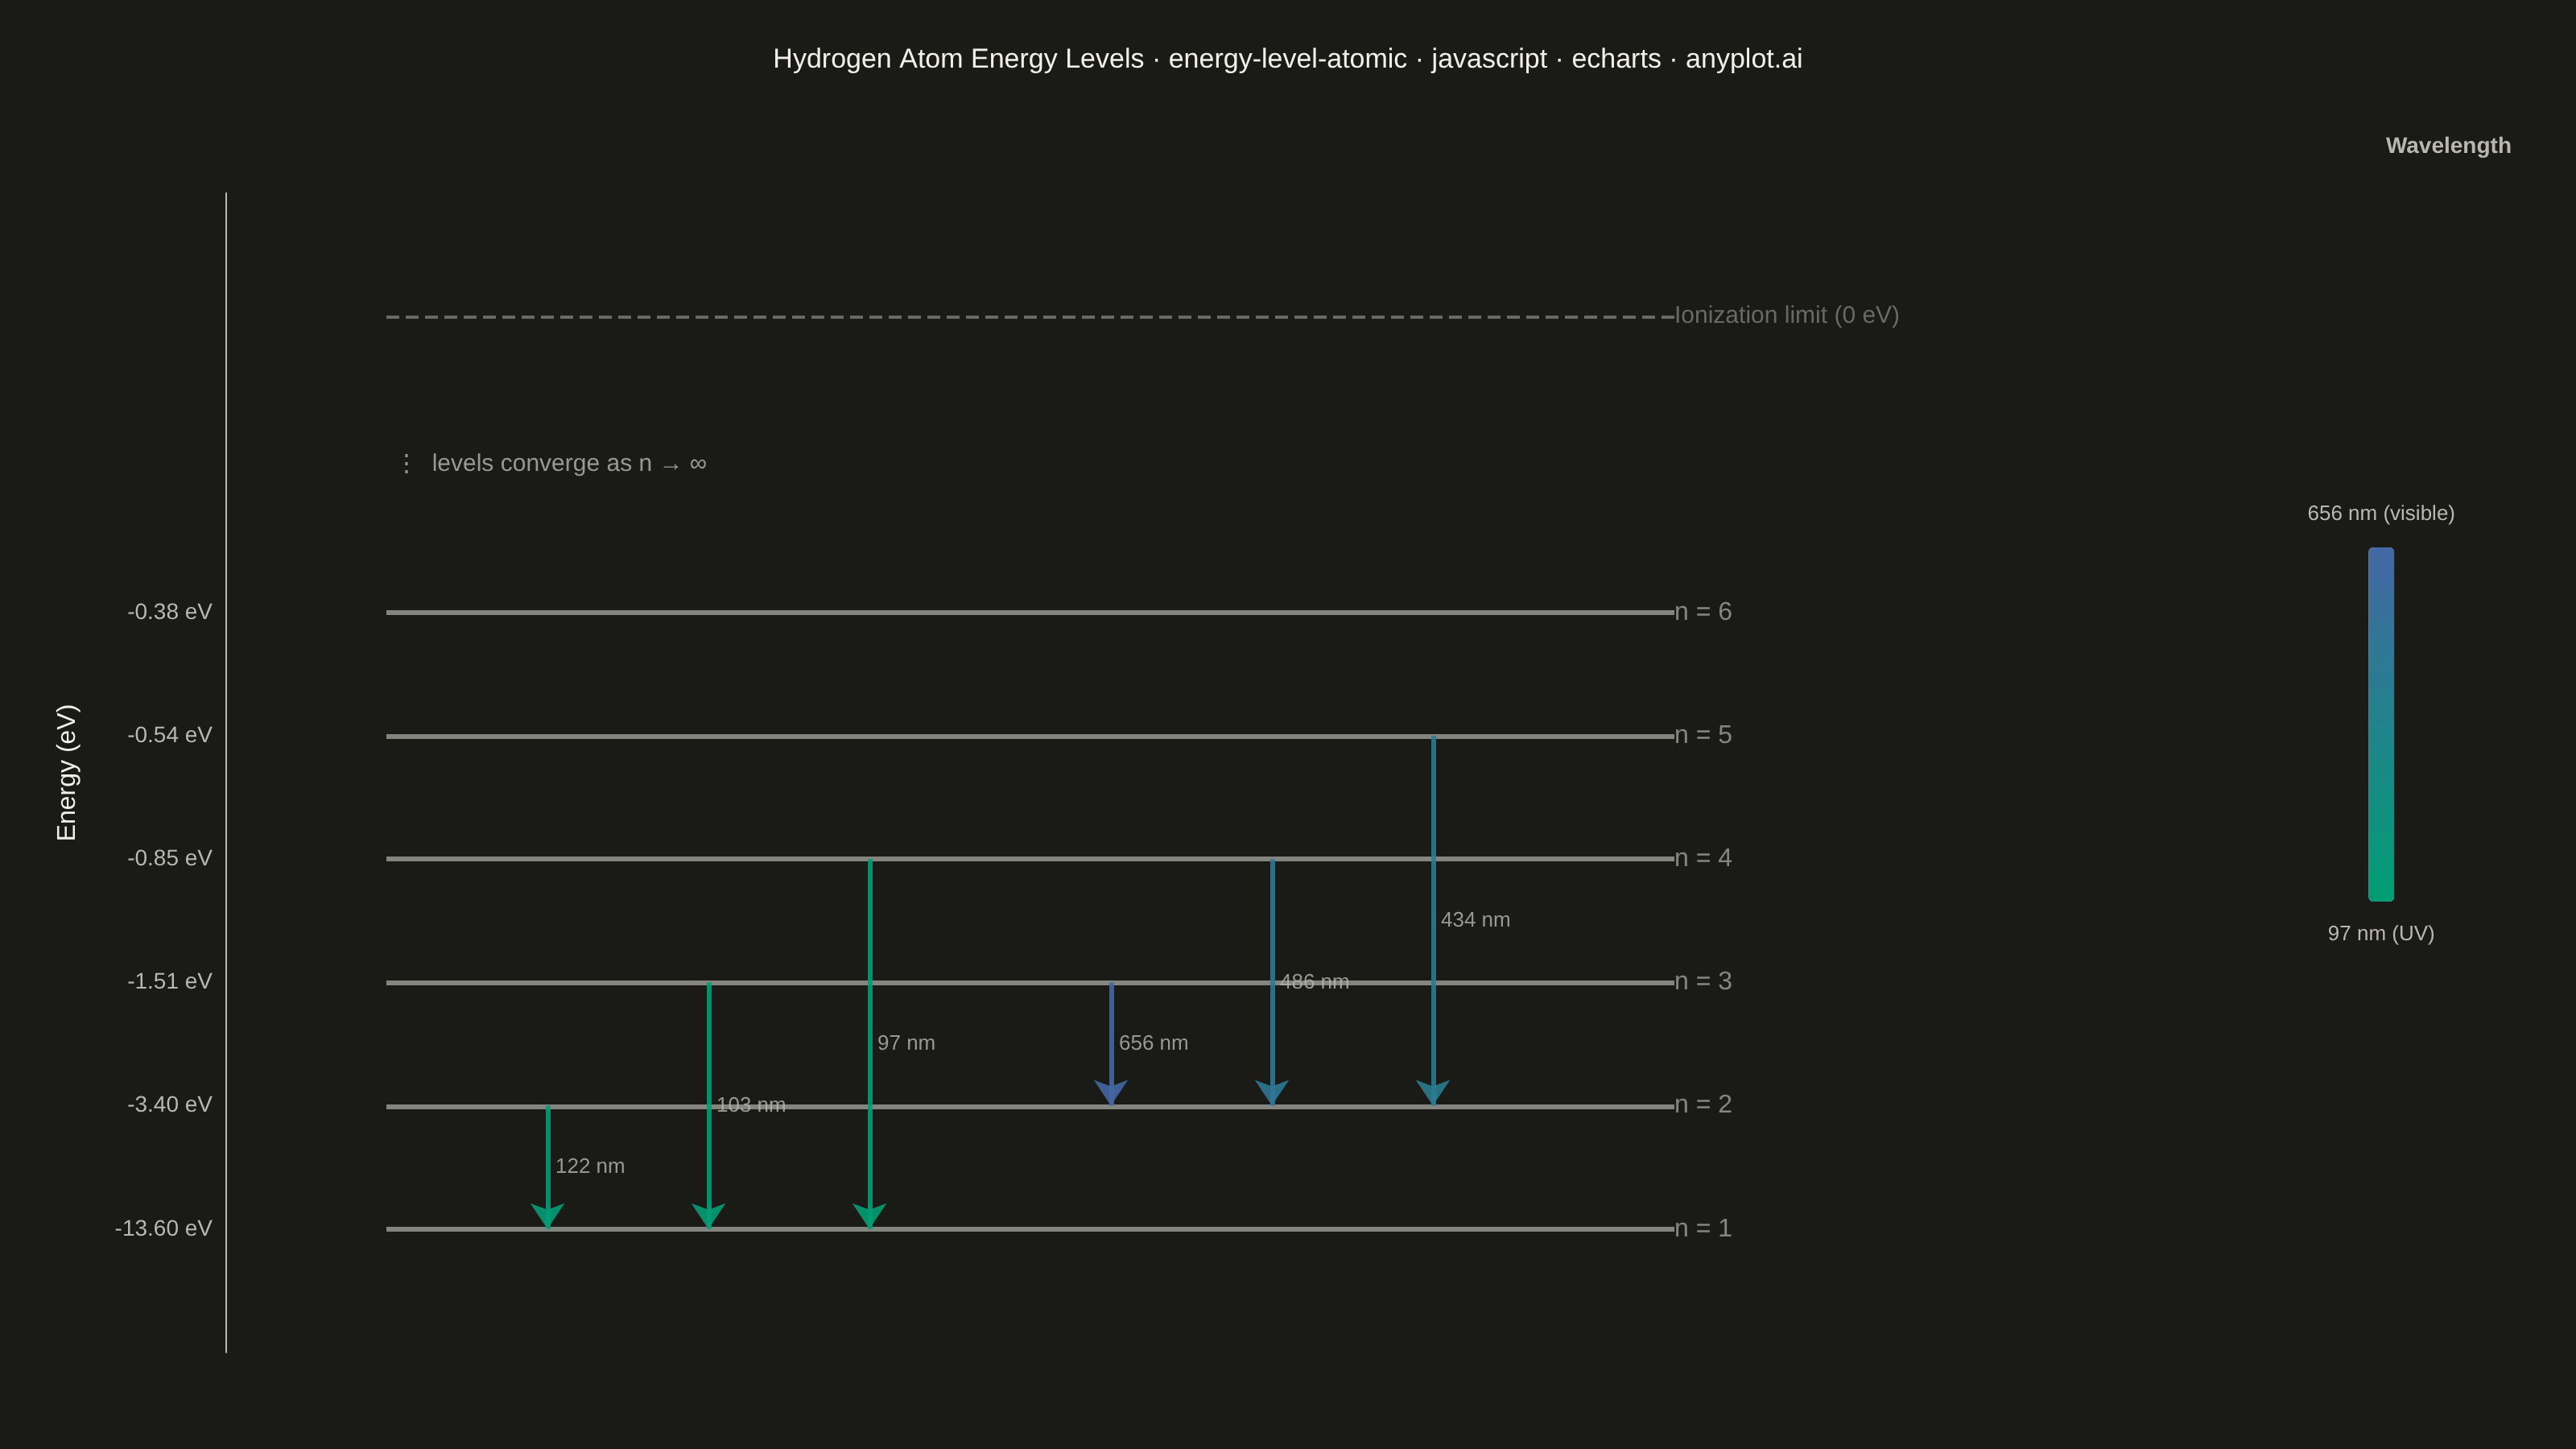
An energy level diagram displays quantized energy states as horizontal lines positioned at their respective energy values, with vertical arrows representing transitions between levels. This visualization reveals the discrete nature of atomic and molecular energy structures, making it essential for understanding spectral series, electron configurations, and quantum state transitions. It provides an intuitive way to connect abstract quantum numbers to observable spectral phenomena.
// anyplot.ai
// energy-level-atomic: Atomic Energy Level Diagram
// Library: echarts 6.1.0 | JavaScript 22.23.2
// Quality: 91/100 | Updated: 2026-08-25

const t = window.ANYPLOT_TOKENS;

// --- Data: hydrogen atom energy levels (Bohr model, E_n = -13.6/n^2 eV) -----
// Real eV spacing collapses near the ionization limit (n=4,5,6 sit within
// 0.5 eV of each other), so levels are plotted on a schematic index scale —
// evenly spaced, labeled with their true energy — a standard convention for
// diagrams where high-n levels converge. See specification.md "Notes".
const LEVELS = [
  { n: 1, energy: -13.6 },
  { n: 2, energy: -3.4 },
  { n: 3, energy: -1.51 },
  { n: 4, energy: -0.85 },
  { n: 5, energy: -0.54 },
  { n: 6, energy: -0.38 },
];
const INDEX_BY_N = Object.fromEntries(LEVELS.map((l, i) => [l.n, i]));
const LEVEL_X0 = 1;
const LEVEL_X1 = 9;
const IONIZATION_INDEX = LEVELS.length + 1.4; // extra gap = "levels converge"

// Lyman series (emission to n=1, ultraviolet) and Balmer series (emission to
// n=2, visible) — wavelengths from the hydrogen spectral line tables.
const TRANSITIONS = [
  { from: 2, to: 1, x: 2.0, wavelength: 121.6, name: "Lyman-α" },
  { from: 3, to: 1, x: 3.0, wavelength: 102.6, name: "Lyman-β" },
  { from: 4, to: 1, x: 4.0, wavelength: 97.3, name: "Lyman-γ" },
  { from: 3, to: 2, x: 5.5, wavelength: 656.3, name: "Balmer Hα" },
  { from: 4, to: 2, x: 6.5, wavelength: 486.1, name: "Balmer Hβ" },
  { from: 5, to: 2, x: 7.5, wavelength: 434.0, name: "Balmer Hγ" },
];
const WAVELENGTHS = TRANSITIONS.map((tr) => tr.wavelength);

// Energy value shown on the y-axis tick at each schematic index.
const AXIS_ENERGY_LABEL = Object.fromEntries(LEVELS.map((l, i) => [i, `${l.energy.toFixed(2)} eV`]));

// --- Init --------------------------------------------------------------
const chart = echarts.init(document.getElementById("container"));

// --- Option --------------------------------------------------------------
const title = "Hydrogen Atom Energy Levels · energy-level-atomic · javascript · echarts · anyplot.ai";
const titleFontSize = Math.round(22 * Math.min(1, 67 / title.length));

chart.setOption({
  animation: false,
  backgroundColor: "transparent",
  title: {
    text: title,
    left: "center",
    top: 24,
    textStyle: { color: t.ink, fontSize: titleFontSize, fontWeight: 500 },
  },
  grid: { left: 140, right: 260, top: 120, bottom: 60 },
  xAxis: { type: "value", min: 0, max: 12, show: false },
  yAxis: {
    type: "value",
    min: -1,
    max: IONIZATION_INDEX + 1,
    interval: 1,
    name: "Energy (eV)",
    nameLocation: "middle",
    nameGap: 90,
    nameTextStyle: { color: t.ink, fontSize: 16 },
    axisLabel: { color: t.inkSoft, fontSize: 14, formatter: (value) => AXIS_ENERGY_LABEL[Math.round(value)] || "" },
    axisLine: { show: true, lineStyle: { color: t.inkSoft } },
    axisTick: { show: false },
    splitLine: { show: false },
  },
  visualMap: {
    show: true,
    min: Math.min(...WAVELENGTHS),
    max: Math.max(...WAVELENGTHS),
    seriesIndex: 3,
    orient: "vertical",
    right: 60,
    top: "middle",
    itemWidth: 16,
    itemHeight: 220,
    text: [`${Math.max(...WAVELENGTHS).toFixed(0)} nm (visible)`, `${Math.min(...WAVELENGTHS).toFixed(0)} nm (UV)`],
    textGap: 14,
    textStyle: { color: t.inkSoft, fontSize: 13 },
    inRange: { color: t.seq },
    calculable: false,
    hoverLink: false,
  },
  graphic: [
    {
      type: "text",
      right: 40,
      top: 84,
      style: { text: "Wavelength", fill: t.inkSoft, fontSize: 14, fontWeight: "bold" },
    },
  ],
  series: [
    {
      // Energy level lines — structural reference elements, theme ink.
      name: "Energy levels",
      type: "lines",
      coordinateSystem: "cartesian2d",
      silent: true,
      z: 2,
      lineStyle: { color: t.ink, width: 3 },
      label: {
        show: true,
        position: "end",
        align: "left",
        color: t.ink,
        fontSize: 16,
        formatter: (params) => `n = ${params.data.n}`,
      },
      data: LEVELS.map((l, i) => ({
        coords: [
          [LEVEL_X0, i],
          [LEVEL_X1, i],
        ],
        n: l.n,
      })),
    },
    {
      // Convergence marker — many closely-spaced levels omitted for clarity.
      name: "Convergence",
      type: "scatter",
      coordinateSystem: "cartesian2d",
      silent: true,
      symbolSize: 0,
      label: {
        show: true,
        position: "right",
        color: t.inkSoft,
        fontSize: 15,
        formatter: "⋮  levels converge as n → ∞",
      },
      data: [{ value: [LEVEL_X0, (LEVELS.length - 1 + IONIZATION_INDEX) / 2] }],
    },
    {
      // Ionization limit — dashed reference line at E = 0.
      name: "Ionization limit",
      type: "lines",
      coordinateSystem: "cartesian2d",
      silent: true,
      z: 2,
      lineStyle: { color: t.inkSoft, width: 2, type: "dashed" },
      label: {
        show: true,
        position: "end",
        align: "left",
        color: t.inkSoft,
        fontSize: 15,
        formatter: "Ionization limit (0 eV)",
      },
      data: [
        {
          coords: [
            [LEVEL_X0, IONIZATION_INDEX],
            [LEVEL_X1, IONIZATION_INDEX],
          ],
        },
      ],
    },
    {
      // Transitions — downward arrows, colored by wavelength (imprint_seq).
      name: "Transitions",
      type: "lines",
      coordinateSystem: "cartesian2d",
      z: 3,
      symbol: ["none", "arrow"],
      symbolSize: [0, 16],
      lineStyle: { width: 3, opacity: 0.9 },
      tooltip: {
        formatter: (params) => `${params.data.name}: n=${params.data.from} → n=${params.data.to} (${params.value.toFixed(1)} nm)`,
      },
      data: TRANSITIONS.map((tr) => ({
        coords: [
          [tr.x, INDEX_BY_N[tr.from]],
          [tr.x, INDEX_BY_N[tr.to]],
        ],
        value: tr.wavelength,
        name: tr.name,
        from: tr.from,
        to: tr.to,
      })),
    },
    {
      // Wavelength labels — offset beside each arrow (not rotated onto it).
      name: "Transition labels",
      type: "scatter",
      coordinateSystem: "cartesian2d",
      silent: true,
      symbolSize: 0,
      label: {
        show: true,
        position: "right",
        color: t.inkSoft,
        fontSize: 13,
        formatter: (params) => `${params.data.wavelength.toFixed(0)} nm`,
      },
      data: TRANSITIONS.map((tr) => ({
        value: [tr.x, (INDEX_BY_N[tr.from] + INDEX_BY_N[tr.to]) / 2],
        wavelength: tr.wavelength,
      })),
    },
  ],
});
Runnable source as JSON, for any HTTP client: https://api.anyplot.ai/specs/energy-level-atomic/echarts/code. Any spec id and library id listed in llms-full.txt fit the same URL shape; every URL below is complete and callable.
{
  "spec_id": "energy-level-atomic",
  "language": "javascript",
  "library": "echarts",
  "page": "https://anyplot.ai/energy-level-atomic/javascript/echarts",
  "hub": "https://anyplot.ai/energy-level-atomic",
  "code_json": "https://api.anyplot.ai/specs/energy-level-atomic/echarts/code",
  "spec_json": "https://api.anyplot.ai/specs/energy-level-atomic",
  "render_light_png": "https://storage.googleapis.com/anyplot-images/plots/energy-level-atomic/javascript/echarts/plot-light.png",
  "render_dark_png": "https://storage.googleapis.com/anyplot-images/plots/energy-level-atomic/javascript/echarts/plot-dark.png",
  "interactive_light_html": "https://storage.googleapis.com/anyplot-images/plots/energy-level-atomic/javascript/echarts/plot-light.html",
  "interactive_dark_html": "https://storage.googleapis.com/anyplot-images/plots/energy-level-atomic/javascript/echarts/plot-dark.html",
  "quality_score": 91.0,
  "license": "MIT",
  "guide": "https://anyplot.ai/llms.txt"
}
Part of Atomic Energy Level Diagram on anyplot.ai.