The same plot in 14 other libraries — Python: Altair, Bokeh, lets-plot, Matplotlib, Plotly, plotnine, Pygal, Seaborn; R: ggplot2; JavaScript: Chart.js, D3.js, Apache ECharts, Highcharts, MUI X Charts. Compare all 15 side by side: Atomic Energy Level Diagram in Python, R, Julia and JavaScript.
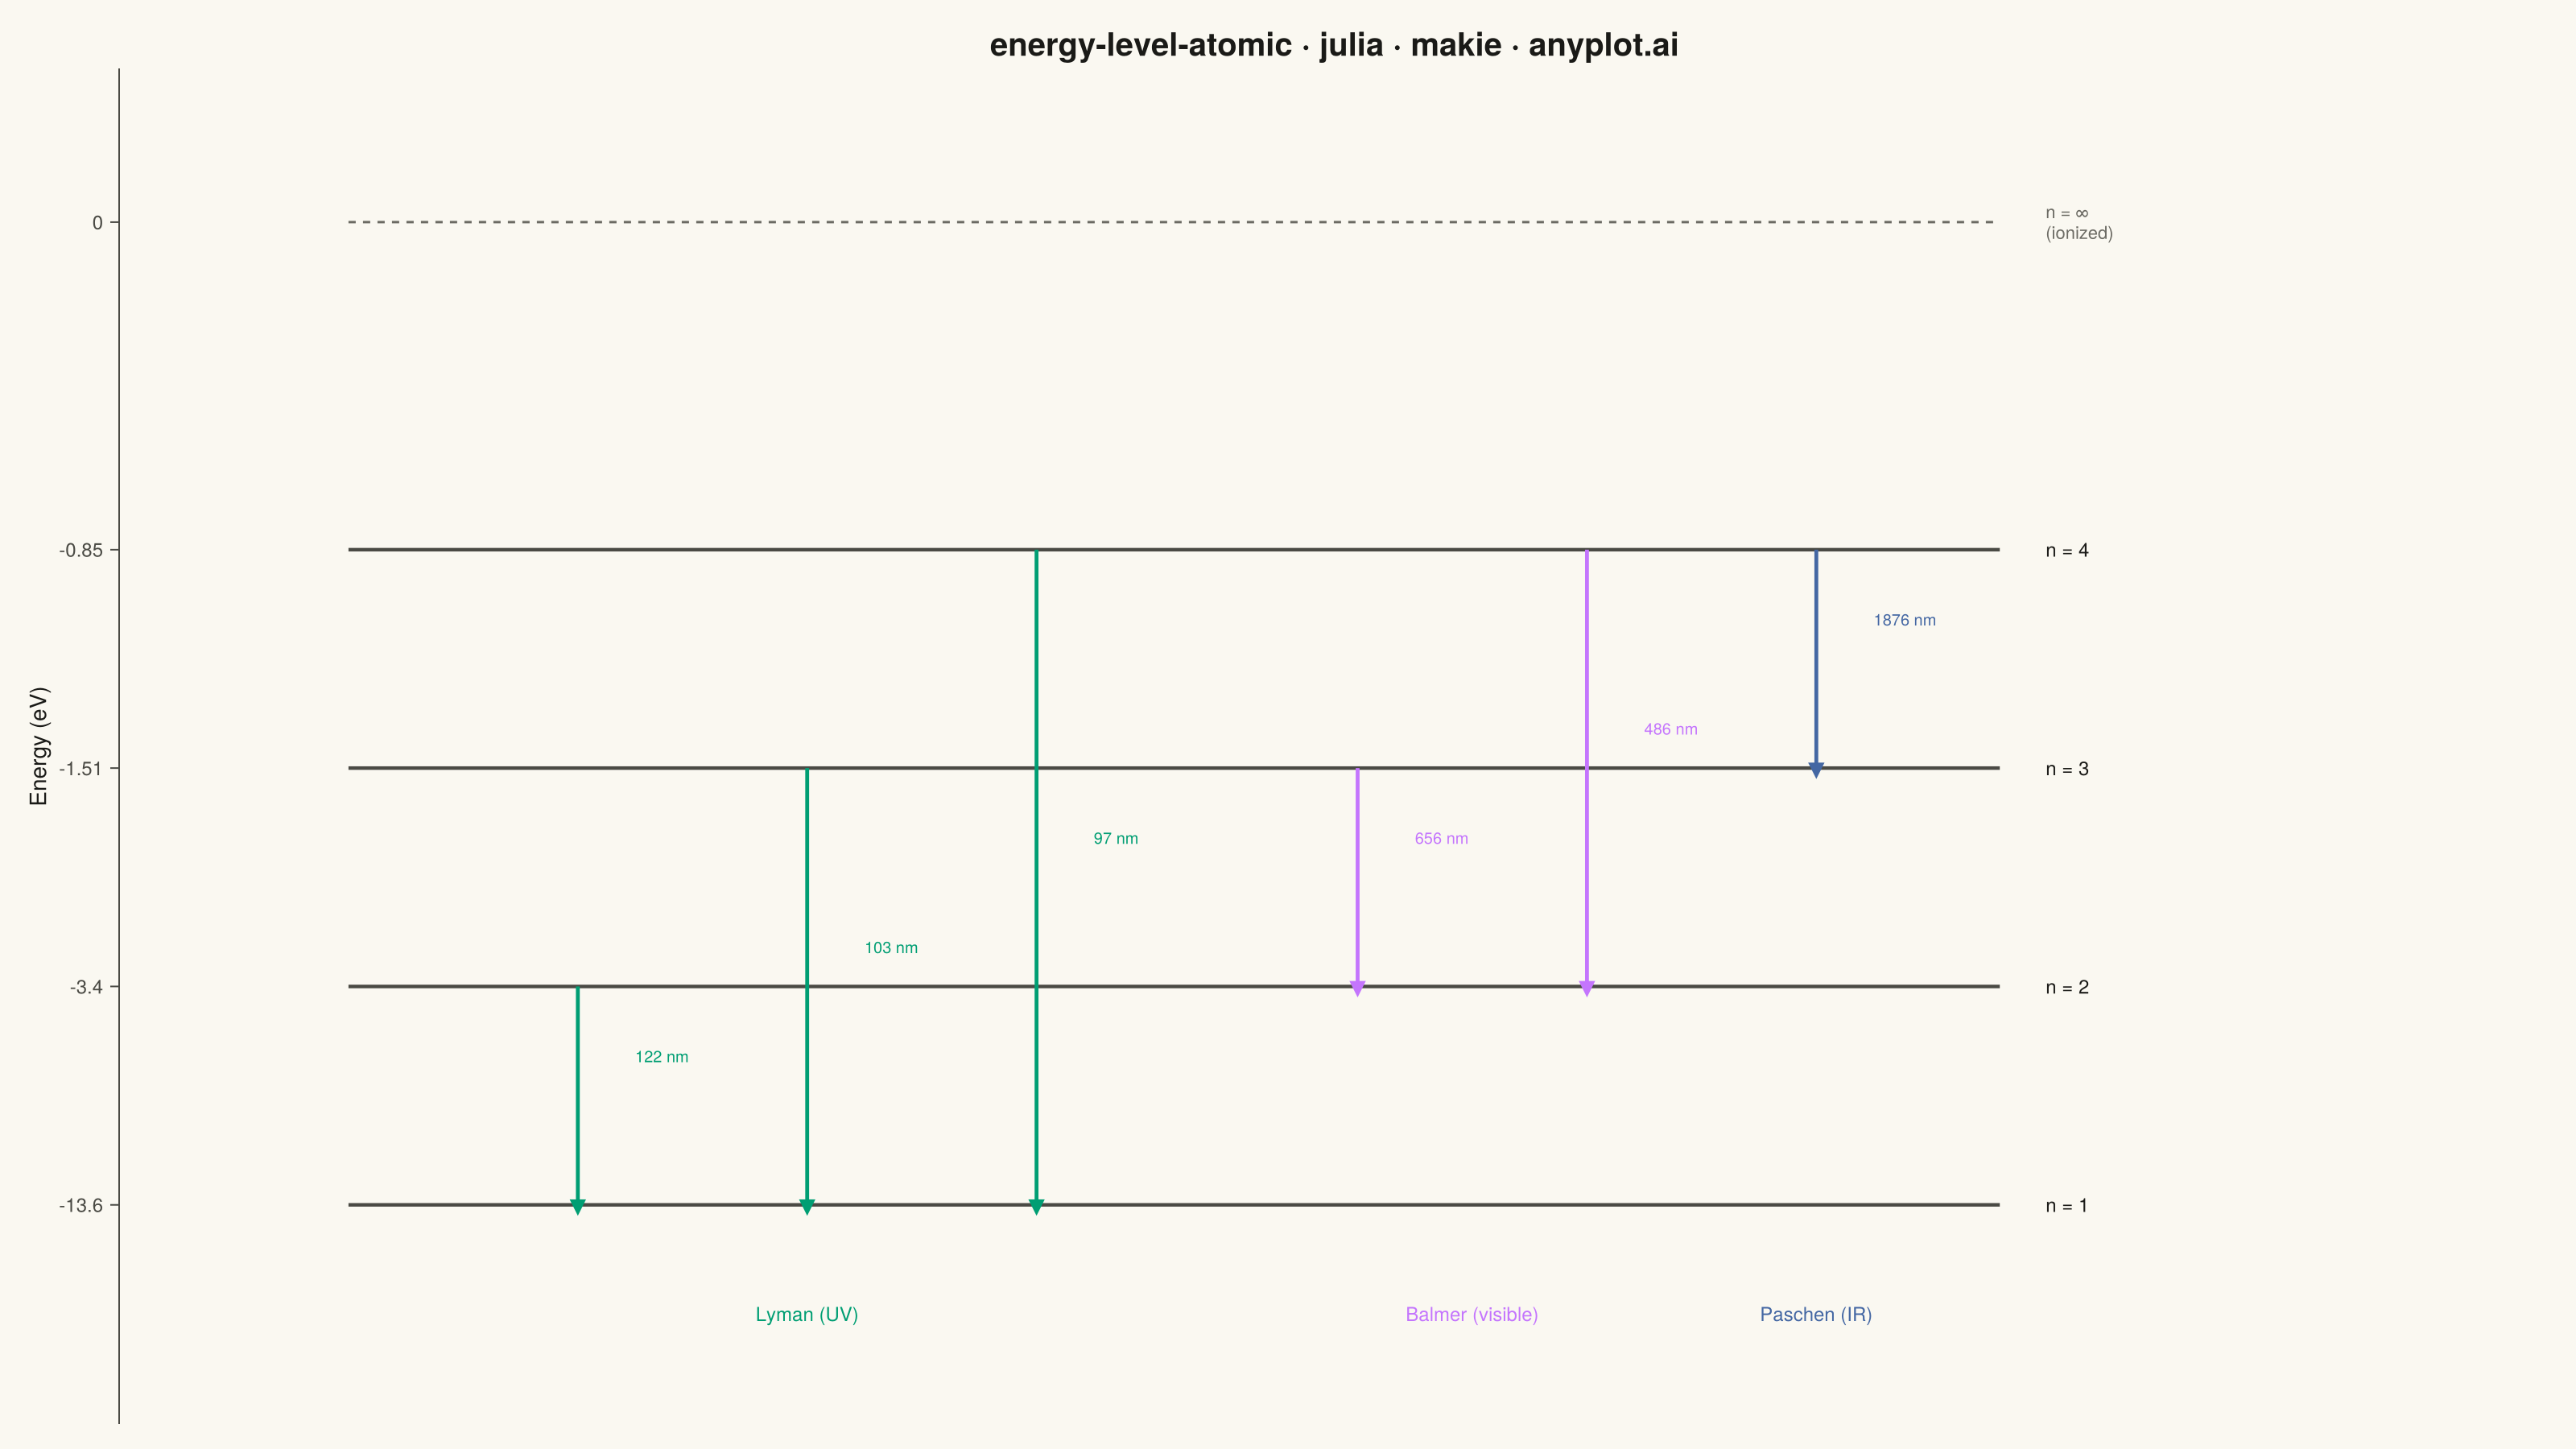
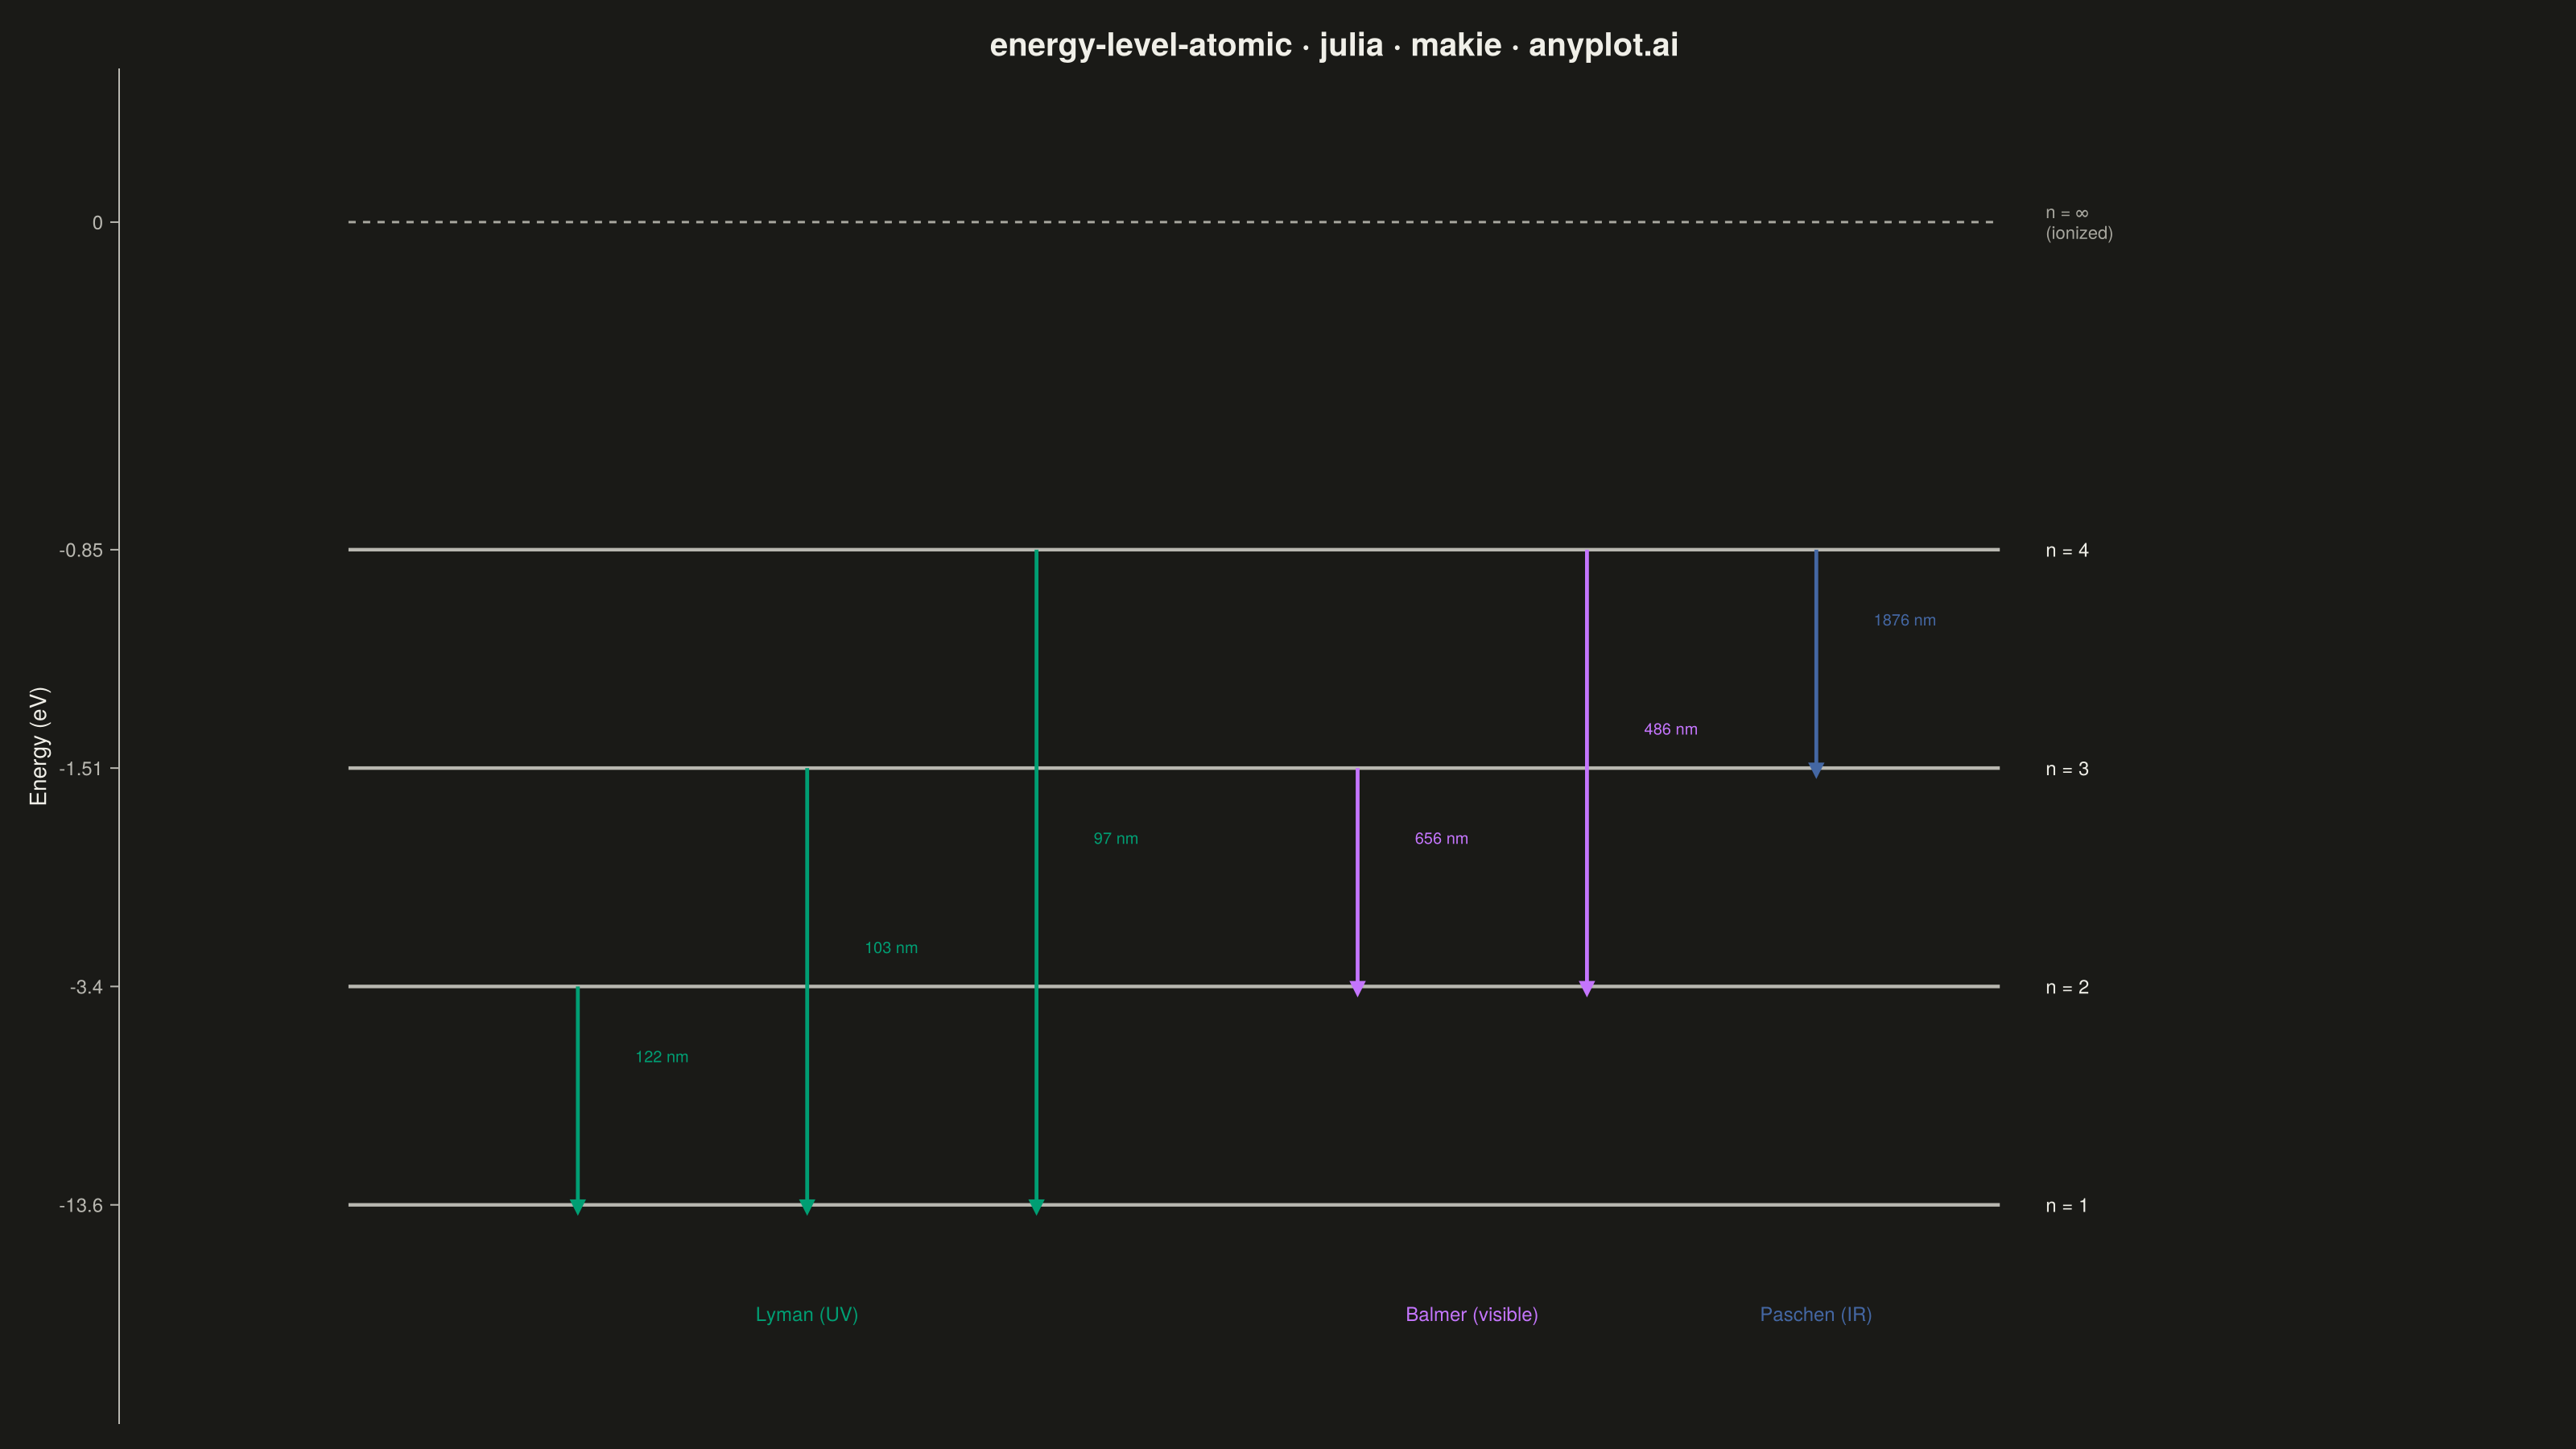
An energy level diagram displays quantized energy states as horizontal lines positioned at their respective energy values, with vertical arrows representing transitions between levels. This visualization reveals the discrete nature of atomic and molecular energy structures, making it essential for understanding spectral series, electron configurations, and quantum state transitions. It provides an intuitive way to connect abstract quantum numbers to observable spectral phenomena.
# anyplot.ai
# energy-level-atomic: Atomic Energy Level Diagram
# Library: makie 0.22.10 | Julia 1.11.9
# Quality: 85/100 | Created: 2026-05-30

using CairoMakie
using Colors
using Printf

# Theme tokens — Imprint palette, theme-adaptive chrome
const THEME     = get(ENV, "ANYPLOT_THEME", "light")
const PAGE_BG   = THEME == "light" ? colorant"#FAF8F1" : colorant"#1A1A17"
const INK       = THEME == "light" ? colorant"#1A1A17" : colorant"#F0EFE8"
const INK_SOFT  = THEME == "light" ? colorant"#4A4A44" : colorant"#B8B7B0"
const INK_MUTED = THEME == "light" ? colorant"#6B6A63" : colorant"#A8A79F"

const IMPRINT_PALETTE = [
    colorant"#009E73",  # 1 brand green
    colorant"#C475FD",  # 2 lavender
    colorant"#4467A3",  # 3 blue
    colorant"#BD8233",  # 4 ochre
    colorant"#AE3030",  # 5 matte red
    colorant"#2ABCCD",  # 6 cyan
    colorant"#954477",  # 7 rose
    colorant"#99B314",  # 8 lime
]

# Hydrogen atom energy levels: E_n = -13.6 / n² eV
const energies = [-13.6 / n^2 for n in 1:4]

# Nonlinear display positions proportional to n (principal quantum number).
# This gives equal visual spacing between n = 1..4, fixing the linear-scale
# compression where n = 2/3/4 occupied only ~22% of the axis height.
const n_pos   = [1.0, 2.0, 3.0, 4.0]   # display y for n = 1..4
const ion_pos = 5.5                      # display y for n = ∞ (ionization)

# Rydberg wavelength: λ = hc / ΔE, using hc = 1240 eV·nm
function wavelength_nm(n_hi::Int, n_lo::Int)
    δe = 13.6 * (1.0 / n_lo^2 - 1.0 / n_hi^2)
    return 1240.0 / δe
end
fmt_λ(n_hi, n_lo) = @sprintf("%d nm", round(Int, wavelength_nm(n_hi, n_lo)))

# Emission transitions (from_n, to_n)
const lyman_transitions   = [(2, 1), (3, 1), (4, 1)]   # UV
const balmer_transitions  = [(3, 2), (4, 2)]            # visible
const paschen_transitions = [(4, 3)]                    # infrared

# Pseudo-x layout: level lines span [x_line_start, x_line_end]; labels at x_label
const x_line_start = 0.10
const x_line_end   = 0.82
const x_label      = 0.84
const lyman_xs     = [0.20, 0.30, 0.40]
const balmer_xs    = [0.54, 0.64]
const paschen_xs   = [0.74]

const lyman_color   = IMPRINT_PALETTE[1]   # brand green — Lyman UV
const balmer_color  = IMPRINT_PALETTE[2]   # lavender — Balmer visible
const paschen_color = IMPRINT_PALETTE[3]   # blue — Paschen infrared

# Y-axis ticks: actual energy values at the nonlinear display positions
const ytick_pos    = [n_pos..., ion_pos]
const ytick_labels = ["-13.6", "-3.4", "-1.51", "-0.85", "0"]

fig = Figure(
    size            = (1600, 900),
    fontsize        = 14,
    backgroundcolor = PAGE_BG,
)

ax = Axis(
    fig[1, 1];
    title               = "energy-level-atomic · julia · makie · anyplot.ai",
    titlesize           = 20,
    titlecolor          = INK,
    ylabel              = "Energy (eV)",
    ylabelcolor         = INK,
    ylabelsize          = 14,
    yticklabelcolor     = INK_SOFT,
    yticklabelsize      = 12,
    yticks              = (ytick_pos, ytick_labels),
    backgroundcolor     = PAGE_BG,
    topspinevisible     = false,
    rightspinevisible   = false,
    bottomspinevisible  = false,
    leftspinecolor      = INK_SOFT,
    ytickcolor          = INK_SOFT,
    xticksvisible       = false,
    xticklabelsvisible  = false,
    xgridvisible        = false,
    ygridvisible        = false,
)

# Energy level horizontal lines with quantum-number labels
for n in 1:4
    y = n_pos[n]
    lines!(ax, [x_line_start, x_line_end], [y, y];
           color = INK_SOFT, linewidth = 2.2)
    text!(ax, x_label, y;
          text     = "n = $n",
          color    = INK,
          fontsize = 12,
          align    = (:left, :center))
end

# Ionization continuum reference line (n = ∞, 0 eV)
lines!(ax, [x_line_start, x_line_end], [ion_pos, ion_pos];
       color     = INK_MUTED,
       linewidth = 1.5,
       linestyle = :dash)
text!(ax, x_label, ion_pos;
      text     = "n = ∞\n(ionized)",
      color    = INK_MUTED,
      fontsize = 11,
      align    = (:left, :center))

# Draw an emission arrow with a wavelength annotation at its midpoint.
# The +0.18 upward offset on the label clears any coincident level line.
function draw_arrow!(ax, xp, n_hi, n_lo, color)
    y_from = n_pos[n_hi]
    y_to   = n_pos[n_lo]
    arrows!(ax, [xp], [y_from], [0.0], [y_to - y_from];
            color = color, arrowsize = 14, linewidth = 2.4)
    text!(ax, xp + 0.025, (y_from + y_to) / 2 + 0.18;
          text  = fmt_λ(n_hi, n_lo),
          color = color, fontsize = 10, align = (:left, :center))
end

for (i, (fn, tn)) in enumerate(lyman_transitions)
    draw_arrow!(ax, lyman_xs[i], fn, tn, lyman_color)
end
for (i, (fn, tn)) in enumerate(balmer_transitions)
    draw_arrow!(ax, balmer_xs[i], fn, tn, balmer_color)
end
for (i, (fn, tn)) in enumerate(paschen_transitions)
    draw_arrow!(ax, paschen_xs[i], fn, tn, paschen_color)
end

# Series legend below n = 1
text!(ax, 0.30, 0.5; text = "Lyman (UV)",
      color = lyman_color, fontsize = 12, align = (:center, :center))
text!(ax, 0.59, 0.5; text = "Balmer (visible)",
      color = balmer_color, fontsize = 12, align = (:center, :center))
text!(ax, 0.74, 0.5; text = "Paschen (IR)",
      color = paschen_color, fontsize = 12, align = (:center, :center))

xlims!(ax, 0.0, 1.06)
ylims!(ax, 0.0, 6.2)

save("plot-$(THEME).png", fig; px_per_unit = 2)
Runnable source as JSON, for any HTTP client: https://api.anyplot.ai/specs/energy-level-atomic/makie/code. Any spec id and library id listed in llms-full.txt fit the same URL shape; every URL below is complete and callable.
{
  "spec_id": "energy-level-atomic",
  "language": "julia",
  "library": "makie",
  "page": "https://anyplot.ai/energy-level-atomic/julia/makie",
  "hub": "https://anyplot.ai/energy-level-atomic",
  "code_json": "https://api.anyplot.ai/specs/energy-level-atomic/makie/code",
  "spec_json": "https://api.anyplot.ai/specs/energy-level-atomic",
  "render_light_png": "https://storage.googleapis.com/anyplot-images/plots/energy-level-atomic/julia/makie/plot-light.png",
  "render_dark_png": "https://storage.googleapis.com/anyplot-images/plots/energy-level-atomic/julia/makie/plot-dark.png",
  "quality_score": 85.0,
  "license": "MIT",
  "guide": "https://anyplot.ai/llms.txt"
}
Part of Atomic Energy Level Diagram on anyplot.ai.