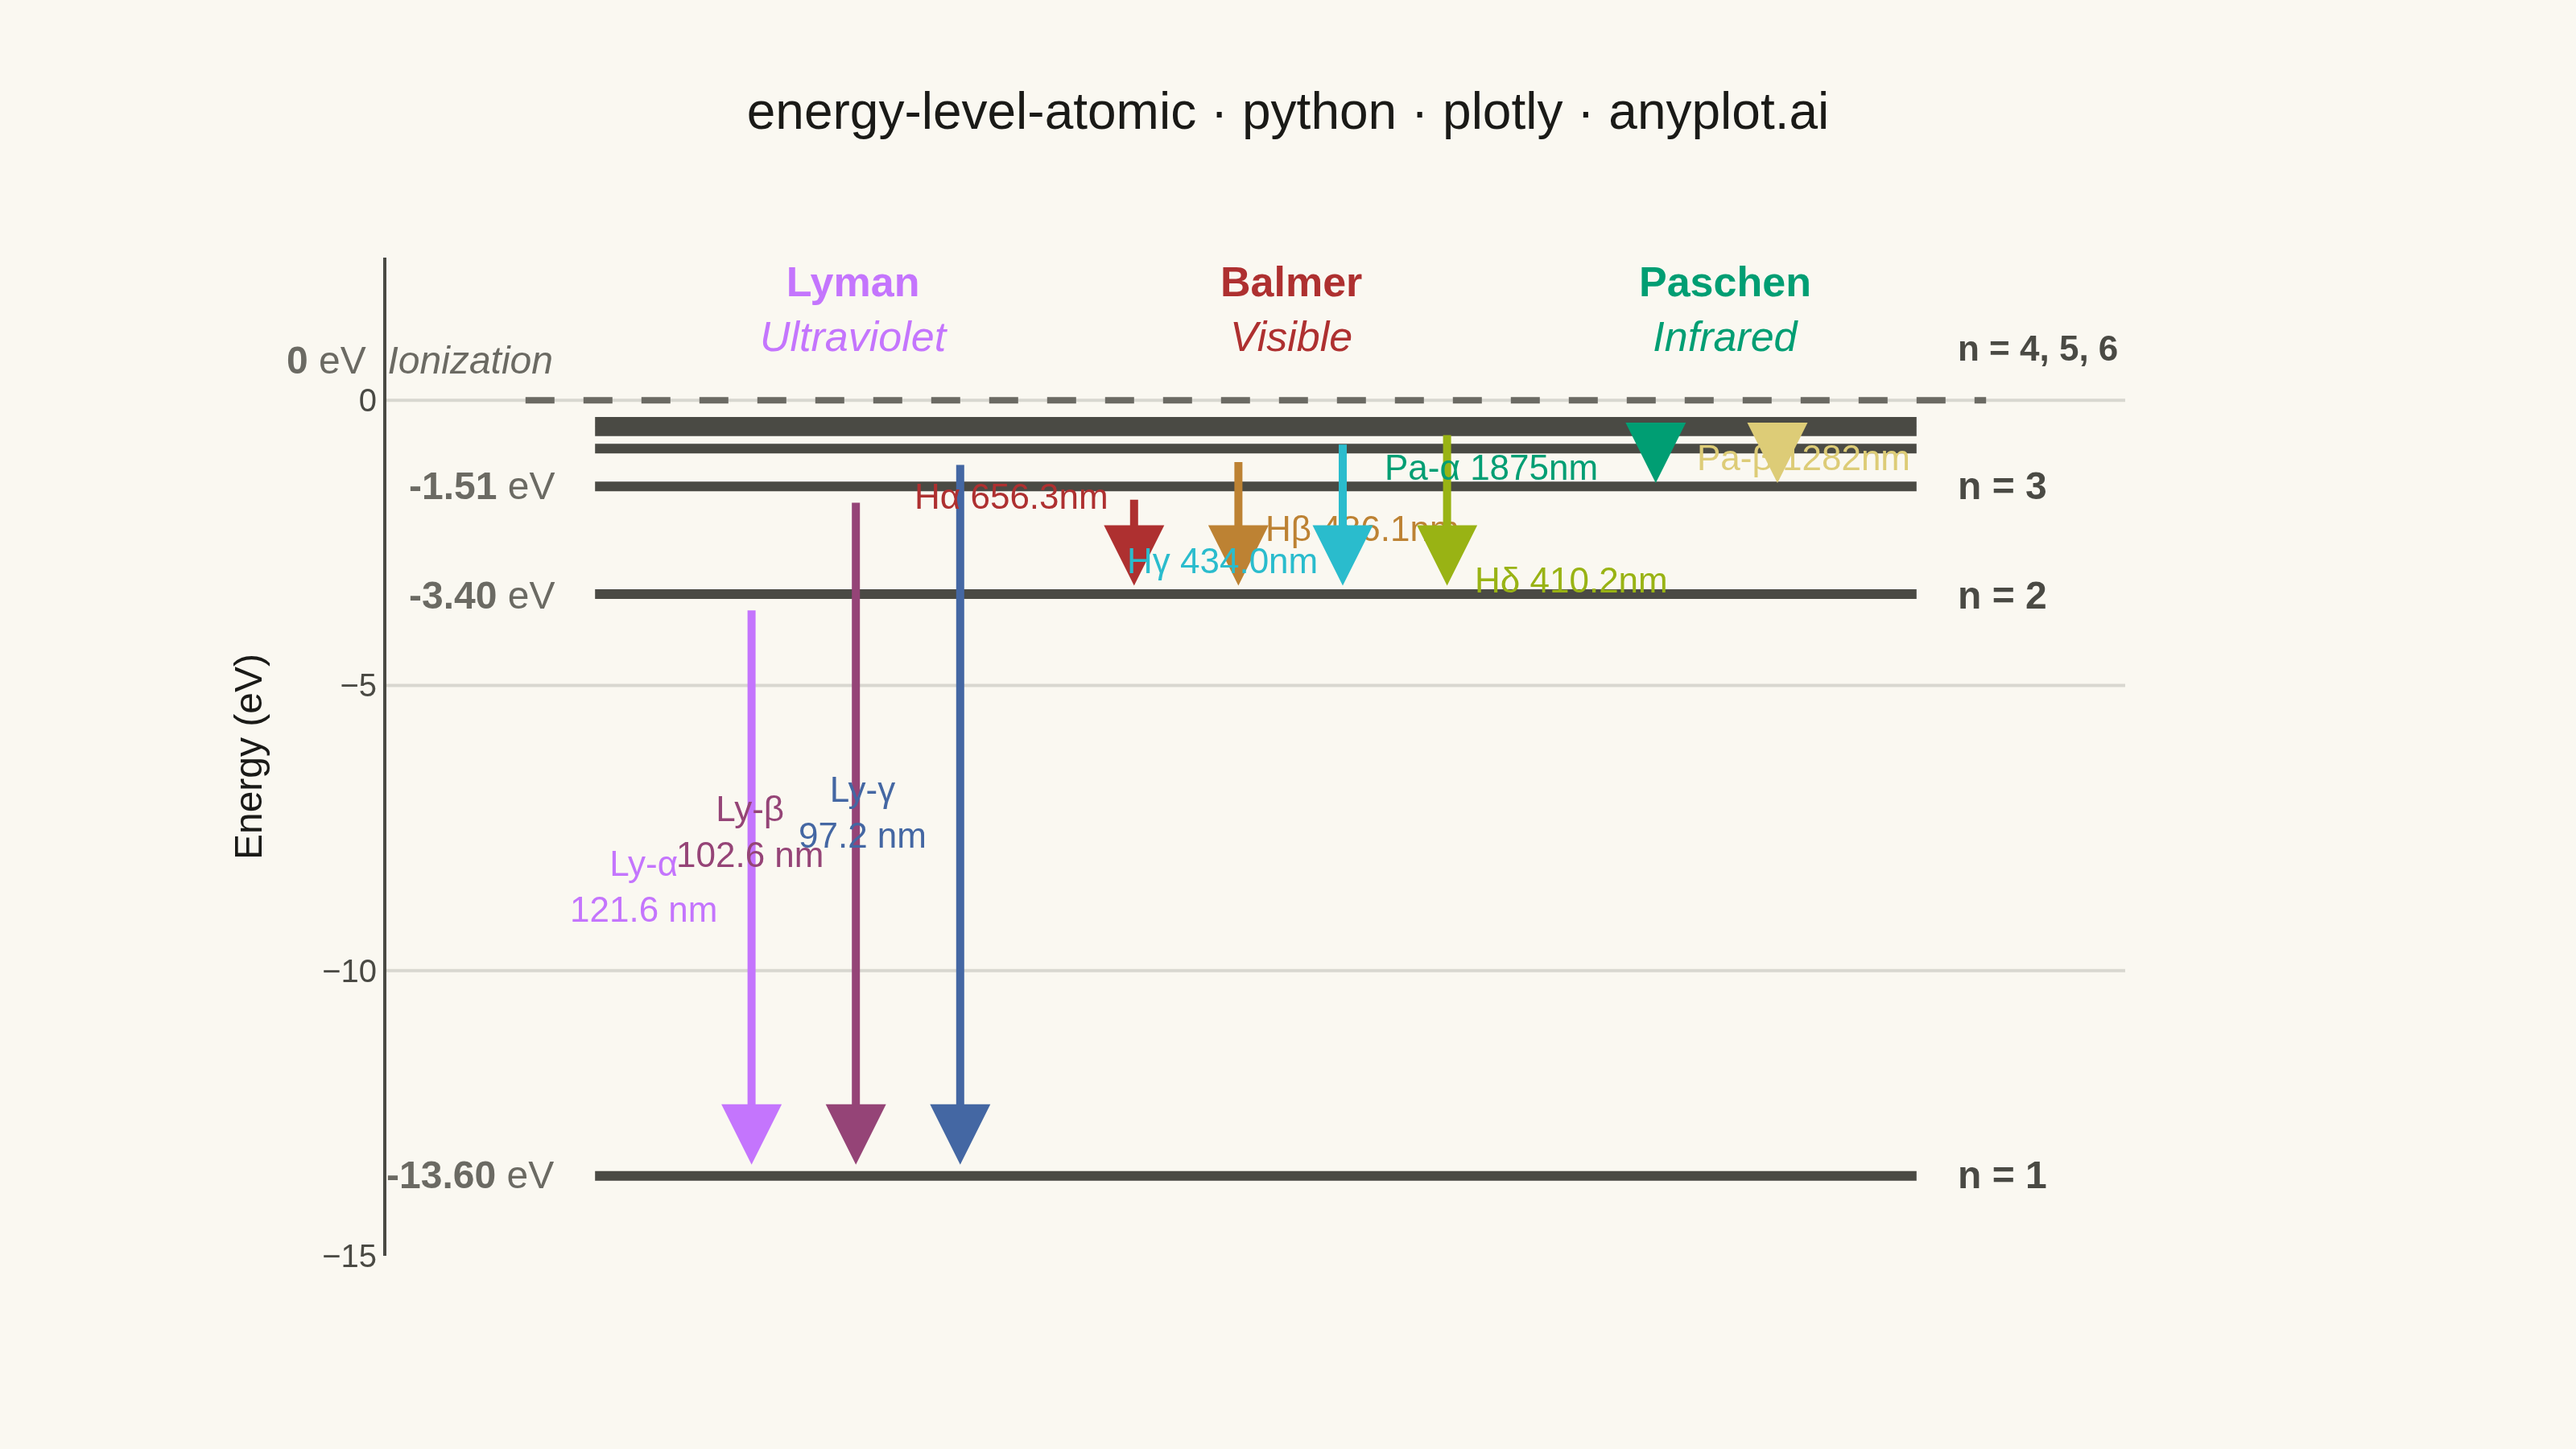
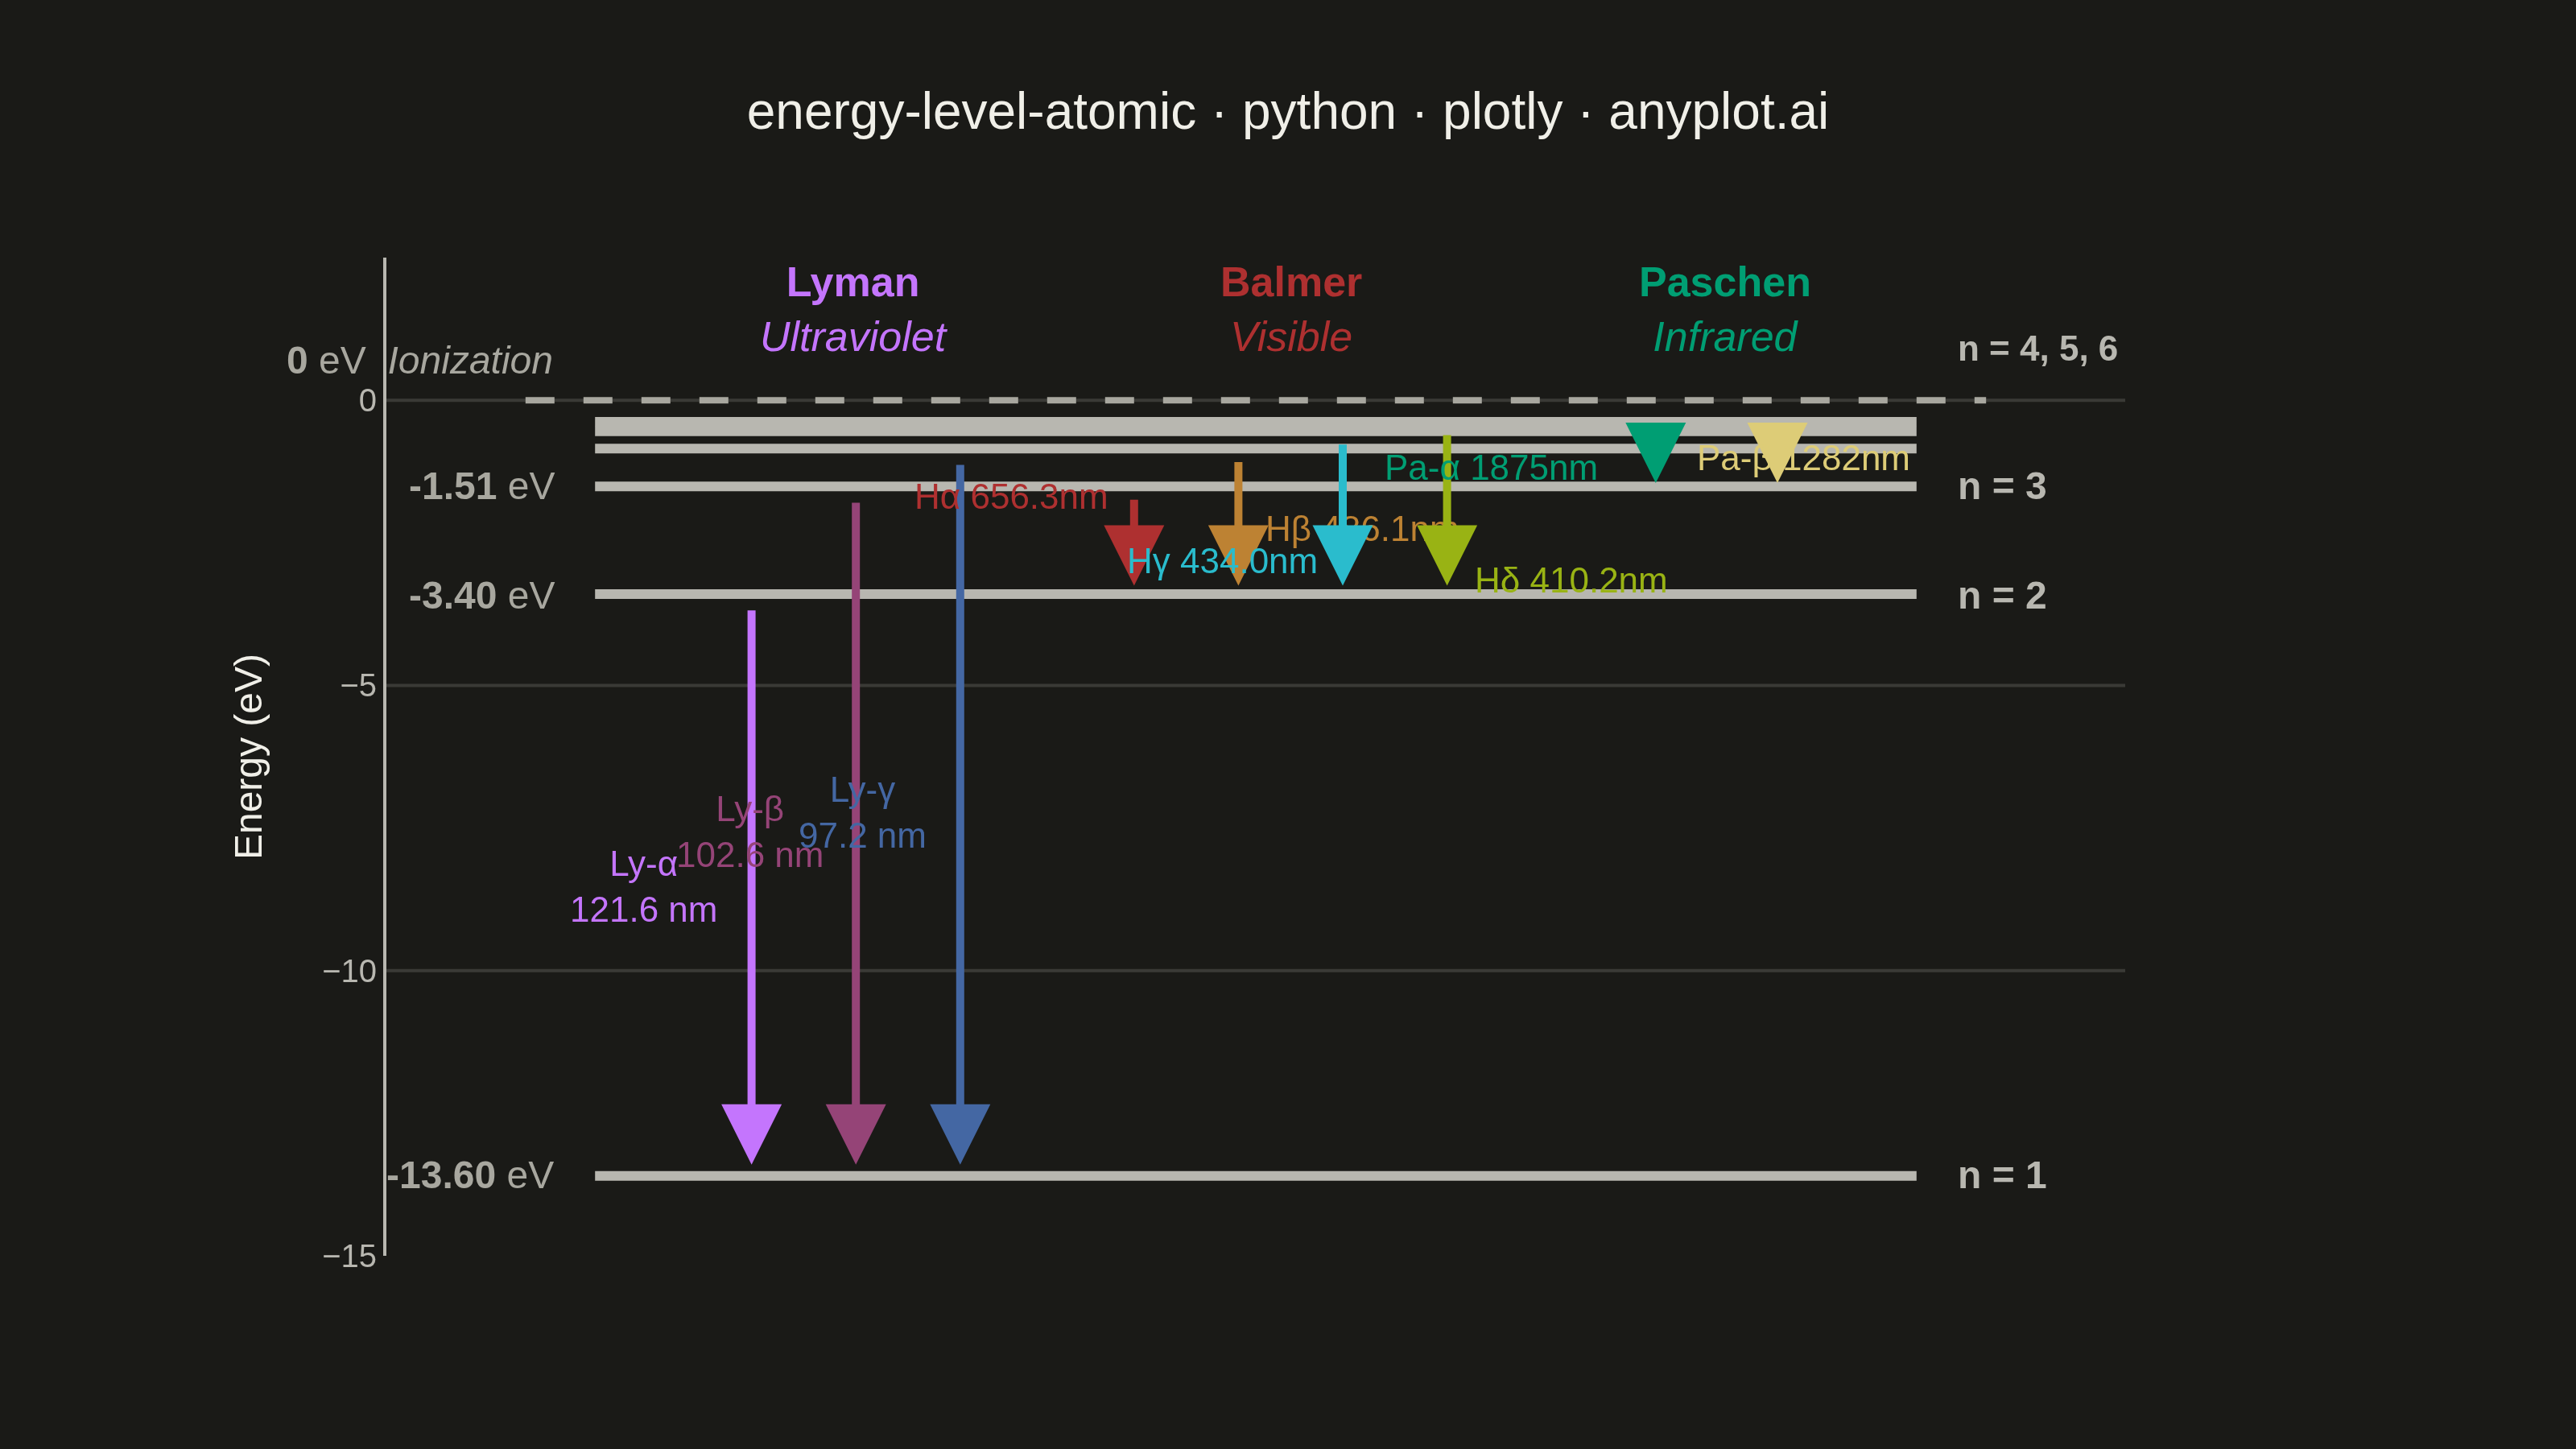
An energy level diagram displays quantized energy states as horizontal lines positioned at their respective energy values, with vertical arrows representing transitions between levels. This visualization reveals the discrete nature of atomic and molecular energy structures, making it essential for understanding spectral series, electron configurations, and quantum state transitions. It provides an intuitive way to connect abstract quantum numbers to observable spectral phenomena.
""" anyplot.ai
energy-level-atomic: Atomic Energy Level Diagram
Library: plotly 6.7.0 | Python 3.13.13
Quality: 87/100 | Updated: 2026-05-30
"""

import os

import plotly.graph_objects as go


# Theme
THEME = os.getenv("ANYPLOT_THEME", "light")

# Theme-adaptive chrome (Imprint palette)
PAGE_BG = "#FAF8F1" if THEME == "light" else "#1A1A17"
ELEVATED_BG = "#FFFDF6" if THEME == "light" else "#242420"
INK = "#1A1A17" if THEME == "light" else "#F0EFE8"
INK_SOFT = "#4A4A44" if THEME == "light" else "#B8B7B0"
INK_MUTED = "#6B6A63" if THEME == "light" else "#A8A79F"
GRID = "rgba(26,26,23,0.15)" if THEME == "light" else "rgba(240,239,232,0.15)"

# Imprint palette — series colors grouped by spectral series
# Lyman (UV): purple family for invisible ultraviolet
lyman_colors = ["#C475FD", "#954477", "#4467A3"]
# Balmer (visible): red/ochre/cyan/lime — physically motivated + clearly distinct
balmer_colors = ["#AE3030", "#BD8233", "#2ABCCD", "#99B314"]
# Paschen (IR): green family — cool tones, no warm-hue overlap with Balmer
paschen_colors = ["#009E73", "#DDCC77"]

# Data — Hydrogen atom energy levels (E_n = -13.6/n² eV)
quantum_numbers = [1, 2, 3, 4, 5, 6]
energies = {n: -13.6 / n**2 for n in quantum_numbers}

# Transitions: (upper_n, lower_n, display_label, wavelength_nm)
lyman_series = [(2, 1, "Ly-α<br>121.6 nm", 121.6), (3, 1, "Ly-β<br>102.6 nm", 102.6), (4, 1, "Ly-γ<br>97.2 nm", 97.2)]
balmer_series = [
    (3, 2, "Hα 656.3nm", 656.3),
    (4, 2, "Hβ 486.1nm", 486.1),
    (5, 2, "Hγ 434.0nm", 434.0),
    (6, 2, "Hδ 410.2nm", 410.2),
]
paschen_series = [(4, 3, "Pa-α 1875nm", 1875.1), (5, 3, "Pa-β 1282nm", 1281.8)]

fig = go.Figure()

# Energy level lines — use INK_SOFT for structural chrome
line_left = 0.12
line_right = 0.88
for n in quantum_numbers:
    energy = energies[n]
    fig.add_trace(
        go.Scatter(
            x=[line_left, line_right],
            y=[energy, energy],
            mode="lines",
            line={"color": INK_SOFT, "width": 3},
            showlegend=False,
            hovertemplate=f"<b>n = {n}</b><br>E = {energy:.2f} eV<extra></extra>",
        )
    )

# Ionization limit — dashed muted line at 0 eV
fig.add_trace(
    go.Scatter(
        x=[0.08, 0.92],
        y=[0, 0],
        mode="lines",
        line={"color": INK_MUTED, "width": 2, "dash": "dash"},
        showlegend=False,
        hovertemplate="<b>Ionization Limit</b><br>E = 0 eV  (n → ∞)<extra></extra>",
    )
)

# Quantum number labels — right side
# n=1, n=2, n=3 are well-separated; individual labels are clean
for n in [1, 2, 3]:
    fig.add_annotation(
        x=line_right + 0.02,
        y=energies[n],
        text=f"<b>n = {n}</b>",
        showarrow=False,
        font={"size": 12, "color": INK_SOFT},
        xanchor="left",
        yanchor="middle",
    )

# n=4, 5, 6 converge tightly near 0 eV — single combined label above ionization limit
fig.add_annotation(
    x=line_right + 0.02,
    y=0.45,
    text="<b>n = 4, 5, 6</b>",
    showarrow=False,
    font={"size": 11, "color": INK_SOFT},
    xanchor="left",
    yanchor="bottom",
)

# Left-side energy values for well-separated levels
for n in [1, 2, 3]:
    fig.add_annotation(
        x=line_left - 0.02,
        y=energies[n],
        text=f"<b>{energies[n]:.2f}</b> eV",
        showarrow=False,
        font={"size": 12, "color": INK_MUTED},
        xanchor="right",
        yanchor="middle",
    )

# Ionization label above the dashed line
fig.add_annotation(
    x=line_left - 0.02,
    y=0,
    text="<b>0</b> eV  <i>Ionization</i>",
    showarrow=False,
    font={"size": 12, "color": INK_MUTED},
    xanchor="right",
    yanchor="bottom",
    yshift=3,
)

# --- Lyman Series (UV) — left portion ---
lyman_x = [0.21, 0.27, 0.33]
for i, (n_up, n_low, label, _wl) in enumerate(lyman_series):
    e_up, e_low = energies[n_up], energies[n_low]
    fig.add_annotation(
        x=lyman_x[i],
        y=e_low + 0.2,
        ax=lyman_x[i],
        ay=e_up - 0.2,
        xref="x",
        yref="y",
        axref="x",
        ayref="y",
        showarrow=True,
        arrowhead=2,
        arrowsize=1.5,
        arrowwidth=2.5,
        arrowcolor=lyman_colors[i],
        text="",
    )
    fig.add_annotation(
        x=lyman_x[i] - 0.015,
        y=(e_up + e_low) / 2,
        text=label,
        showarrow=False,
        font={"size": 11, "color": lyman_colors[i]},
        xanchor="right",
    )

# --- Balmer Series (Visible) — center portion ---
# Labels staggered vertically across the n=2–n=4 range and alternated left/right
# to prevent crowding (all four transitions end at n=2, so midpoints cluster)
balmer_x = [0.43, 0.49, 0.55, 0.61]
balmer_label_configs = [
    (-0.012, "right", -1.65),  # Hα: left of arrow, upper
    (0.012, "left", -2.25),  # Hβ: right of arrow, upper-mid
    (-0.012, "right", -2.80),  # Hγ: left of arrow, lower-mid
    (0.012, "left", -3.15),  # Hδ: right of arrow, lower
]
for i, (n_up, n_low, label, _wl) in enumerate(balmer_series):
    e_up, e_low = energies[n_up], energies[n_low]
    xoff, xanc, ylbl = balmer_label_configs[i]
    fig.add_annotation(
        x=balmer_x[i],
        y=e_low + 0.15,
        ax=balmer_x[i],
        ay=e_up - 0.15,
        xref="x",
        yref="y",
        axref="x",
        ayref="y",
        showarrow=True,
        arrowhead=2,
        arrowsize=1.5,
        arrowwidth=2.5,
        arrowcolor=balmer_colors[i],
        text="",
    )
    fig.add_annotation(
        x=balmer_x[i] + xoff,
        y=ylbl,
        text=label,
        showarrow=False,
        font={"size": 11, "color": balmer_colors[i]},
        xanchor=xanc,
    )

# --- Paschen Series (Infrared) — right portion ---
# Labels at transition midpoints, alternating sides to avoid overlap and the Balmer zone
paschen_x = [0.73, 0.80]
# Pa-α: label to LEFT of its arrow; Pa-β: label to RIGHT (x>0.85, clear of Balmer zone)
paschen_label_configs = [
    (0.70, "right"),  # Pa-α: left of arrow at 0.73
    (0.88, "right"),  # Pa-β: right side (x>0.85), ending before n-label zone
]
for i, (n_up, n_low, label, _wl) in enumerate(paschen_series):
    e_up, e_low = energies[n_up], energies[n_low]
    fig.add_annotation(
        x=paschen_x[i],
        y=e_low + 0.06,
        ax=paschen_x[i],
        ay=e_up - 0.06,
        xref="x",
        yref="y",
        axref="x",
        ayref="y",
        showarrow=True,
        arrowhead=2,
        arrowsize=1.5,
        arrowwidth=2.5,
        arrowcolor=paschen_colors[i],
        text="",
    )
    lx, xanc = paschen_label_configs[i]
    fig.add_annotation(
        x=lx,
        y=(e_up + e_low) / 2,
        text=label,
        showarrow=False,
        font={"size": 11, "color": paschen_colors[i]},
        xanchor=xanc,
    )

# Invisible hover targets at transition midpoints for HTML interactivity
for series, _colors, x_pos, name in [
    (lyman_series, lyman_colors, lyman_x, "Lyman"),
    (balmer_series, balmer_colors, balmer_x, "Balmer"),
    (paschen_series, paschen_colors, paschen_x, "Paschen"),
]:
    hover_x, hover_y, hover_labels = [], [], []
    for idx, (n_up, n_low, _lbl, wl) in enumerate(series):
        e_up, e_low = energies[n_up], energies[n_low]
        hover_x.append(x_pos[idx])
        hover_y.append((e_up + e_low) / 2)
        hover_labels.append(
            f"<b>{name} Series</b><br>n={n_up} → n={n_low}<br>λ = {wl} nm<br>ΔE = {abs(e_up - e_low):.2f} eV"
        )
    fig.add_trace(
        go.Scatter(
            x=hover_x,
            y=hover_y,
            mode="markers",
            marker={"size": 30, "opacity": 0},
            showlegend=False,
            hovertext=hover_labels,
            hoverinfo="text",
        )
    )

# Series group headers
fig.add_annotation(
    x=0.27,
    y=1.6,
    text="<b>Lyman</b><br><i>Ultraviolet</i>",
    showarrow=False,
    font={"size": 13, "color": lyman_colors[0]},
)
fig.add_annotation(
    x=0.52, y=1.6, text="<b>Balmer</b><br><i>Visible</i>", showarrow=False, font={"size": 13, "color": balmer_colors[0]}
)
fig.add_annotation(
    x=0.77,
    y=1.6,
    text="<b>Paschen</b><br><i>Infrared</i>",
    showarrow=False,
    font={"size": 13, "color": paschen_colors[0]},
)

# Layout
fig.update_layout(
    autosize=False,
    title={
        "text": "energy-level-atomic · python · plotly · anyplot.ai",
        "font": {"size": 16, "color": INK},
        "x": 0.5,
        "xanchor": "center",
    },
    xaxis={"visible": False, "range": [0, 1], "fixedrange": True},
    yaxis={
        "title": {"text": "Energy (eV)", "font": {"size": 12, "color": INK}},
        "tickfont": {"size": 10, "color": INK_SOFT},
        "range": [-15, 2.5],
        "zeroline": False,
        "showgrid": True,
        "gridcolor": GRID,
        "gridwidth": 1,
        "linecolor": INK_SOFT,
        "zerolinecolor": INK_SOFT,
    },
    paper_bgcolor=PAGE_BG,
    plot_bgcolor=PAGE_BG,
    font={"color": INK},
    margin={"l": 120, "r": 140, "t": 80, "b": 60},
    showlegend=False,
)

# Save — canonical 3200×1800 landscape canvas
fig.write_image(f"plot-{THEME}.png", width=800, height=450, scale=4)
fig.write_html(f"plot-{THEME}.html", include_plotlyjs="cdn")
Runnable source as JSON, for any HTTP client: https://api.anyplot.ai/specs/energy-level-atomic/plotly/code. Any spec id and library id listed in llms-full.txt fit the same URL shape; every URL below is complete and callable.
{
  "spec_id": "energy-level-atomic",
  "language": "python",
  "library": "plotly",
  "page": "https://anyplot.ai/energy-level-atomic/python/plotly",
  "hub": "https://anyplot.ai/energy-level-atomic",
  "code_json": "https://api.anyplot.ai/specs/energy-level-atomic/plotly/code",
  "spec_json": "https://api.anyplot.ai/specs/energy-level-atomic",
  "render_light_png": "https://storage.googleapis.com/anyplot-images/plots/energy-level-atomic/python/plotly/plot-light.png",
  "render_dark_png": "https://storage.googleapis.com/anyplot-images/plots/energy-level-atomic/python/plotly/plot-dark.png",
  "interactive_light_html": "https://storage.googleapis.com/anyplot-images/plots/energy-level-atomic/python/plotly/plot-light.html",
  "interactive_dark_html": "https://storage.googleapis.com/anyplot-images/plots/energy-level-atomic/python/plotly/plot-dark.html",
  "quality_score": 87.0,
  "license": "MIT",
  "guide": "https://anyplot.ai/llms.txt"
}
Part of Atomic Energy Level Diagram on anyplot.ai.