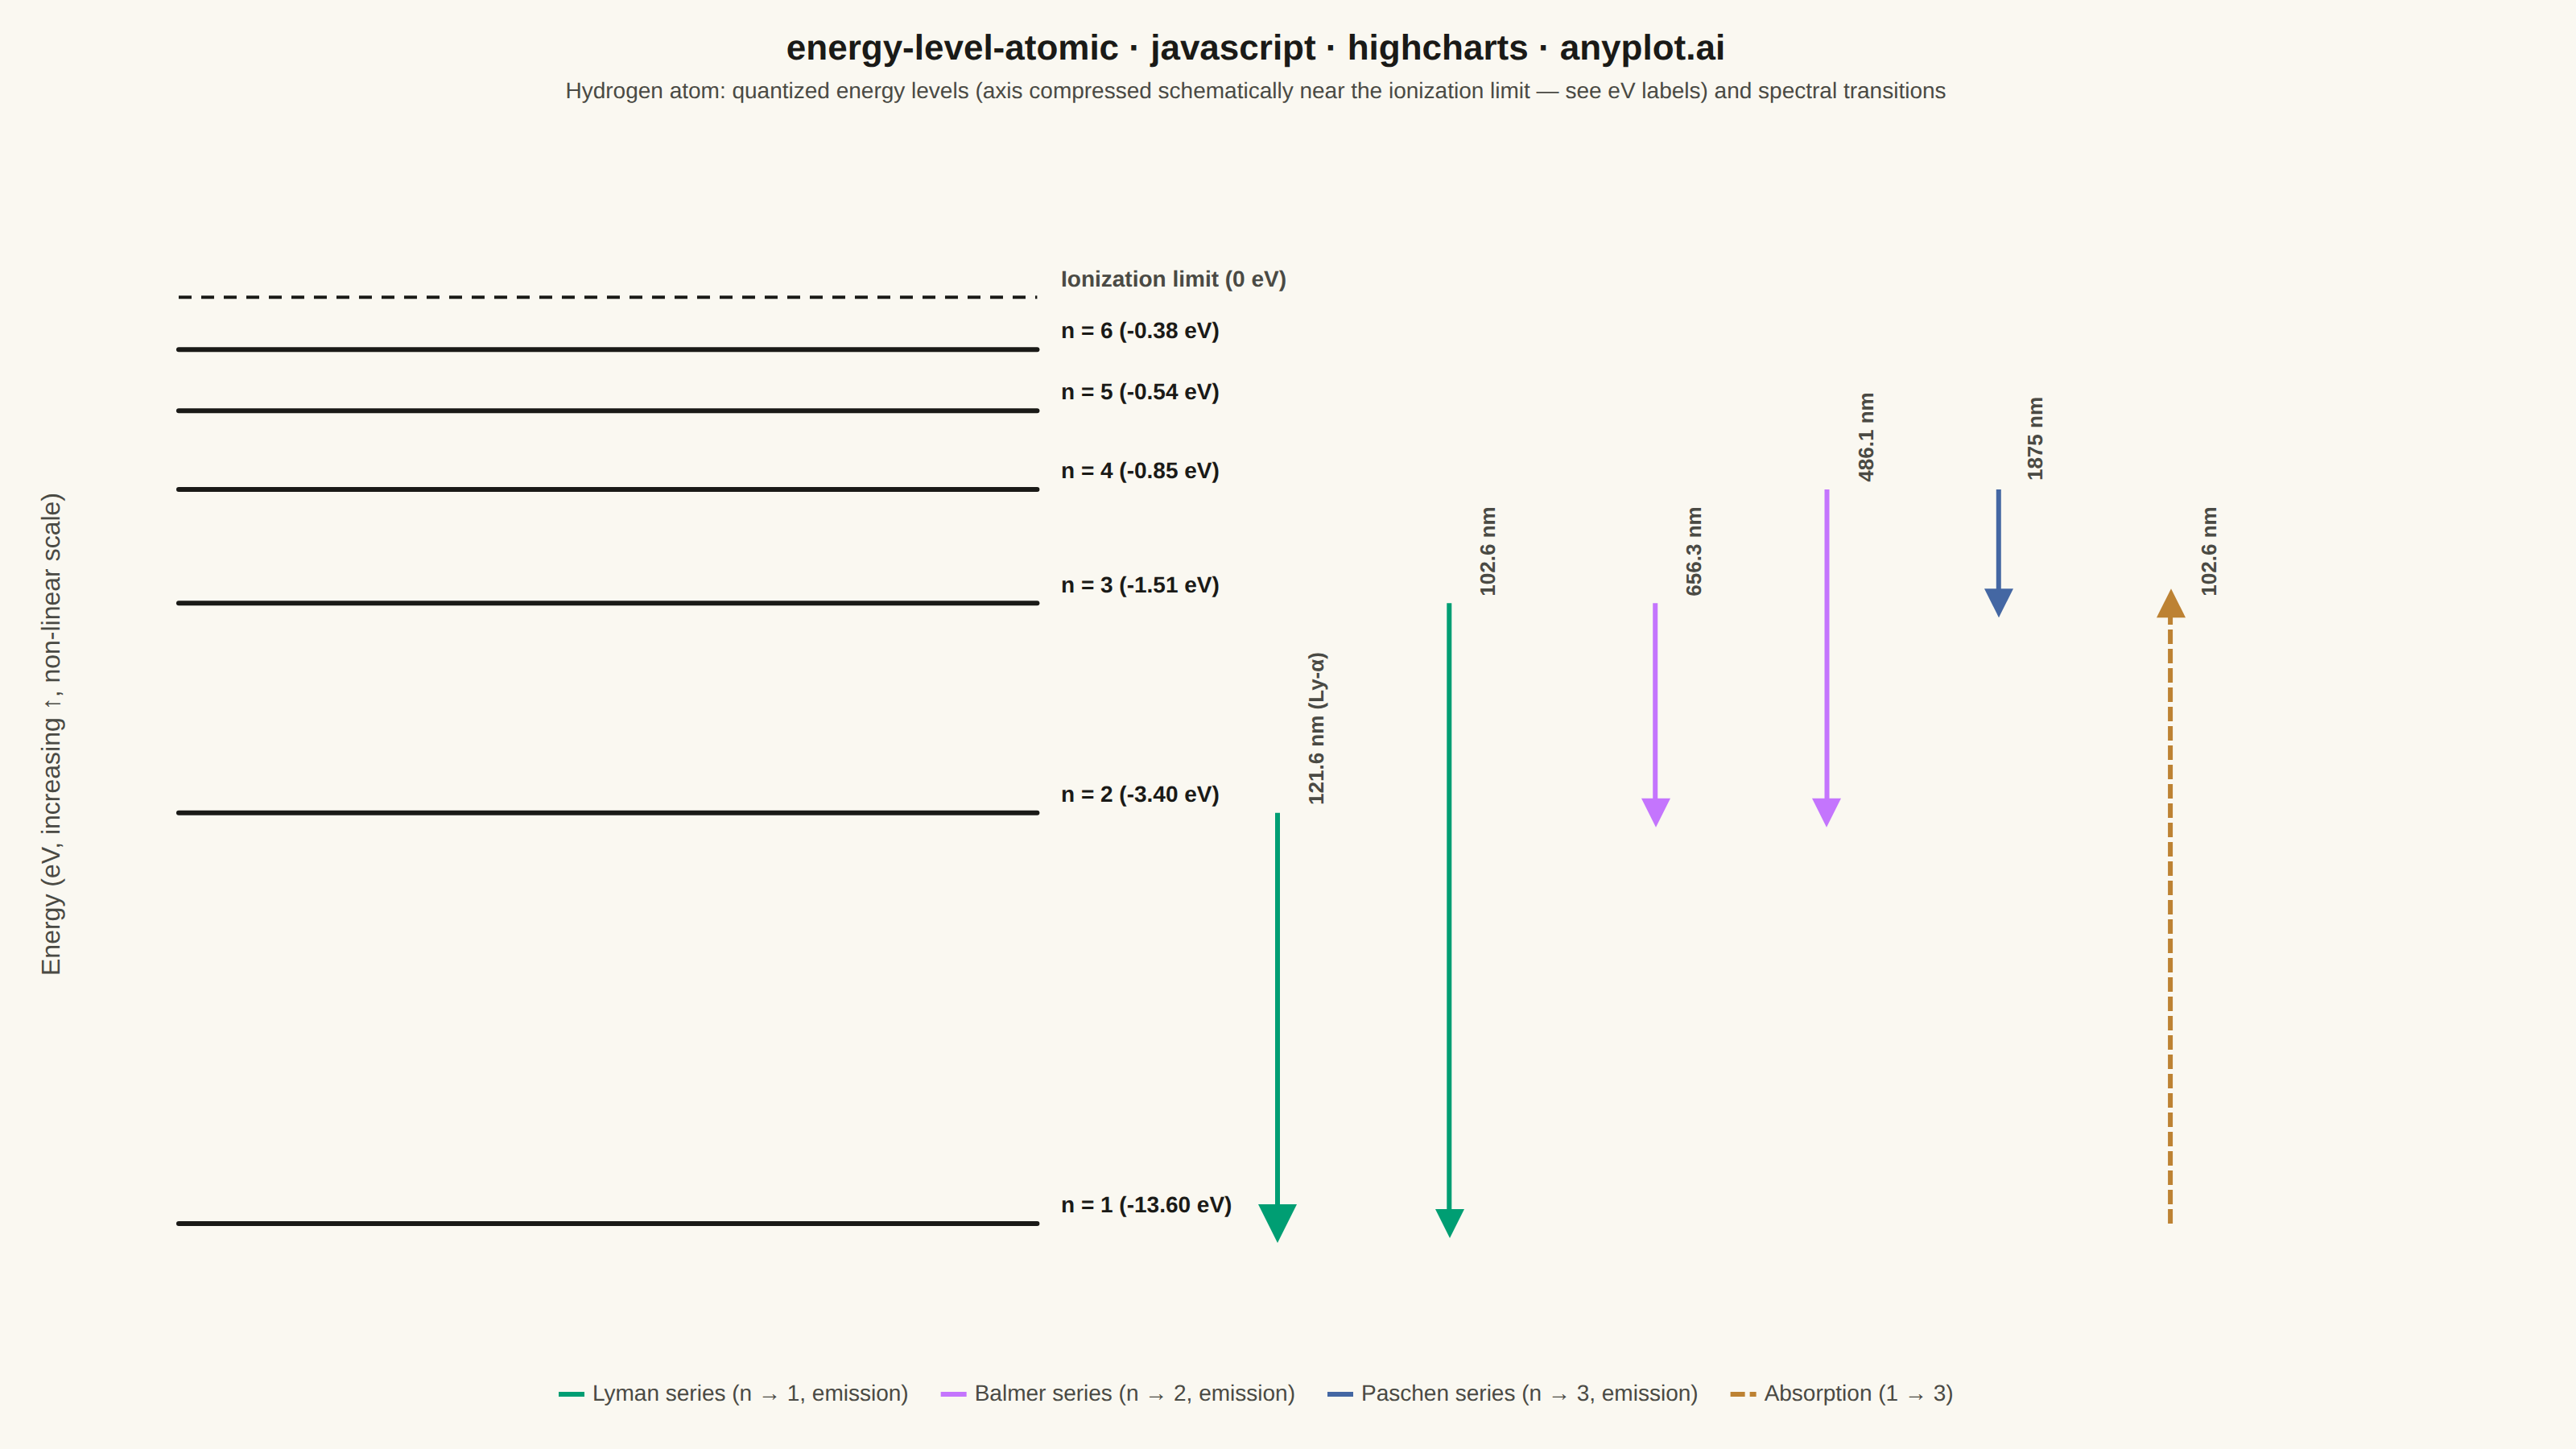
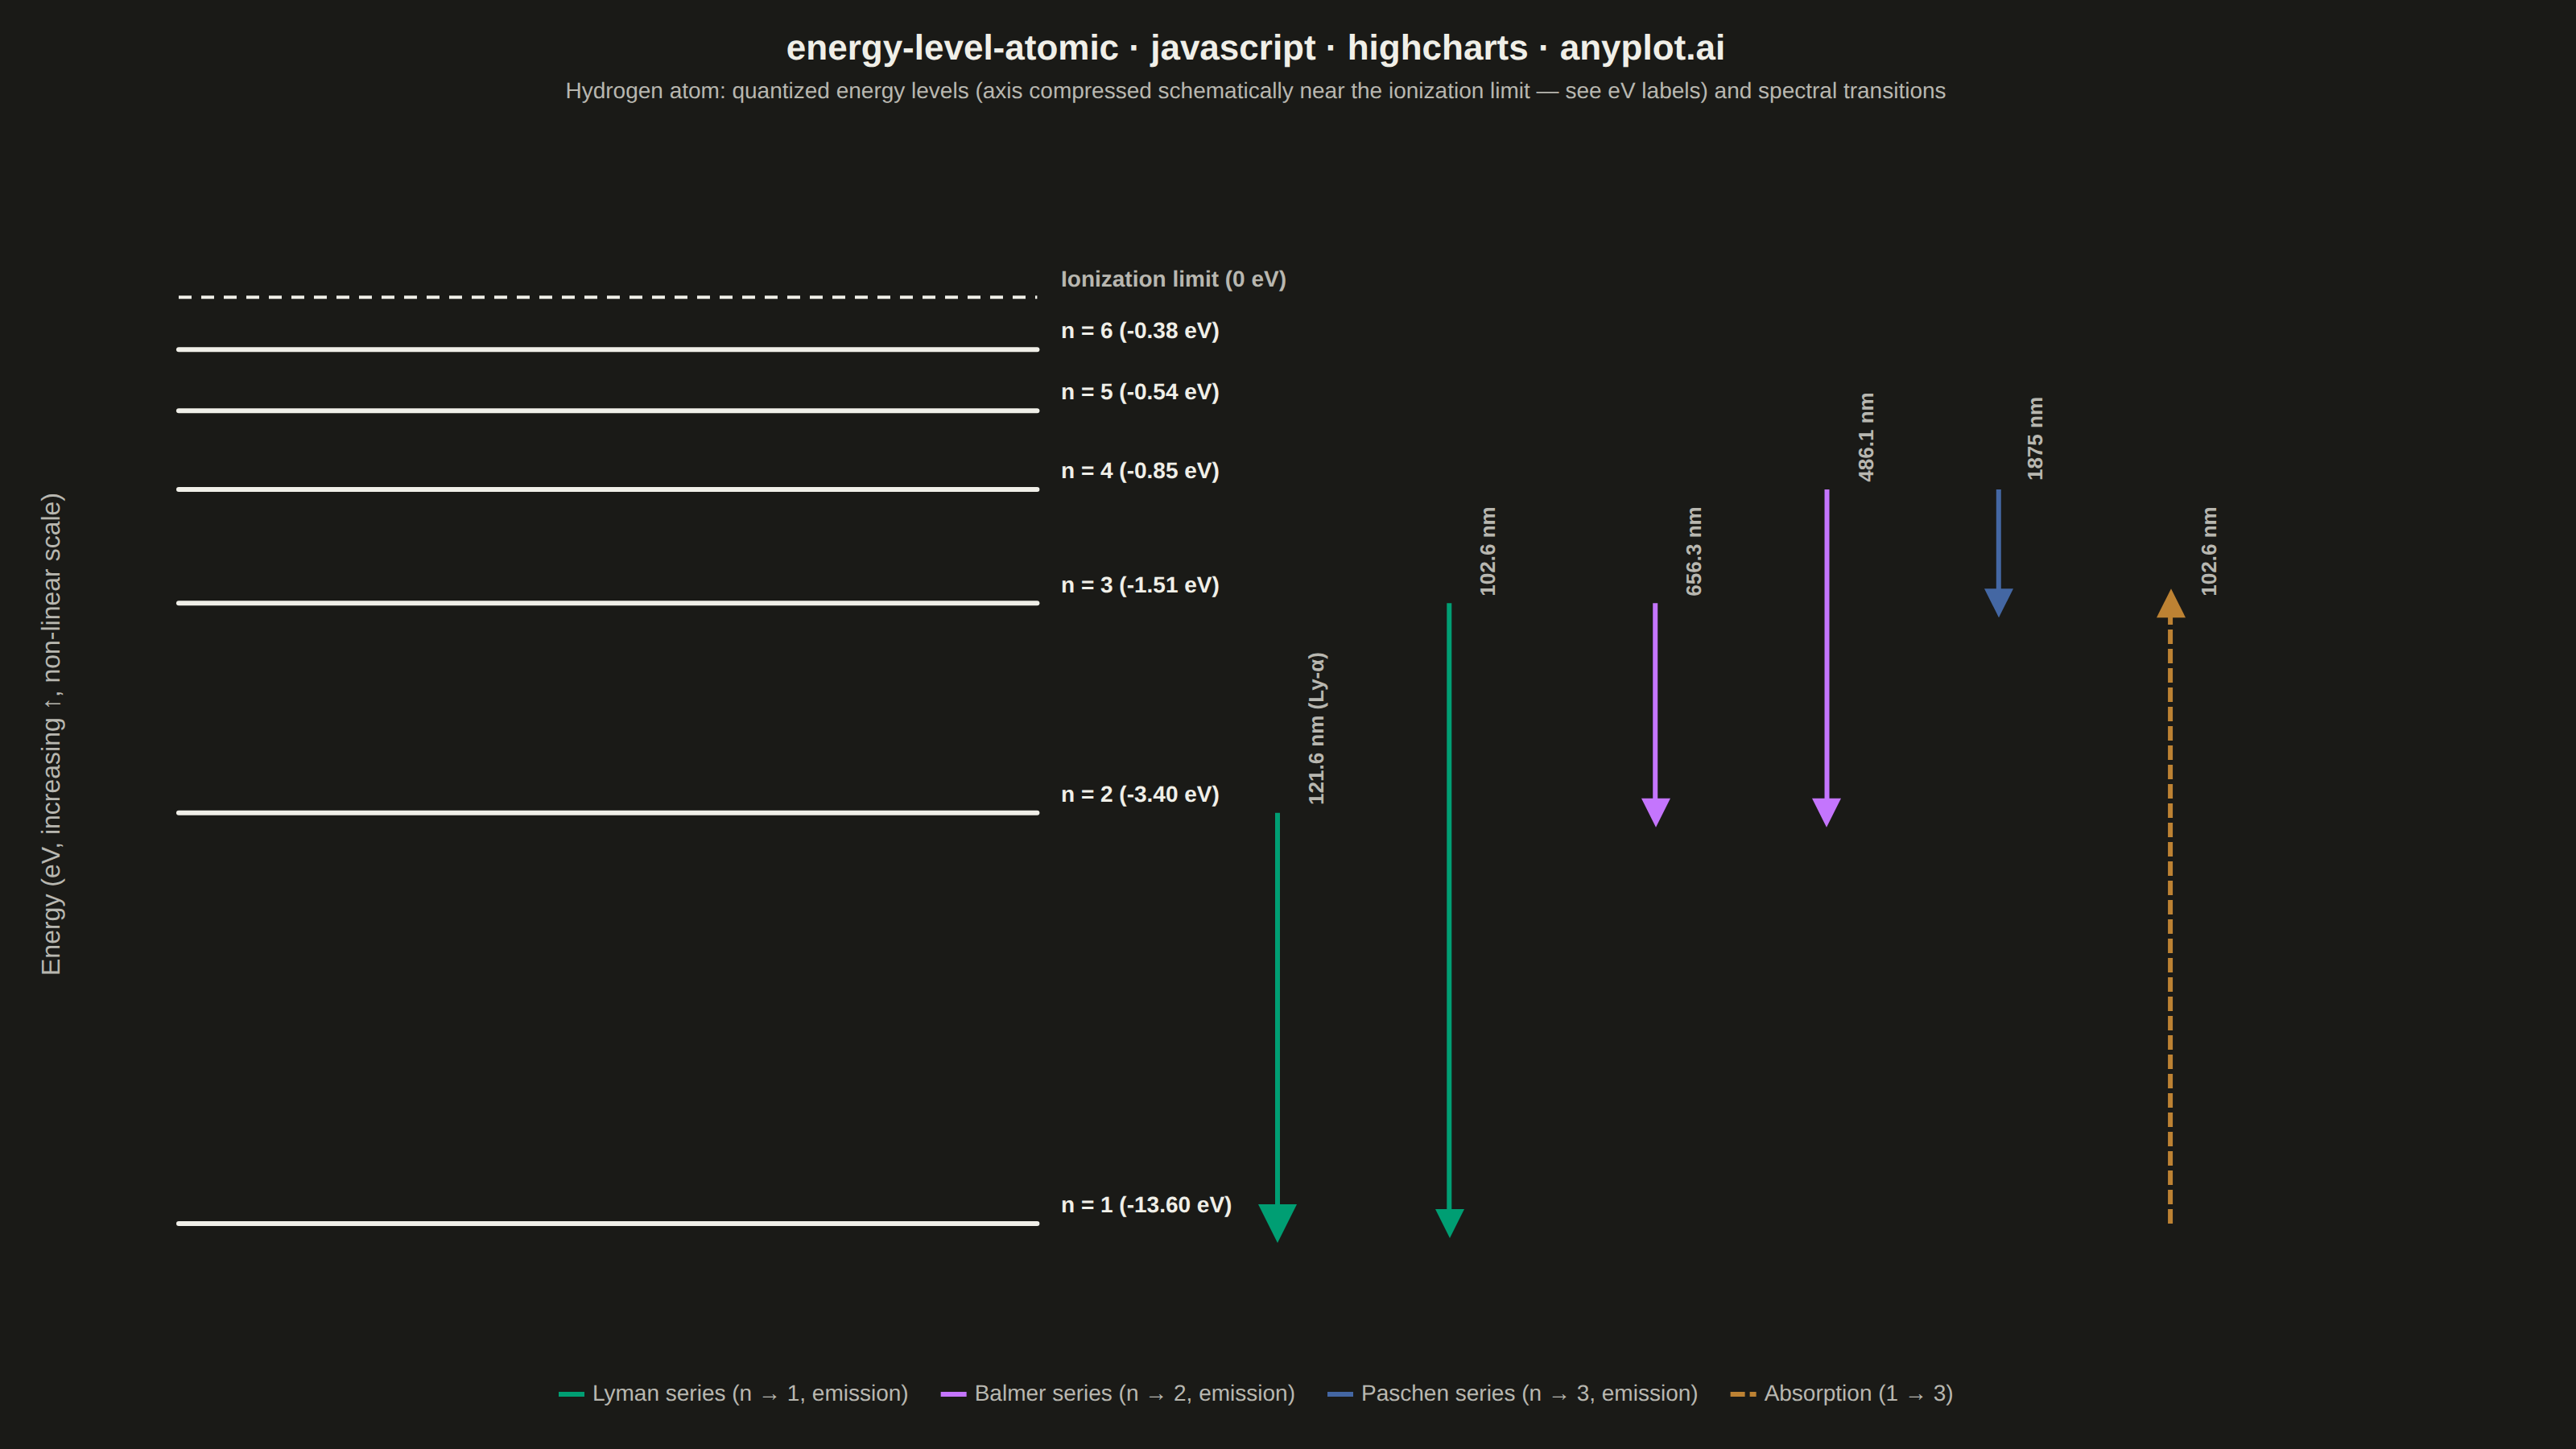
The same plot in 14 other libraries — JavaScript: Chart.js, D3.js, Apache ECharts, MUI X Charts; Python: Altair, Bokeh, lets-plot, Matplotlib, Plotly, plotnine, Pygal, Seaborn; R: ggplot2; Julia: Makie.jl. Compare all 15 side by side: Atomic Energy Level Diagram in Python, R, Julia and JavaScript.
An energy level diagram displays quantized energy states as horizontal lines positioned at their respective energy values, with vertical arrows representing transitions between levels. This visualization reveals the discrete nature of atomic and molecular energy structures, making it essential for understanding spectral series, electron configurations, and quantum state transitions. It provides an intuitive way to connect abstract quantum numbers to observable spectral phenomena.
// anyplot.ai
// energy-level-atomic: Atomic Energy Level Diagram
// Library: highcharts 12.6.0 | JavaScript 22.23.2
// Quality: 89/100 | Updated: 2026-08-25

const t = window.ANYPLOT_TOKENS;

// --- Data: hydrogen atom energy levels (E_n = -13.6 / n^2 eV) ---------------
// `energy` is the real physical value (shown in labels); `yPos` is a
// schematic plotting position — levels above n=3 sit within ~1 eV of each
// other and would collide on a literal linear axis, so yPos compresses the
// lower levels and keeps generous, legible spacing near the ionization limit
// while preserving the true ordering and the visual sense of convergence.
// n=1 is pulled up from its literal -13.6 to -10.6 to shrink the otherwise
// empty gap below n=2 while it still reads as clearly the most-isolated level.
const LEVEL_X0 = 0.6;
const LEVEL_X1 = 5.6;

const levels = [
  { n: 1, energy: -13.6, yPos: -10.6 },
  { n: 2, energy: -3.4, yPos: -5.9 },
  { n: 3, energy: -1.51, yPos: -3.5 },
  { n: 4, energy: -0.85, yPos: -2.2 },
  { n: 5, energy: -0.54, yPos: -1.3 },
  { n: 6, energy: -0.38, yPos: -0.6 },
];

// --- Data: spectral transitions, grouped into series (emission/absorption) -
// Each transition is drawn as a short vertical segment at its own x column;
// the marker on the target point renders as the arrowhead.
const transitionFamilies = [
  {
    name: "Lyman series (n → 1, emission)",
    color: t.palette[0],
    dashStyle: "Solid",
    transitions: [
      { x: 7.0, fromN: 2, toN: 1, label: "121.6 nm", highlight: true },
      { x: 8.0, fromN: 3, toN: 1, label: "102.6 nm" },
    ],
  },
  {
    name: "Balmer series (n → 2, emission)",
    color: t.palette[1],
    dashStyle: "Solid",
    transitions: [
      { x: 9.2, fromN: 3, toN: 2, label: "656.3 nm" },
      { x: 10.2, fromN: 4, toN: 2, label: "486.1 nm" },
    ],
  },
  {
    name: "Paschen series (n → 3, emission)",
    color: t.palette[2],
    dashStyle: "Solid",
    transitions: [{ x: 11.2, fromN: 4, toN: 3, label: "1875 nm" }],
  },
  {
    name: "Absorption (1 → 3)",
    color: t.palette[3],
    dashStyle: "ShortDash",
    transitions: [{ x: 12.2, fromN: 1, toN: 3, label: "102.6 nm" }],
  },
];

const yPosOf = (n) => levels.find((lvl) => lvl.n === n).yPos;

// Build one line series per family: real point pairs separated by a null
// point so unrelated transitions in the same family don't get connected.
const transitionSeries = transitionFamilies.map((family) => {
  const data = [];
  family.transitions.forEach((tr, i) => {
    const yFrom = yPosOf(tr.fromN);
    const yTo = yPosOf(tr.toN);
    const emission = yTo < yFrom;
    const topY = Math.max(yFrom, yTo);
    const label = tr.highlight ? `<b>${tr.label} (Ly-α)</b>` : tr.label;
    data.push(
      {
        x: tr.x,
        y: yFrom,
        marker: { enabled: false },
        dataLabels: {
          enabled: yFrom === topY,
          custom: { label },
        },
      },
      {
        x: tr.x,
        y: yTo,
        marker: {
          enabled: true,
          symbol: emission ? "triangle-down" : "triangle",
          radius: tr.highlight ? 12 : 9,
          fillColor: family.color,
          lineWidth: 0,
        },
        dataLabels: {
          enabled: yTo === topY,
          custom: { label },
        },
      }
    );
    if (i < family.transitions.length - 1) {
      data.push({ x: tr.x, y: null });
    }
  });
  return {
    type: "line",
    name: family.name,
    color: family.color,
    dashStyle: family.dashStyle,
    lineWidth: 3,
    showInLegend: true,
    marker: { enabled: false },
    dataLabels: {
      formatter: function () {
        return this.point.options.dataLabels &&
          this.point.options.dataLabels.custom
          ? this.point.options.dataLabels.custom.label
          : "";
      },
      rotation: -90,
      align: "left",
      x: 10,
      y: 0,
      style: { color: t.inkSoft, fontSize: "13px", textOutline: "none" },
    },
    data,
  };
});

// Level lines: structural reference elements, not categorical data — drawn
// in the neutral/ink tone so they read as part of the chart's chrome.
const levelSeries = levels.map((lvl) => ({
  type: "line",
  name: `n = ${lvl.n}`,
  color: t.ink,
  lineWidth: 3,
  showInLegend: false,
  enableMouseTracking: false,
  marker: { enabled: false },
  data: [
    { x: LEVEL_X0, y: lvl.yPos },
    {
      x: LEVEL_X1,
      y: lvl.yPos,
      dataLabels: {
        enabled: true,
        format: `n = ${lvl.n}  (${lvl.energy.toFixed(2)} eV)`,
        align: "left",
        x: 10,
        style: { color: t.ink, fontSize: "14px", textOutline: "none" },
      },
    },
  ],
}));

const ionizationSeries = {
  type: "line",
  name: "Ionization limit",
  color: t.ink,
  dashStyle: "Dash",
  lineWidth: 2,
  showInLegend: false,
  enableMouseTracking: false,
  marker: { enabled: false },
  data: [
    { x: LEVEL_X0, y: 0 },
    {
      x: LEVEL_X1,
      y: 0,
      dataLabels: {
        enabled: true,
        format: "Ionization limit (0 eV)",
        align: "left",
        x: 10,
        style: { color: t.inkSoft, fontSize: "14px", textOutline: "none" },
      },
    },
  ],
};

// --- Chart -------------------------------------------------------------
Highcharts.chart("container", {
  chart: {
    type: "line",
    backgroundColor: "transparent",
    animation: false,
    style: { fontFamily: "inherit" },
    spacing: [20, 60, 20, 20],
  },
  credits: { enabled: false },
  colors: t.palette,
  title: {
    text: "energy-level-atomic · javascript · highcharts · anyplot.ai",
    style: { color: t.ink, fontSize: "22px", fontWeight: "600" },
  },
  subtitle: {
    text: "Hydrogen atom: quantized energy levels (axis compressed schematically near the ionization limit — see eV labels) and spectral transitions",
    style: { color: t.inkSoft, fontSize: "14px" },
  },
  xAxis: {
    min: 0,
    max: 14,
    lineWidth: 0,
    tickLength: 0,
    gridLineWidth: 0,
    labels: { enabled: false },
    title: { text: null },
  },
  yAxis: {
    min: -11.6,
    max: 1.3,
    lineColor: t.inkSoft,
    tickColor: t.inkSoft,
    gridLineWidth: 0,
    title: {
      text: "Energy (eV, increasing ↑, non-linear scale)",
      style: { color: t.inkSoft, fontSize: "16px" },
    },
    labels: { enabled: false },
  },
  legend: {
    enabled: true,
    itemStyle: { color: t.inkSoft, fontSize: "14px" },
    itemHoverStyle: { color: t.ink },
  },
  tooltip: { enabled: false },
  plotOptions: {
    series: { animation: false, states: { hover: { enabled: false } } },
  },
  series: [...levelSeries, ionizationSeries, ...transitionSeries],
});
Runnable source as JSON, for any HTTP client: https://api.anyplot.ai/specs/energy-level-atomic/highcharts/code. Any spec id and library id listed in llms-full.txt fit the same URL shape; every URL below is complete and callable.
{
  "spec_id": "energy-level-atomic",
  "language": "javascript",
  "library": "highcharts",
  "page": "https://anyplot.ai/energy-level-atomic/javascript/highcharts",
  "hub": "https://anyplot.ai/energy-level-atomic",
  "code_json": "https://api.anyplot.ai/specs/energy-level-atomic/highcharts/code",
  "spec_json": "https://api.anyplot.ai/specs/energy-level-atomic",
  "render_light_png": "https://storage.googleapis.com/anyplot-images/plots/energy-level-atomic/javascript/highcharts/plot-light.png",
  "render_dark_png": "https://storage.googleapis.com/anyplot-images/plots/energy-level-atomic/javascript/highcharts/plot-dark.png",
  "interactive_light_html": "https://storage.googleapis.com/anyplot-images/plots/energy-level-atomic/javascript/highcharts/plot-light.html",
  "interactive_dark_html": "https://storage.googleapis.com/anyplot-images/plots/energy-level-atomic/javascript/highcharts/plot-dark.html",
  "quality_score": 89.0,
  "license": "MIT",
  "guide": "https://anyplot.ai/llms.txt"
}
Part of Atomic Energy Level Diagram on anyplot.ai.