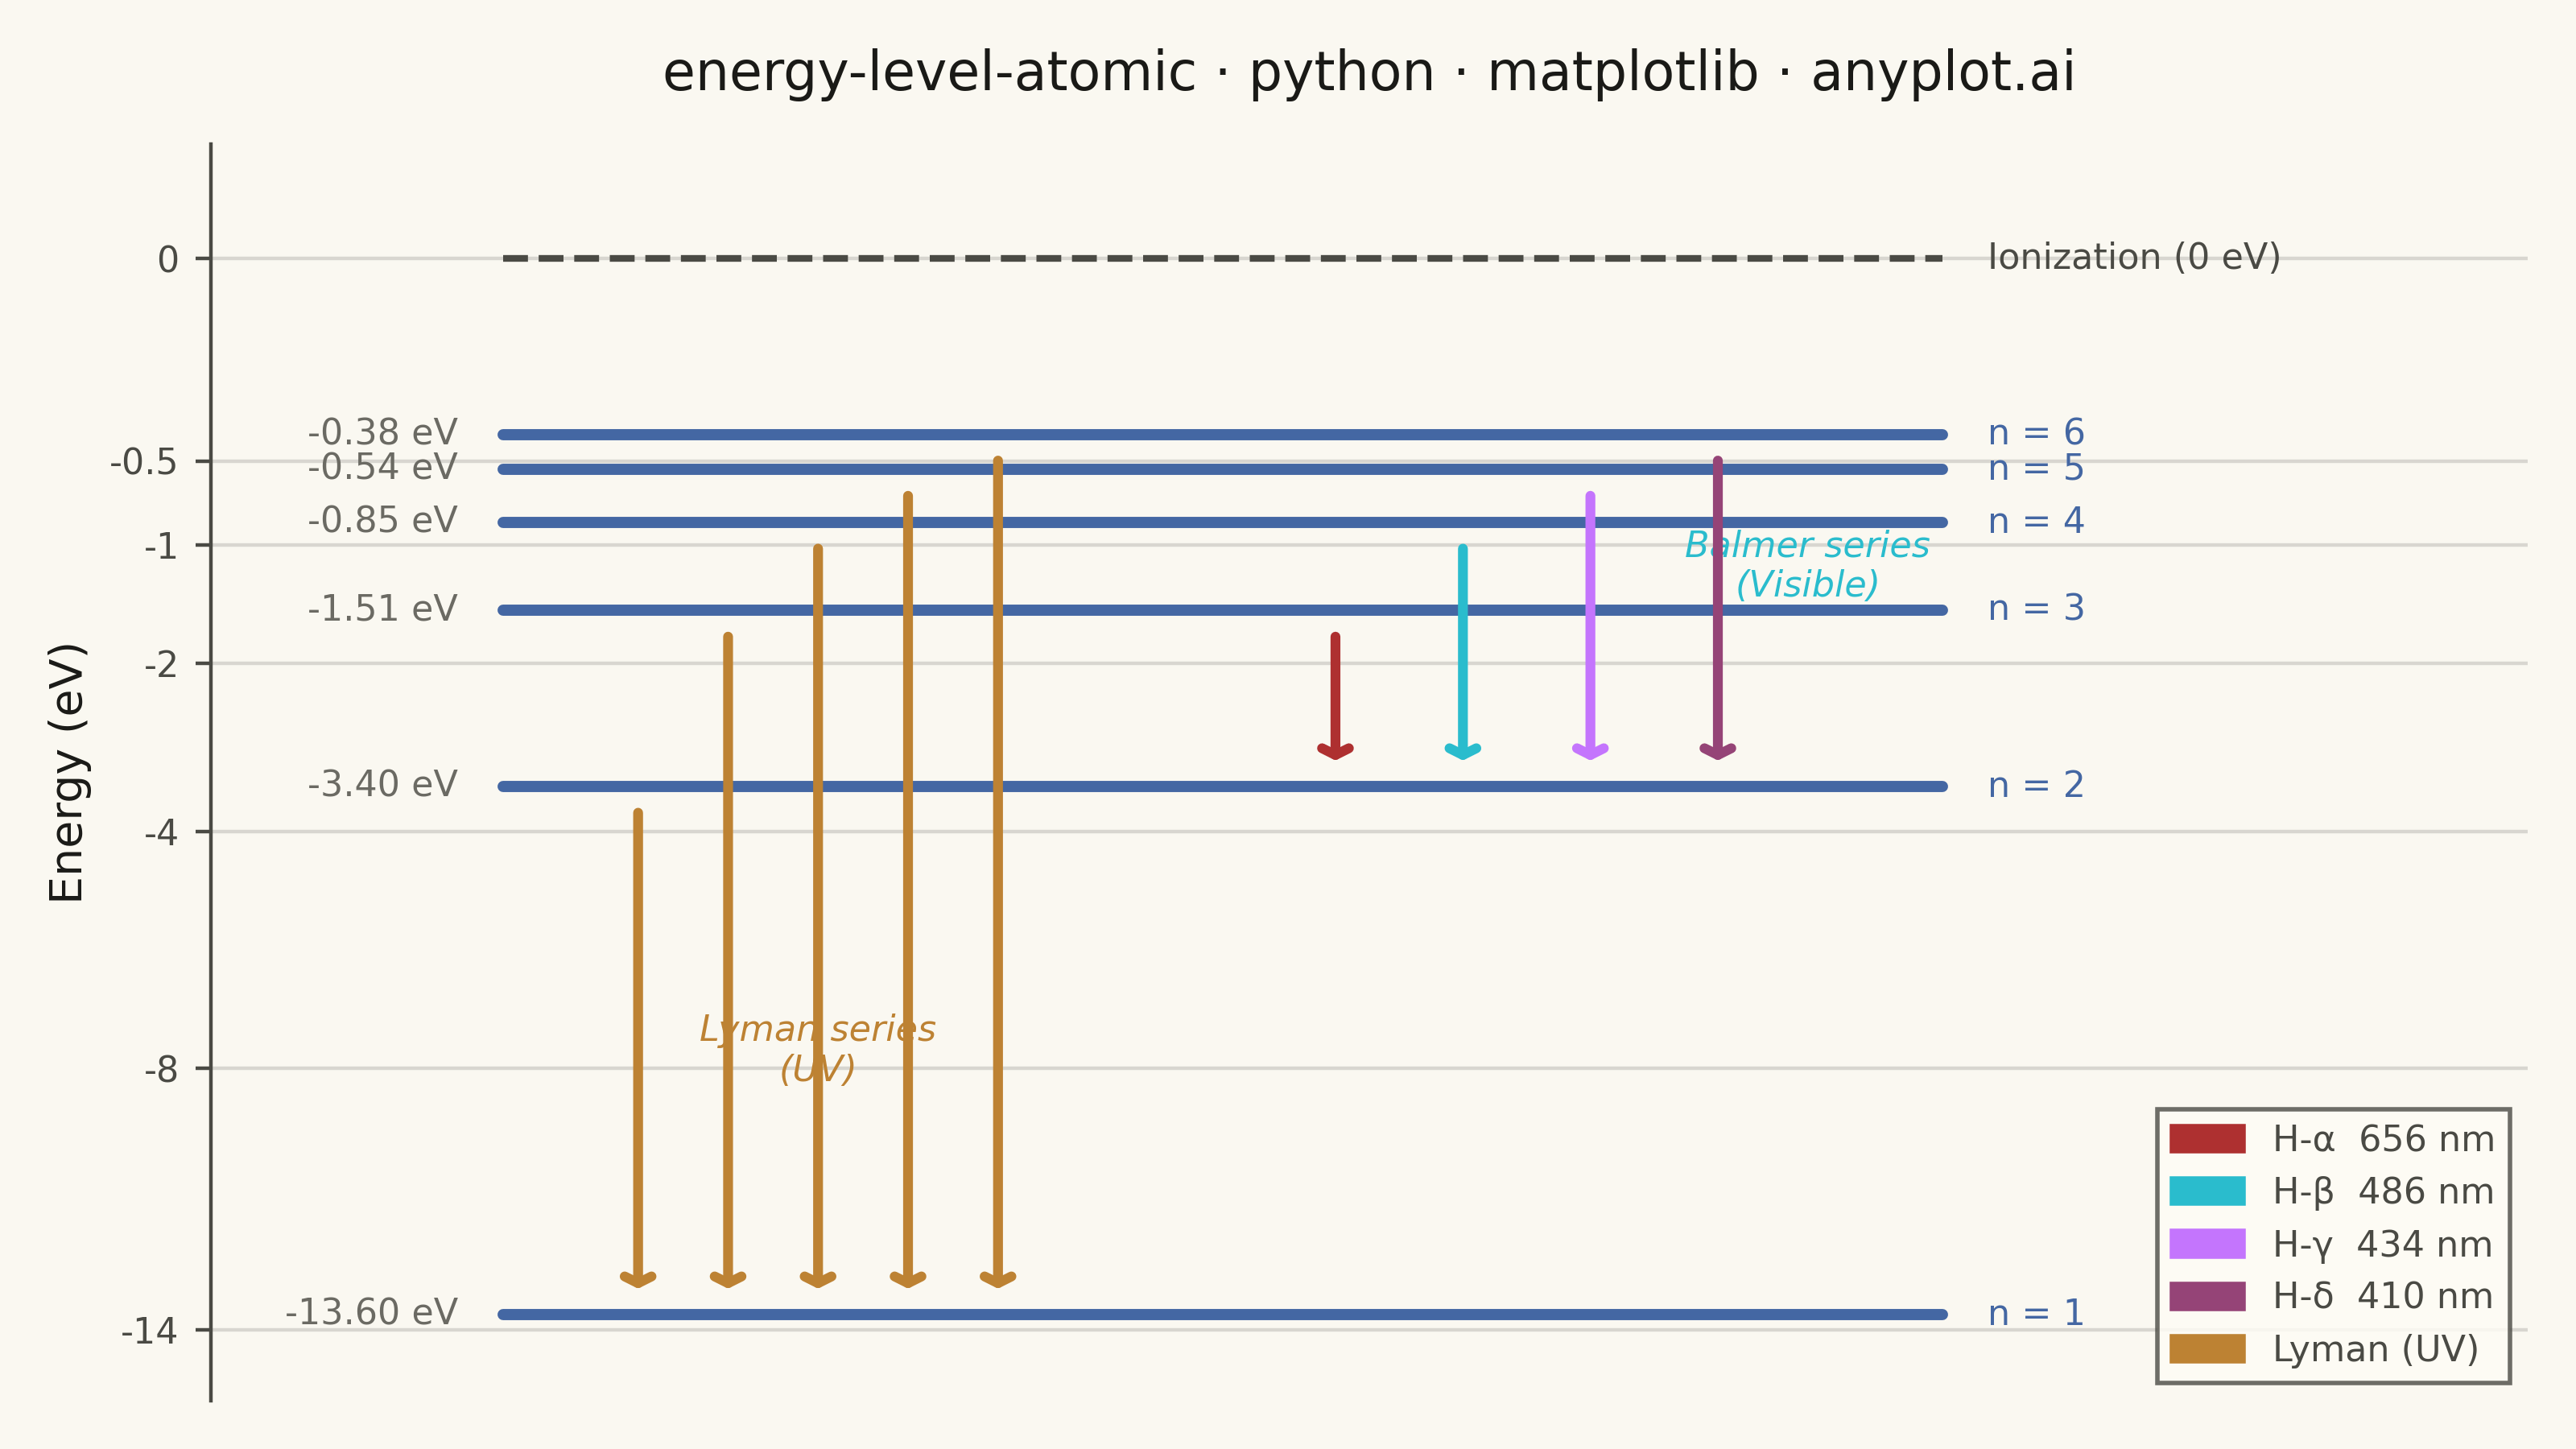
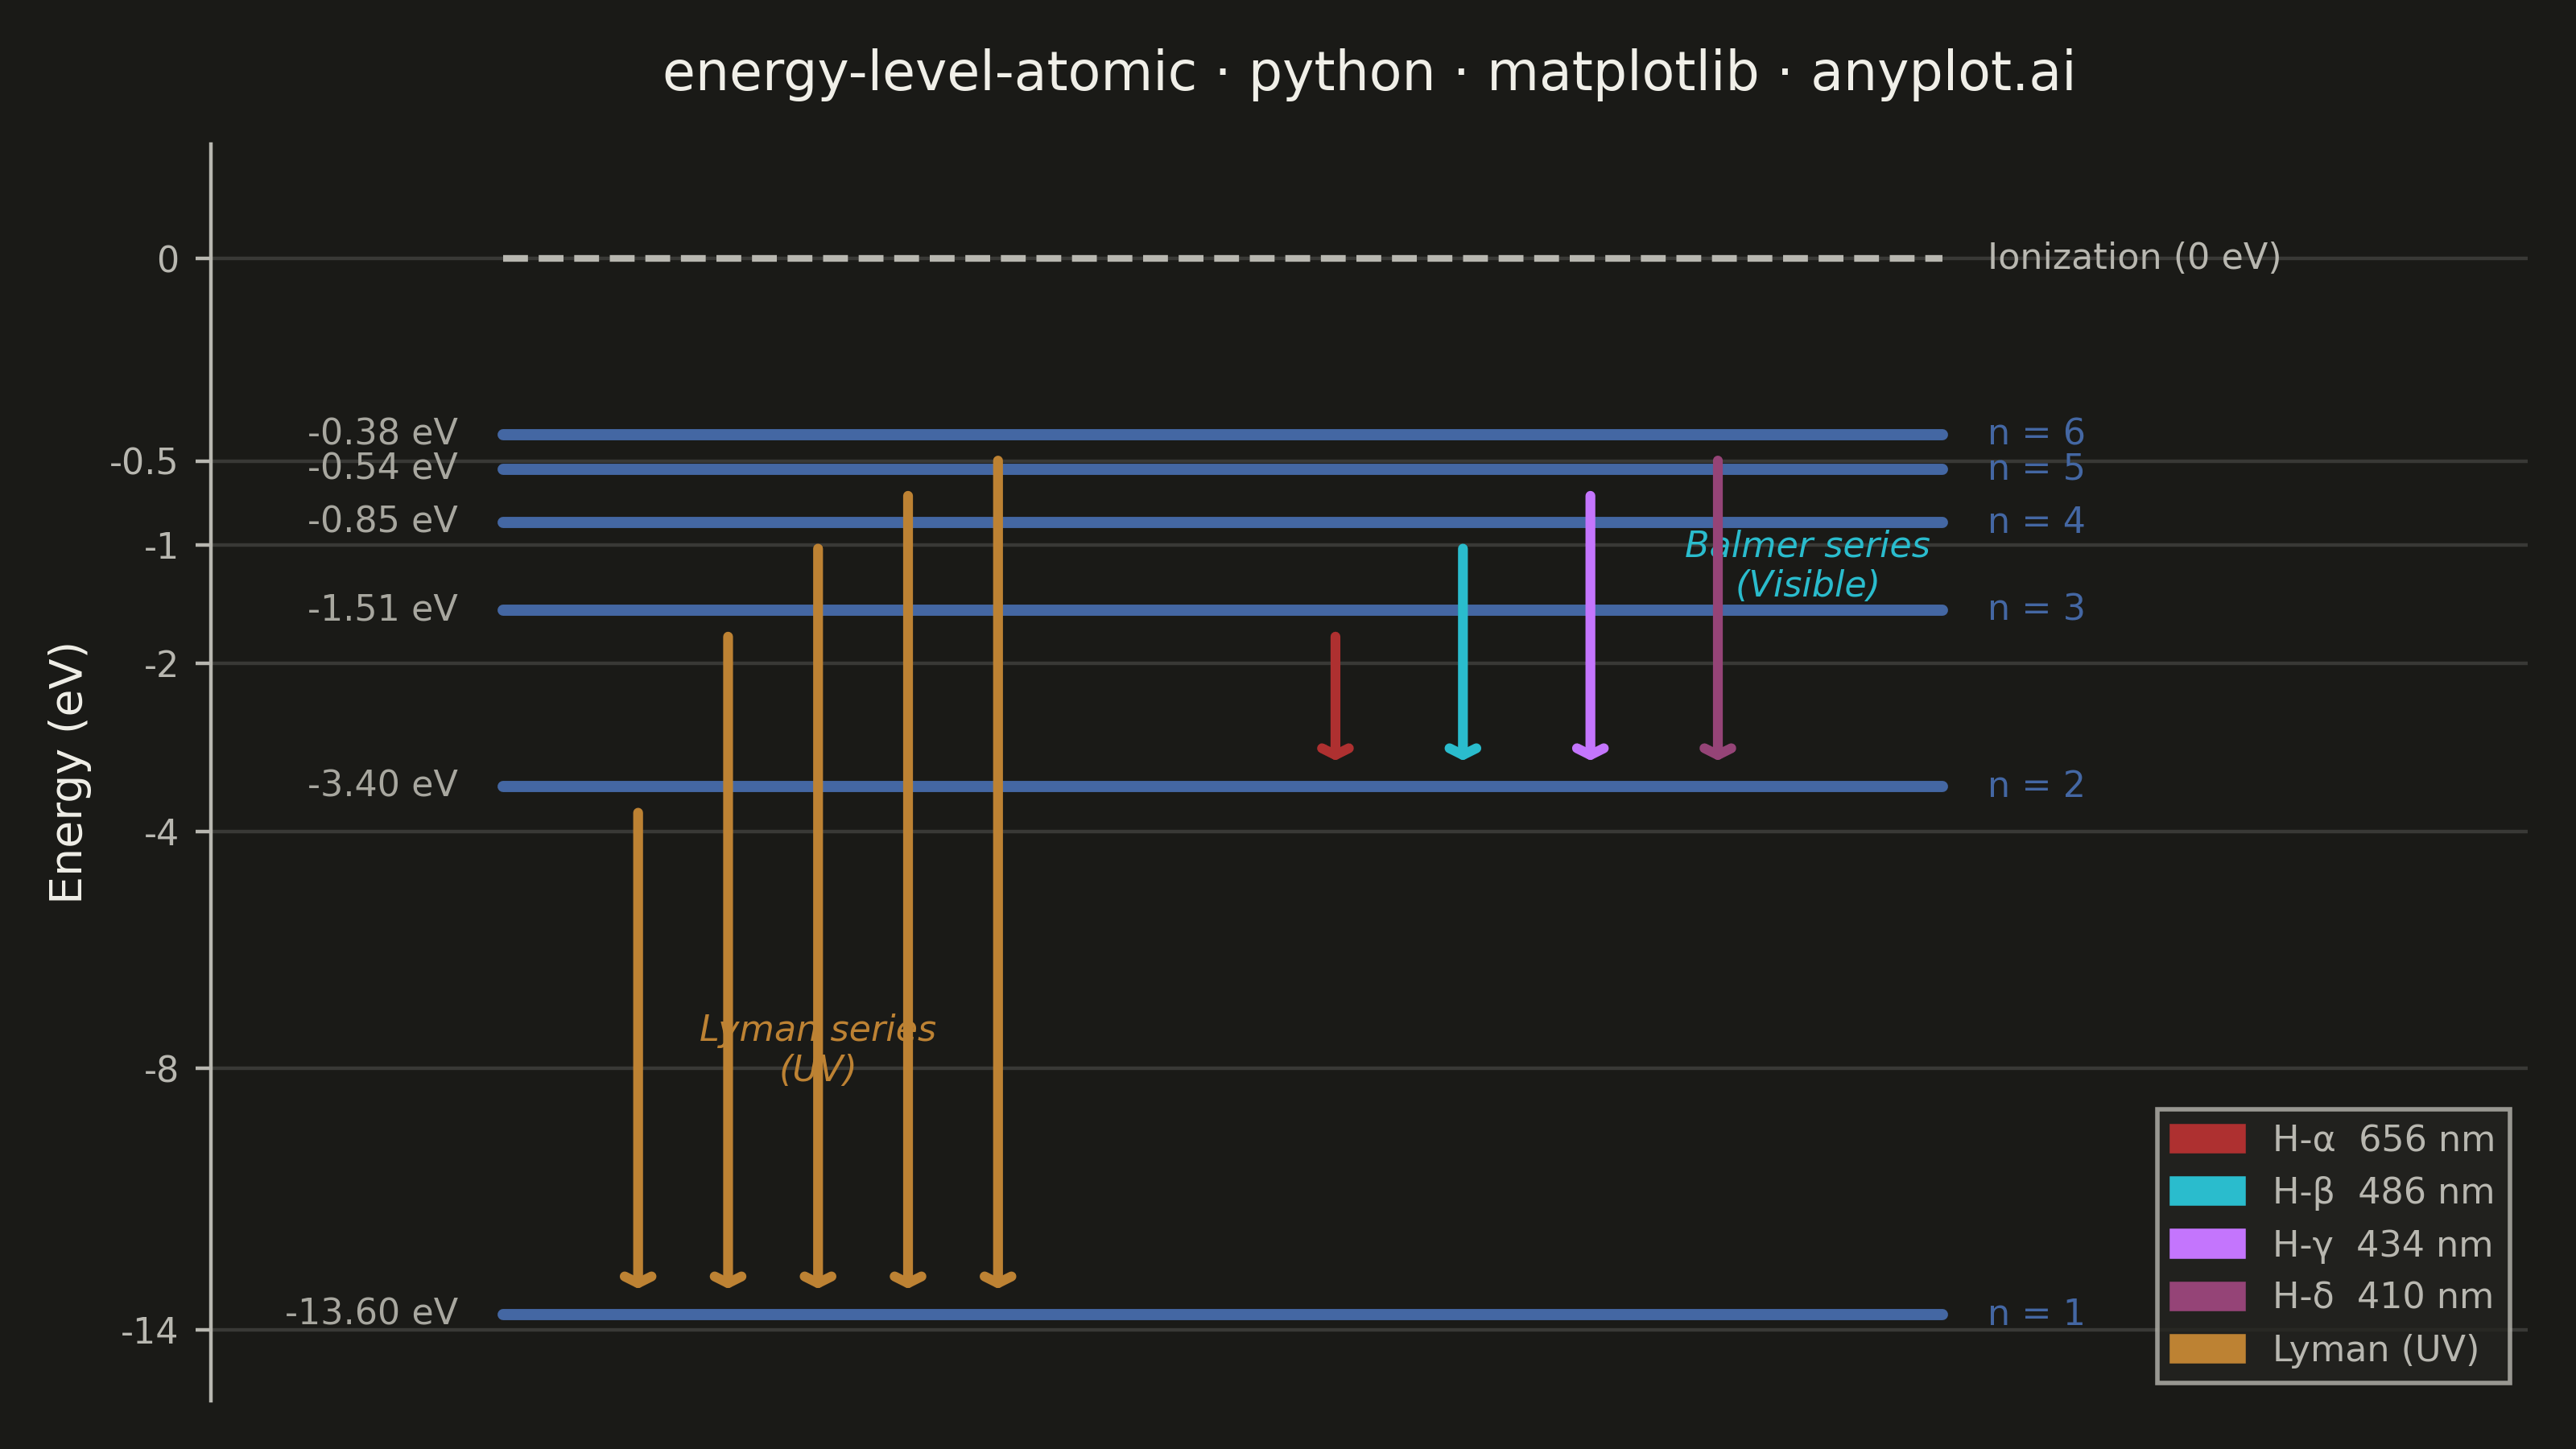
An energy level diagram displays quantized energy states as horizontal lines positioned at their respective energy values, with vertical arrows representing transitions between levels. This visualization reveals the discrete nature of atomic and molecular energy structures, making it essential for understanding spectral series, electron configurations, and quantum state transitions. It provides an intuitive way to connect abstract quantum numbers to observable spectral phenomena.
""" anyplot.ai
energy-level-atomic: Atomic Energy Level Diagram
Library: matplotlib 3.10.9 | Python 3.13.13
Quality: 85/100 | Updated: 2026-05-30
"""

import os

import matplotlib.patches as mpatches
import matplotlib.pyplot as plt
import numpy as np


# Theme tokens
THEME = os.getenv("ANYPLOT_THEME", "light")
PAGE_BG = "#FAF8F1" if THEME == "light" else "#1A1A17"
ELEVATED_BG = "#FFFDF6" if THEME == "light" else "#242420"
INK = "#1A1A17" if THEME == "light" else "#F0EFE8"
INK_SOFT = "#4A4A44" if THEME == "light" else "#B8B7B0"
INK_MUTED = "#6B6A63" if THEME == "light" else "#A8A79F"

# Imprint palette — energy level lines use Imprint blue; transitions use spectral-matched Imprint hues
LEVEL_COLOR = "#4467A3"  # Imprint blue
LYMAN_COLOR = "#BD8233"  # Imprint ochre — warm, evokes UV glow

# Data — Hydrogen atom energy levels: E_n = -13.6 / n^2 (eV)
n_values = np.arange(1, 7)
energies = -13.6 / n_values**2

# Sqrt-compressed display positions: y = -sqrt(|E|)
# Preserves ordering (n=1 at bottom, ionization at top) while spreading upper levels
y_pos = -np.sqrt(np.abs(energies))
ion_y = 0.0  # ionization at E=0 → y=0

# Balmer series transitions with Imprint-matched spectral colors
# Weakness fix: replaced similar blue-violet/purple pair with more distinct lavender/rose pair
balmer_data = [
    (3, 2, "#AE3030"),  # H-alpha  656 nm (red → Imprint matte red)
    (4, 2, "#2ABCCD"),  # H-beta   486 nm (cyan → Imprint cyan)
    (5, 2, "#C475FD"),  # H-gamma  434 nm (violet → Imprint lavender)
    (6, 2, "#954477"),  # H-delta  410 nm (deep violet → Imprint rose)
]

# Lyman series transitions (UV, uniform warm color)
lyman_data = [(2, 1), (3, 1), (4, 1), (5, 1), (6, 1)]

# Lookup: quantum number → compressed y position
y_of = {n: -np.sqrt(13.6 / n**2) for n in range(1, 7)}

# Plot
fig, ax = plt.subplots(figsize=(8, 4.5), dpi=400, facecolor=PAGE_BG)
ax.set_facecolor(PAGE_BG)

left = 0.18
right = 0.82
gap = 0.06  # arrow gap from level lines

# Energy level lines
for n, energy, y in zip(n_values, energies, y_pos, strict=True):
    lw = 3.5 if n == 1 else 2.5  # bolder ground state anchors the diagram
    ax.plot([left, right], [y, y], color=LEVEL_COLOR, linewidth=lw, solid_capstyle="round", zorder=3)
    ax.text(right + 0.02, y, f"n = {n}", fontsize=8, va="center", ha="left", color=LEVEL_COLOR, fontweight="medium")
    # Upper levels crowd together: smaller font + stagger n=5 left for visual separation
    label_fs = 7 if n >= 4 else 8
    label_x = (left - 0.05) if n == 5 else (left - 0.02)
    ax.text(label_x, y, f"{energy:.2f} eV", fontsize=label_fs, va="center", ha="right", color=INK_MUTED)

# Ionization limit (dashed, theme-adaptive)
ax.plot([left, right], [ion_y, ion_y], color=INK_SOFT, linewidth=1.5, linestyle="--", zorder=2)
ax.text(right + 0.02, ion_y, "Ionization (0 eV)", fontsize=8, va="center", ha="left", color=INK_SOFT)

# Lyman series arrows (left side)
lyman_x = np.linspace(0.24, 0.40, len(lyman_data))
for (upper, lower), xp in zip(lyman_data, lyman_x, strict=True):
    ax.annotate(
        "",
        xy=(xp, y_of[lower] + gap),
        xytext=(xp, y_of[upper] - gap),
        arrowprops={"arrowstyle": "->,head_width=0.3,head_length=0.15", "color": LYMAN_COLOR, "lw": 2.2},
        zorder=4,
    )

# Balmer series arrows (right side, colored by wavelength)
balmer_x = np.linspace(0.55, 0.72, len(balmer_data))
for (upper, lower, color), xp in zip(balmer_data, balmer_x, strict=True):
    ax.annotate(
        "",
        xy=(xp, y_of[lower] + gap),
        xytext=(xp, y_of[upper] - gap),
        arrowprops={"arrowstyle": "->,head_width=0.3,head_length=0.15", "color": color, "lw": 2.2},
        zorder=4,
    )

# Series group labels
ax.text(
    0.32,
    (y_of[1] + y_of[2]) / 2,
    "Lyman series\n(UV)",
    fontsize=8,
    ha="center",
    va="center",
    color=LYMAN_COLOR,
    fontstyle="italic",
)
ax.text(
    0.77,
    (y_of[2] + y_of[3]) / 2,
    "Balmer series\n(Visible)",
    fontsize=8,
    ha="left",
    va="center",
    color="#2ABCCD",
    fontstyle="italic",
)

# Legend for Balmer transition colors + Lyman
legend_handles = [
    mpatches.Patch(color="#AE3030", label="H-α  656 nm"),
    mpatches.Patch(color="#2ABCCD", label="H-β  486 nm"),
    mpatches.Patch(color="#C475FD", label="H-γ  434 nm"),
    mpatches.Patch(color="#954477", label="H-δ  410 nm"),
    mpatches.Patch(color=LYMAN_COLOR, label="Lyman (UV)"),
]
leg = ax.legend(handles=legend_handles, fontsize=8, loc="lower right", fancybox=False)
leg.get_frame().set_facecolor(ELEVATED_BG)
leg.get_frame().set_edgecolor(INK_SOFT)
plt.setp(leg.get_texts(), color=INK_SOFT)

# Style
title = "energy-level-atomic · python · matplotlib · anyplot.ai"
title_fontsize = max(8, round(12 * 67 / len(title))) if len(title) > 67 else 12
ax.set_ylabel("Energy (eV)", fontsize=10, color=INK)
ax.set_title(title, fontsize=title_fontsize, fontweight="medium", color=INK, pad=12)
ax.set_xlim(0.05, 1.08)
ax.set_ylim(y_of[1] - 0.3, ion_y + 0.4)
ax.set_xticks([])

# Custom y-ticks: real energy values mapped onto compressed display axis
tick_energies = np.array([0, -0.5, -1, -2, -4, -8, -14])
tick_y = -np.sqrt(np.abs(tick_energies))
ax.set_yticks(tick_y)
ax.set_yticklabels([f"{e:g}" for e in tick_energies])
ax.tick_params(axis="y", labelsize=8, colors=INK_SOFT)

ax.spines["top"].set_visible(False)
ax.spines["right"].set_visible(False)
ax.spines["bottom"].set_visible(False)
ax.spines["left"].set_color(INK_SOFT)
ax.yaxis.grid(True, alpha=0.15, linewidth=0.8, color=INK)

plt.tight_layout()
plt.savefig(f"plot-{THEME}.png", dpi=400, facecolor=PAGE_BG)
Runnable source as JSON, for any HTTP client: https://api.anyplot.ai/specs/energy-level-atomic/matplotlib/code. Any spec id and library id listed in llms-full.txt fit the same URL shape; every URL below is complete and callable.
{
  "spec_id": "energy-level-atomic",
  "language": "python",
  "library": "matplotlib",
  "page": "https://anyplot.ai/energy-level-atomic/python/matplotlib",
  "hub": "https://anyplot.ai/energy-level-atomic",
  "code_json": "https://api.anyplot.ai/specs/energy-level-atomic/matplotlib/code",
  "spec_json": "https://api.anyplot.ai/specs/energy-level-atomic",
  "render_light_png": "https://storage.googleapis.com/anyplot-images/plots/energy-level-atomic/python/matplotlib/plot-light.png",
  "render_dark_png": "https://storage.googleapis.com/anyplot-images/plots/energy-level-atomic/python/matplotlib/plot-dark.png",
  "quality_score": 85.0,
  "license": "MIT",
  "guide": "https://anyplot.ai/llms.txt"
}
Part of Atomic Energy Level Diagram on anyplot.ai.