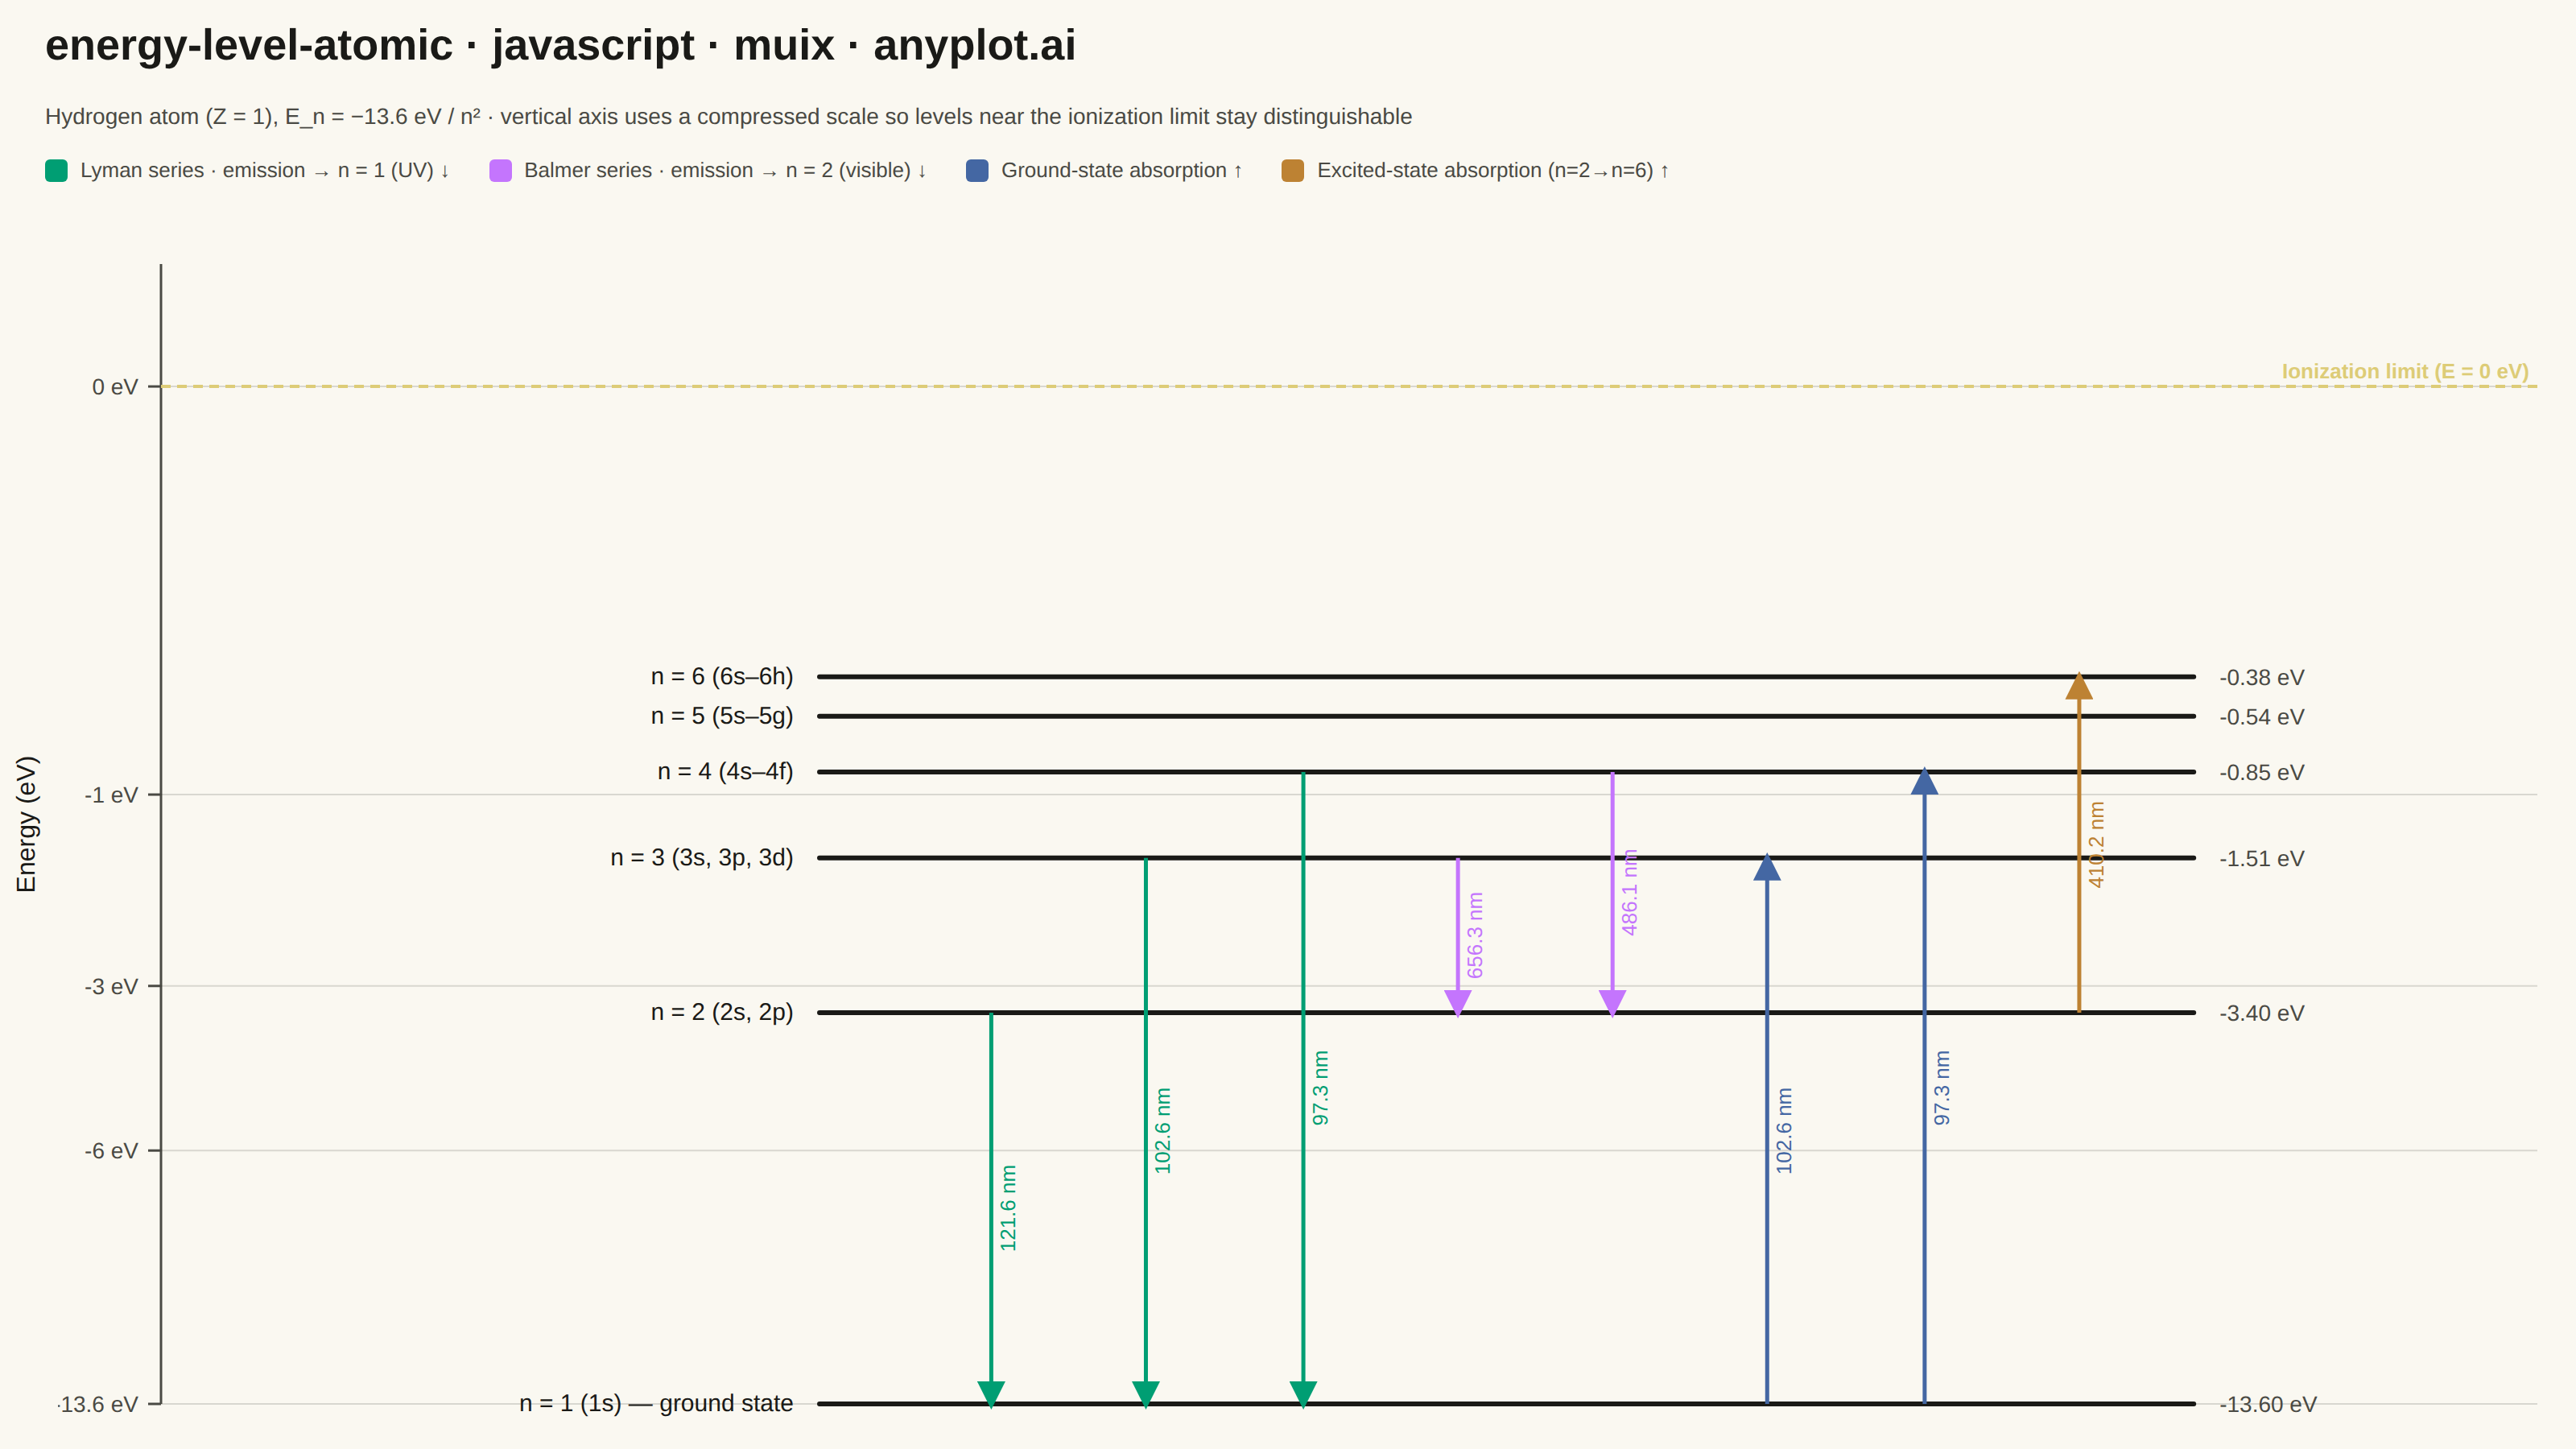
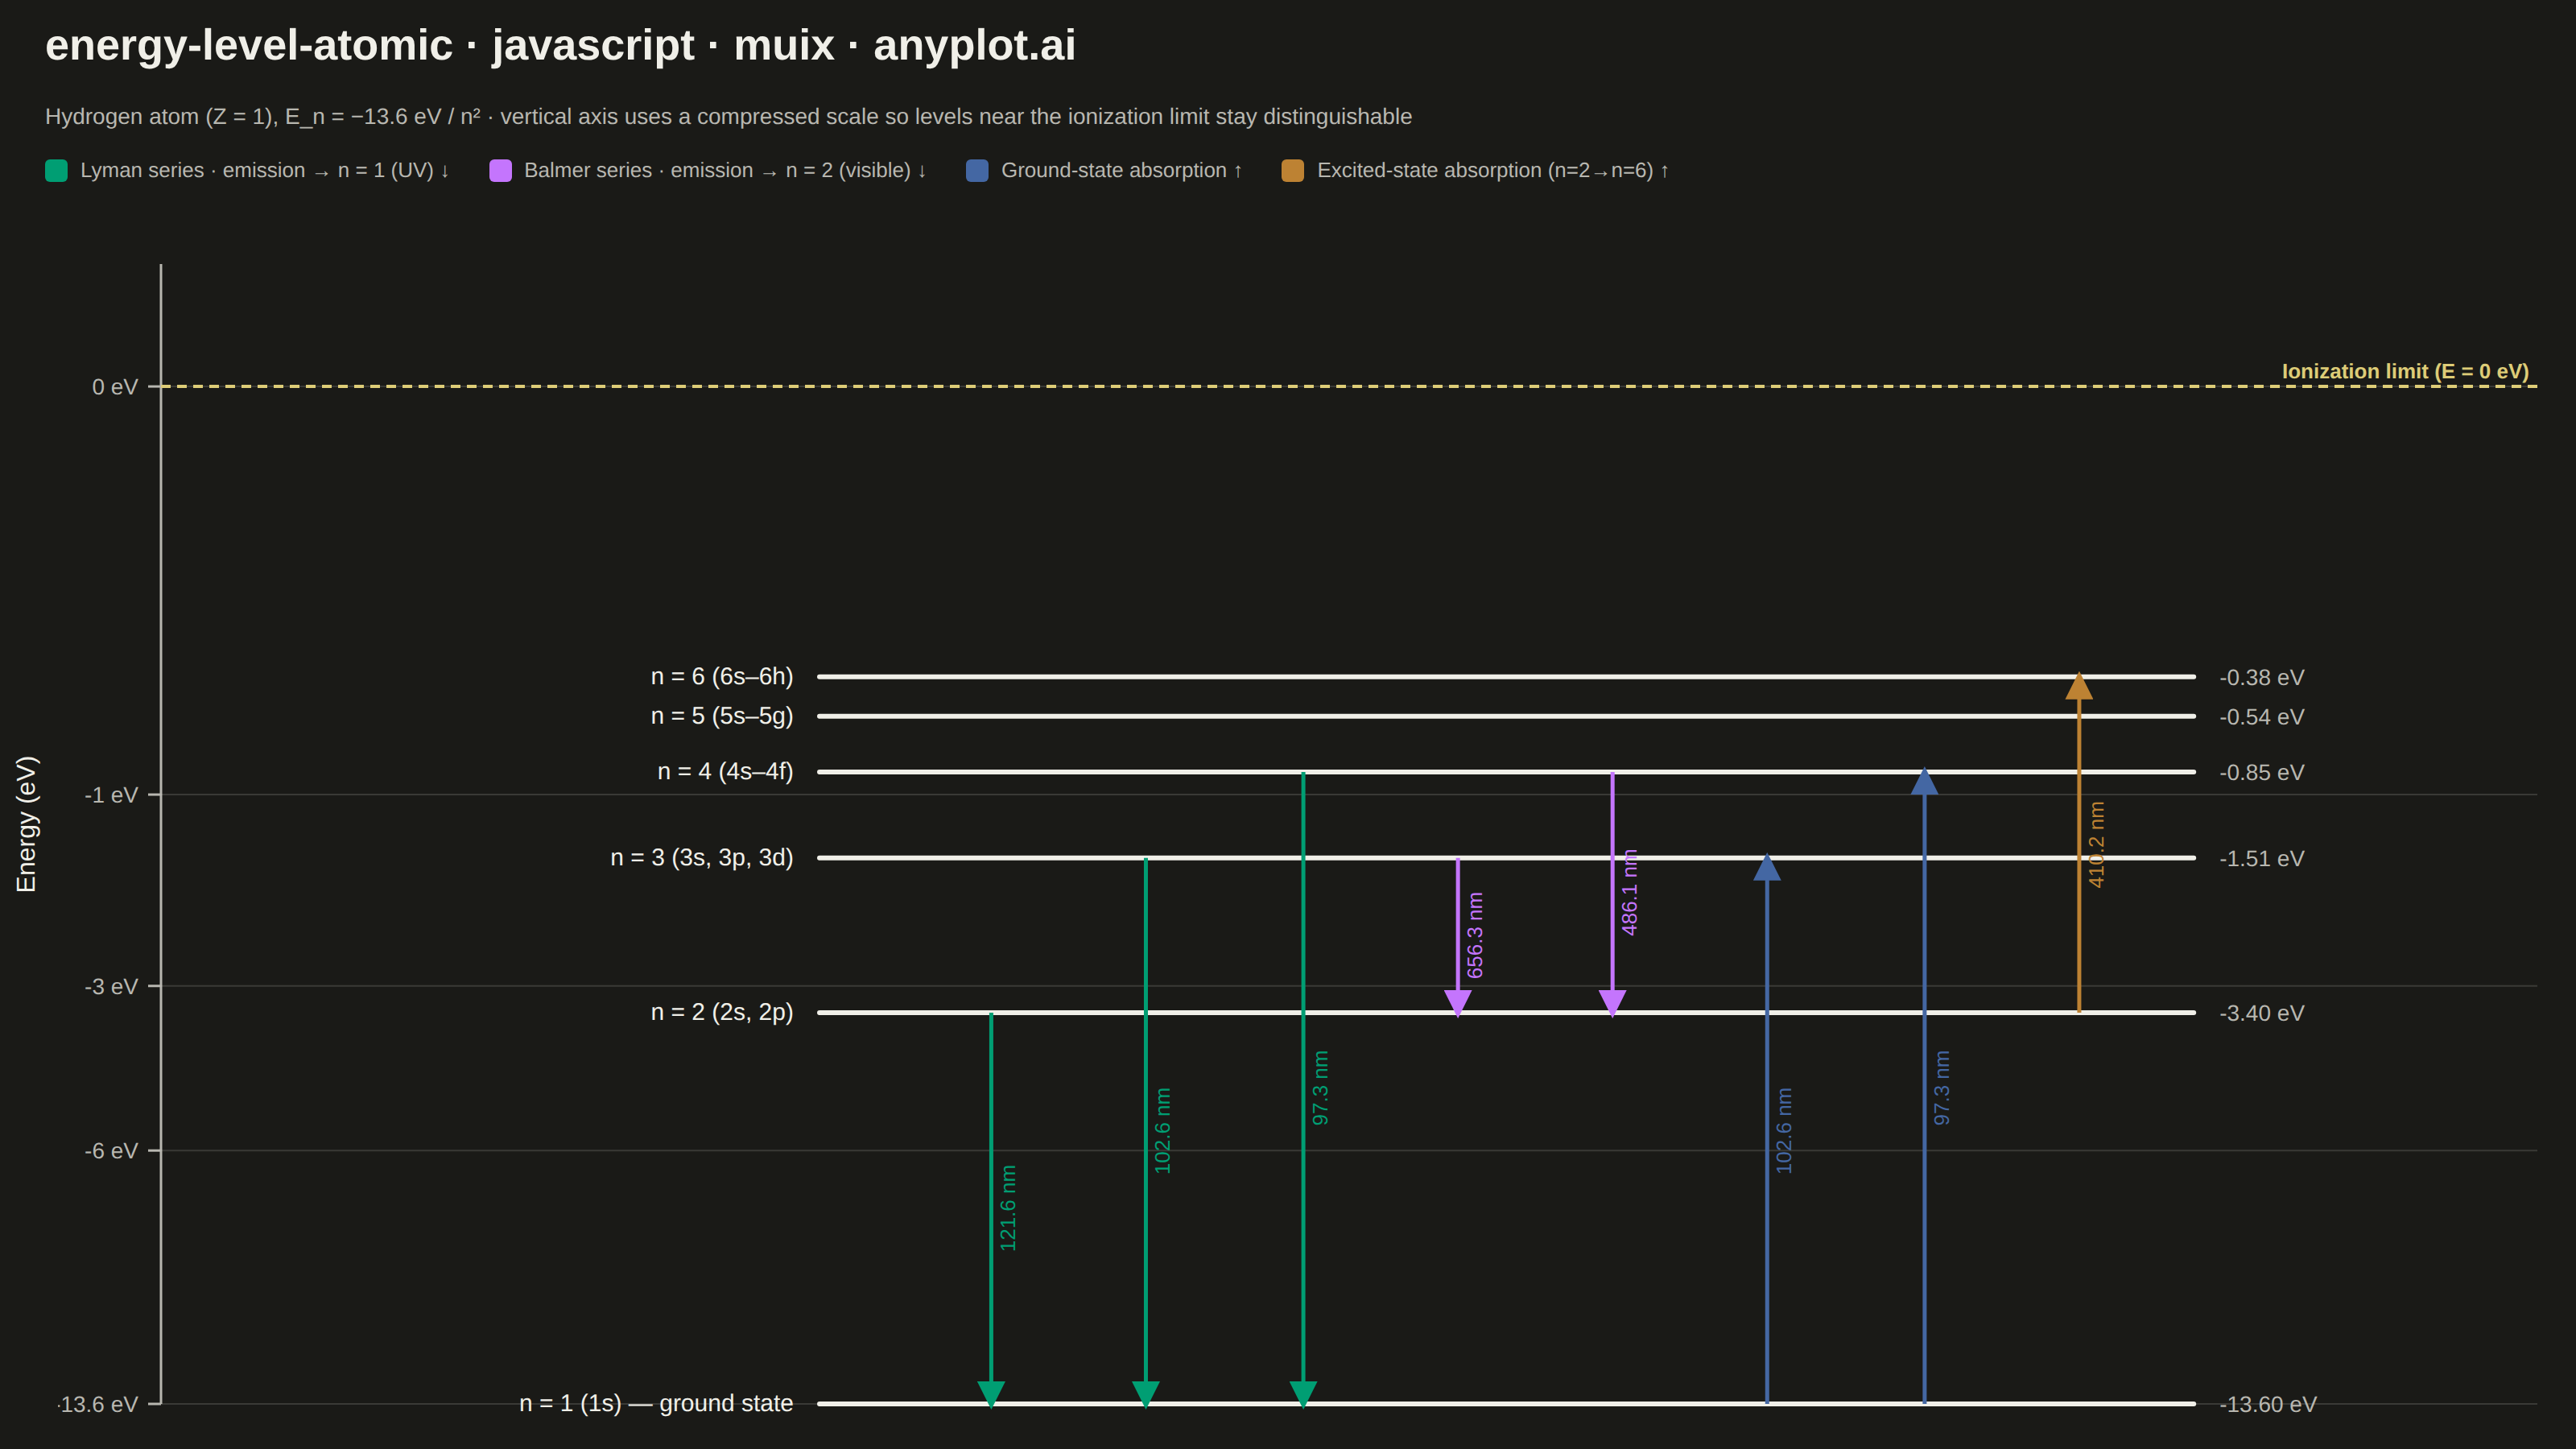
The same plot in 14 other libraries — JavaScript: Chart.js, D3.js, Apache ECharts, Highcharts; Python: Altair, Bokeh, lets-plot, Matplotlib, Plotly, plotnine, Pygal, Seaborn; R: ggplot2; Julia: Makie.jl. Compare all 15 side by side: Atomic Energy Level Diagram in Python, R, Julia and JavaScript.
An energy level diagram displays quantized energy states as horizontal lines positioned at their respective energy values, with vertical arrows representing transitions between levels. This visualization reveals the discrete nature of atomic and molecular energy structures, making it essential for understanding spectral series, electron configurations, and quantum state transitions. It provides an intuitive way to connect abstract quantum numbers to observable spectral phenomena.
// anyplot.ai
// energy-level-atomic: Atomic Energy Level Diagram
// Library: muix 7.29.1 | JavaScript 22.23.2
// Quality: 89/100 | Created: 2026-08-25
import { ChartContainer } from "@mui/x-charts/ChartContainer";
import { ChartsReferenceLine } from "@mui/x-charts/ChartsReferenceLine";
import { useXScale, useYScale, useDrawingArea } from "@mui/x-charts/hooks";
import { Box, Typography } from "@mui/material";

const t = window.ANYPLOT_TOKENS;

// --- Data (in-memory, deterministic) ----------------------------------------
// Hydrogen atom (Z = 1) bound-state energies from the Rydberg formula,
// E_n = -13.6 eV / n^2. Levels n = 1..6 span the "5-15 levels" range while
// keeping the diagram legible.
const RYDBERG_EV = 13.6;
const levels = [
  { n: 1, label: "n = 1 (1s) — ground state" },
  { n: 2, label: "n = 2 (2s, 2p)" },
  { n: 3, label: "n = 3 (3s, 3p, 3d)" },
  { n: 4, label: "n = 4 (4s–4f)" },
  { n: 5, label: "n = 5 (5s–5g)" },
  { n: 6, label: "n = 6 (6s–6h)" },
].map((level) => ({ ...level, energy: -RYDBERG_EV / (level.n * level.n) }));
const energyOf = (n) => levels.find((level) => level.n === n).energy;

const LYMAN = t.palette[0]; // brand green — always first categorical series
const BALMER = t.palette[1];
const ABSORPTION = t.palette[2];
const EXCITED_ABSORPTION = t.palette[3];

// Downward arrows = emission (photon out); upward arrows = absorption (photon in).
const transitions = [
  { from: 2, to: 1, x: 2.9, color: LYMAN, group: "Lyman", wavelength: "121.6 nm" },
  { from: 3, to: 1, x: 3.44, color: LYMAN, group: "Lyman", wavelength: "102.6 nm" },
  { from: 4, to: 1, x: 3.99, color: LYMAN, group: "Lyman", wavelength: "97.3 nm" },
  { from: 3, to: 2, x: 4.53, color: BALMER, group: "Balmer", wavelength: "656.3 nm" },
  { from: 4, to: 2, x: 5.07, color: BALMER, group: "Balmer", wavelength: "486.1 nm" },
  { from: 1, to: 3, x: 5.61, color: ABSORPTION, group: "Absorption", wavelength: "102.6 nm" },
  { from: 1, to: 4, x: 6.16, color: ABSORPTION, group: "Absorption", wavelength: "97.3 nm" },
  { from: 2, to: 6, x: 6.7, color: EXCITED_ABSORPTION, group: "Excited absorption", wavelength: "410.2 nm" },
];

const LEGEND_ITEMS = [
  { color: LYMAN, label: "Lyman series · emission → n = 1 (UV) ↓" },
  { color: BALMER, label: "Balmer series · emission → n = 2 (visible) ↓" },
  { color: ABSORPTION, label: "Ground-state absorption ↑" },
  { color: EXCITED_ABSORPTION, label: "Excited-state absorption (n=2→n=6) ↑" },
];

// Levels bunch up near the ionization limit under a raw eV scale, so the
// vertical axis maps energy through a compressive power transform (still
// strictly monotonic, so ordering and relative magnitude stay legible) —
// see the spec's guidance to use a nonlinear scale near convergence.
const COMPRESS_POWER = 0.35;
const compress = (energyEv) => (energyEv >= 0 ? energyEv : -((-energyEv) ** COMPRESS_POWER));
const Y_DOMAIN_MIN = compress(-RYDBERG_EV);
const Y_DOMAIN_MAX = 0.3;
const Y_TICKS = [0, -1, -3, -6, -13.6];

const LEVEL_X1 = 2.3;
const LEVEL_X2 = 7.1;
const X_DOMAIN_MAX = 8.3;

// --- Axis: manual ticks + gridlines in the compressed energy space ---------
function EnergyAxis() {
  const yScale = useYScale();
  const { left, top, width, height } = useDrawingArea();
  return (
    <g>
      <line x1={left} x2={left} y1={top} y2={top + height} stroke={t.inkSoft} strokeWidth={1.5} />
      {Y_TICKS.map((value) => {
        const y = yScale(compress(value));
        return (
          <g key={value}>
            <line x1={left} x2={left + width} y1={y} y2={y} stroke={t.grid} strokeWidth={1} />
            <line x1={left - 8} x2={left} y1={y} y2={y} stroke={t.inkSoft} strokeWidth={1.5} />
            <text x={left - 14} y={y} textAnchor="end" dominantBaseline="central" fontSize={14} fill={t.inkSoft}>
              {value} eV
            </text>
          </g>
        );
      })}
    </g>
  );
}

// --- Energy levels: partial-width horizontal lines, labeled both sides -----
function EnergyLevels() {
  const xScale = useXScale();
  const yScale = useYScale();
  return (
    <g>
      {levels.map((level) => {
        const y = yScale(compress(level.energy));
        const x1 = xScale(LEVEL_X1);
        const x2 = xScale(LEVEL_X2);
        return (
          <g key={level.n}>
            <line x1={x1} x2={x2} y1={y} y2={y} stroke={t.ink} strokeWidth={3} strokeLinecap="round" />
            <text x={x1 - 16} y={y} textAnchor="end" dominantBaseline="central" fontSize={15} fill={t.ink}>
              {level.label}
            </text>
            <text x={x2 + 16} y={y} textAnchor="start" dominantBaseline="central" fontSize={14} fill={t.inkSoft}>
              {level.energy.toFixed(2)} eV
            </text>
          </g>
        );
      })}
    </g>
  );
}

// --- Transitions: color-by-series vertical arrows, wavelength alongside ----
function Transitions() {
  const xScale = useXScale();
  const yScale = useYScale();
  const arrowColors = [LYMAN, BALMER, ABSORPTION, EXCITED_ABSORPTION];
  return (
    <g>
      <defs>
        {arrowColors.map((color) => (
          <marker
            key={color}
            id={`arrowhead-${color.replace("#", "")}`}
            viewBox="0 0 10 10"
            refX={8}
            refY={5}
            markerWidth={7}
            markerHeight={7}
            orient="auto"
          >
            <path d="M0,0 L10,5 L0,10 z" fill={color} />
          </marker>
        ))}
      </defs>
      {transitions.map((transition, index) => {
        const x = xScale(transition.x);
        const y1 = yScale(compress(energyOf(transition.from)));
        const y2 = yScale(compress(energyOf(transition.to)));
        const midY = (y1 + y2) / 2;
        return (
          <g key={index}>
            <line
              x1={x}
              x2={x}
              y1={y1}
              y2={y2}
              stroke={transition.color}
              strokeWidth={2.5}
              markerEnd={`url(#arrowhead-${transition.color.replace("#", "")})`}
            />
            <text
              x={x + 15}
              y={midY}
              fontSize={13}
              fill={transition.color}
              textAnchor="middle"
              transform={`rotate(-90 ${x + 15} ${midY})`}
            >
              {transition.wavelength}
            </text>
          </g>
        );
      })}
    </g>
  );
}

const TITLE_H = 56;
const CONTEXT_H = 32;
const LEGEND_H = 36;
const Y_LABEL_W = 36;

// --- Chart (default-exported component — the harness mounts it) ------------
export default function Chart() {
  const { width, height } = window.ANYPLOT_SIZE;
  const chartAreaHeight = height - TITLE_H - CONTEXT_H - LEGEND_H;
  const chartWidth = width - Y_LABEL_W;

  return (
    <Box
      sx={{
        width,
        height,
        bgcolor: t.pageBg,
        boxSizing: "border-box",
        display: "flex",
        flexDirection: "column",
        fontFamily: "'Roboto', 'Helvetica Neue', Arial, sans-serif",
      }}
    >
      <Box sx={{ height: TITLE_H, display: "flex", alignItems: "center", pl: "28px" }}>
        <Typography sx={{ color: t.ink, fontSize: 27, fontWeight: 600 }}>
          energy-level-atomic · javascript · muix · anyplot.ai
        </Typography>
      </Box>
      <Box sx={{ height: CONTEXT_H, display: "flex", alignItems: "center", pl: "28px" }}>
        <Typography sx={{ color: t.inkSoft, fontSize: 14 }}>
          Hydrogen atom (Z = 1), E_n = −13.6 eV / n² · vertical axis uses a compressed scale so levels near the
          ionization limit stay distinguishable
        </Typography>
      </Box>
      <Box sx={{ height: LEGEND_H, display: "flex", alignItems: "center", gap: "24px", pl: "28px" }}>
        {LEGEND_ITEMS.map((item) => (
          <Box key={item.label} sx={{ display: "flex", alignItems: "center", gap: "8px" }}>
            <Box sx={{ width: 14, height: 14, bgcolor: item.color, borderRadius: "3px", flexShrink: 0 }} />
            <Typography sx={{ color: t.inkSoft, fontSize: 13 }}>{item.label}</Typography>
          </Box>
        ))}
      </Box>

      <Box sx={{ display: "flex", flexDirection: "row", height: chartAreaHeight }}>
        <Box sx={{ width: Y_LABEL_W, display: "flex", alignItems: "center", justifyContent: "center" }}>
          <Typography sx={{ fontSize: 16, color: t.ink, whiteSpace: "nowrap", transform: "rotate(-90deg)" }}>
            Energy (eV)
          </Typography>
        </Box>
        <ChartContainer
          width={chartWidth}
          height={chartAreaHeight}
          skipAnimation
          series={[]}
          xAxis={[{ id: "x", min: 0, max: X_DOMAIN_MAX, scaleType: "linear" }]}
          yAxis={[{ id: "y", min: Y_DOMAIN_MIN, max: Y_DOMAIN_MAX, scaleType: "linear" }]}
          margin={{ top: 40, right: 24, bottom: 28, left: 64 }}
        >
          <EnergyAxis />
          <ChartsReferenceLine
            y={0}
            axisId="y"
            label="Ionization limit (E = 0 eV)"
            labelAlign="end"
            lineStyle={{ stroke: t.amber, strokeWidth: 2, strokeDasharray: "6 4" }}
            labelStyle={{ fill: t.amber, fontSize: 13, fontWeight: 600 }}
          />
          <EnergyLevels />
          <Transitions />
        </ChartContainer>
      </Box>
    </Box>
  );
}
Runnable source as JSON, for any HTTP client: https://api.anyplot.ai/specs/energy-level-atomic/muix/code. Any spec id and library id listed in llms-full.txt fit the same URL shape; every URL below is complete and callable.
{
  "spec_id": "energy-level-atomic",
  "language": "javascript",
  "library": "muix",
  "page": "https://anyplot.ai/energy-level-atomic/javascript/muix",
  "hub": "https://anyplot.ai/energy-level-atomic",
  "code_json": "https://api.anyplot.ai/specs/energy-level-atomic/muix/code",
  "spec_json": "https://api.anyplot.ai/specs/energy-level-atomic",
  "render_light_png": "https://storage.googleapis.com/anyplot-images/plots/energy-level-atomic/javascript/muix/plot-light.png",
  "render_dark_png": "https://storage.googleapis.com/anyplot-images/plots/energy-level-atomic/javascript/muix/plot-dark.png",
  "interactive_light_html": "https://storage.googleapis.com/anyplot-images/plots/energy-level-atomic/javascript/muix/plot-light.html",
  "interactive_dark_html": "https://storage.googleapis.com/anyplot-images/plots/energy-level-atomic/javascript/muix/plot-dark.html",
  "quality_score": 89.0,
  "license": "MIT",
  "guide": "https://anyplot.ai/llms.txt"
}
Part of Atomic Energy Level Diagram on anyplot.ai.