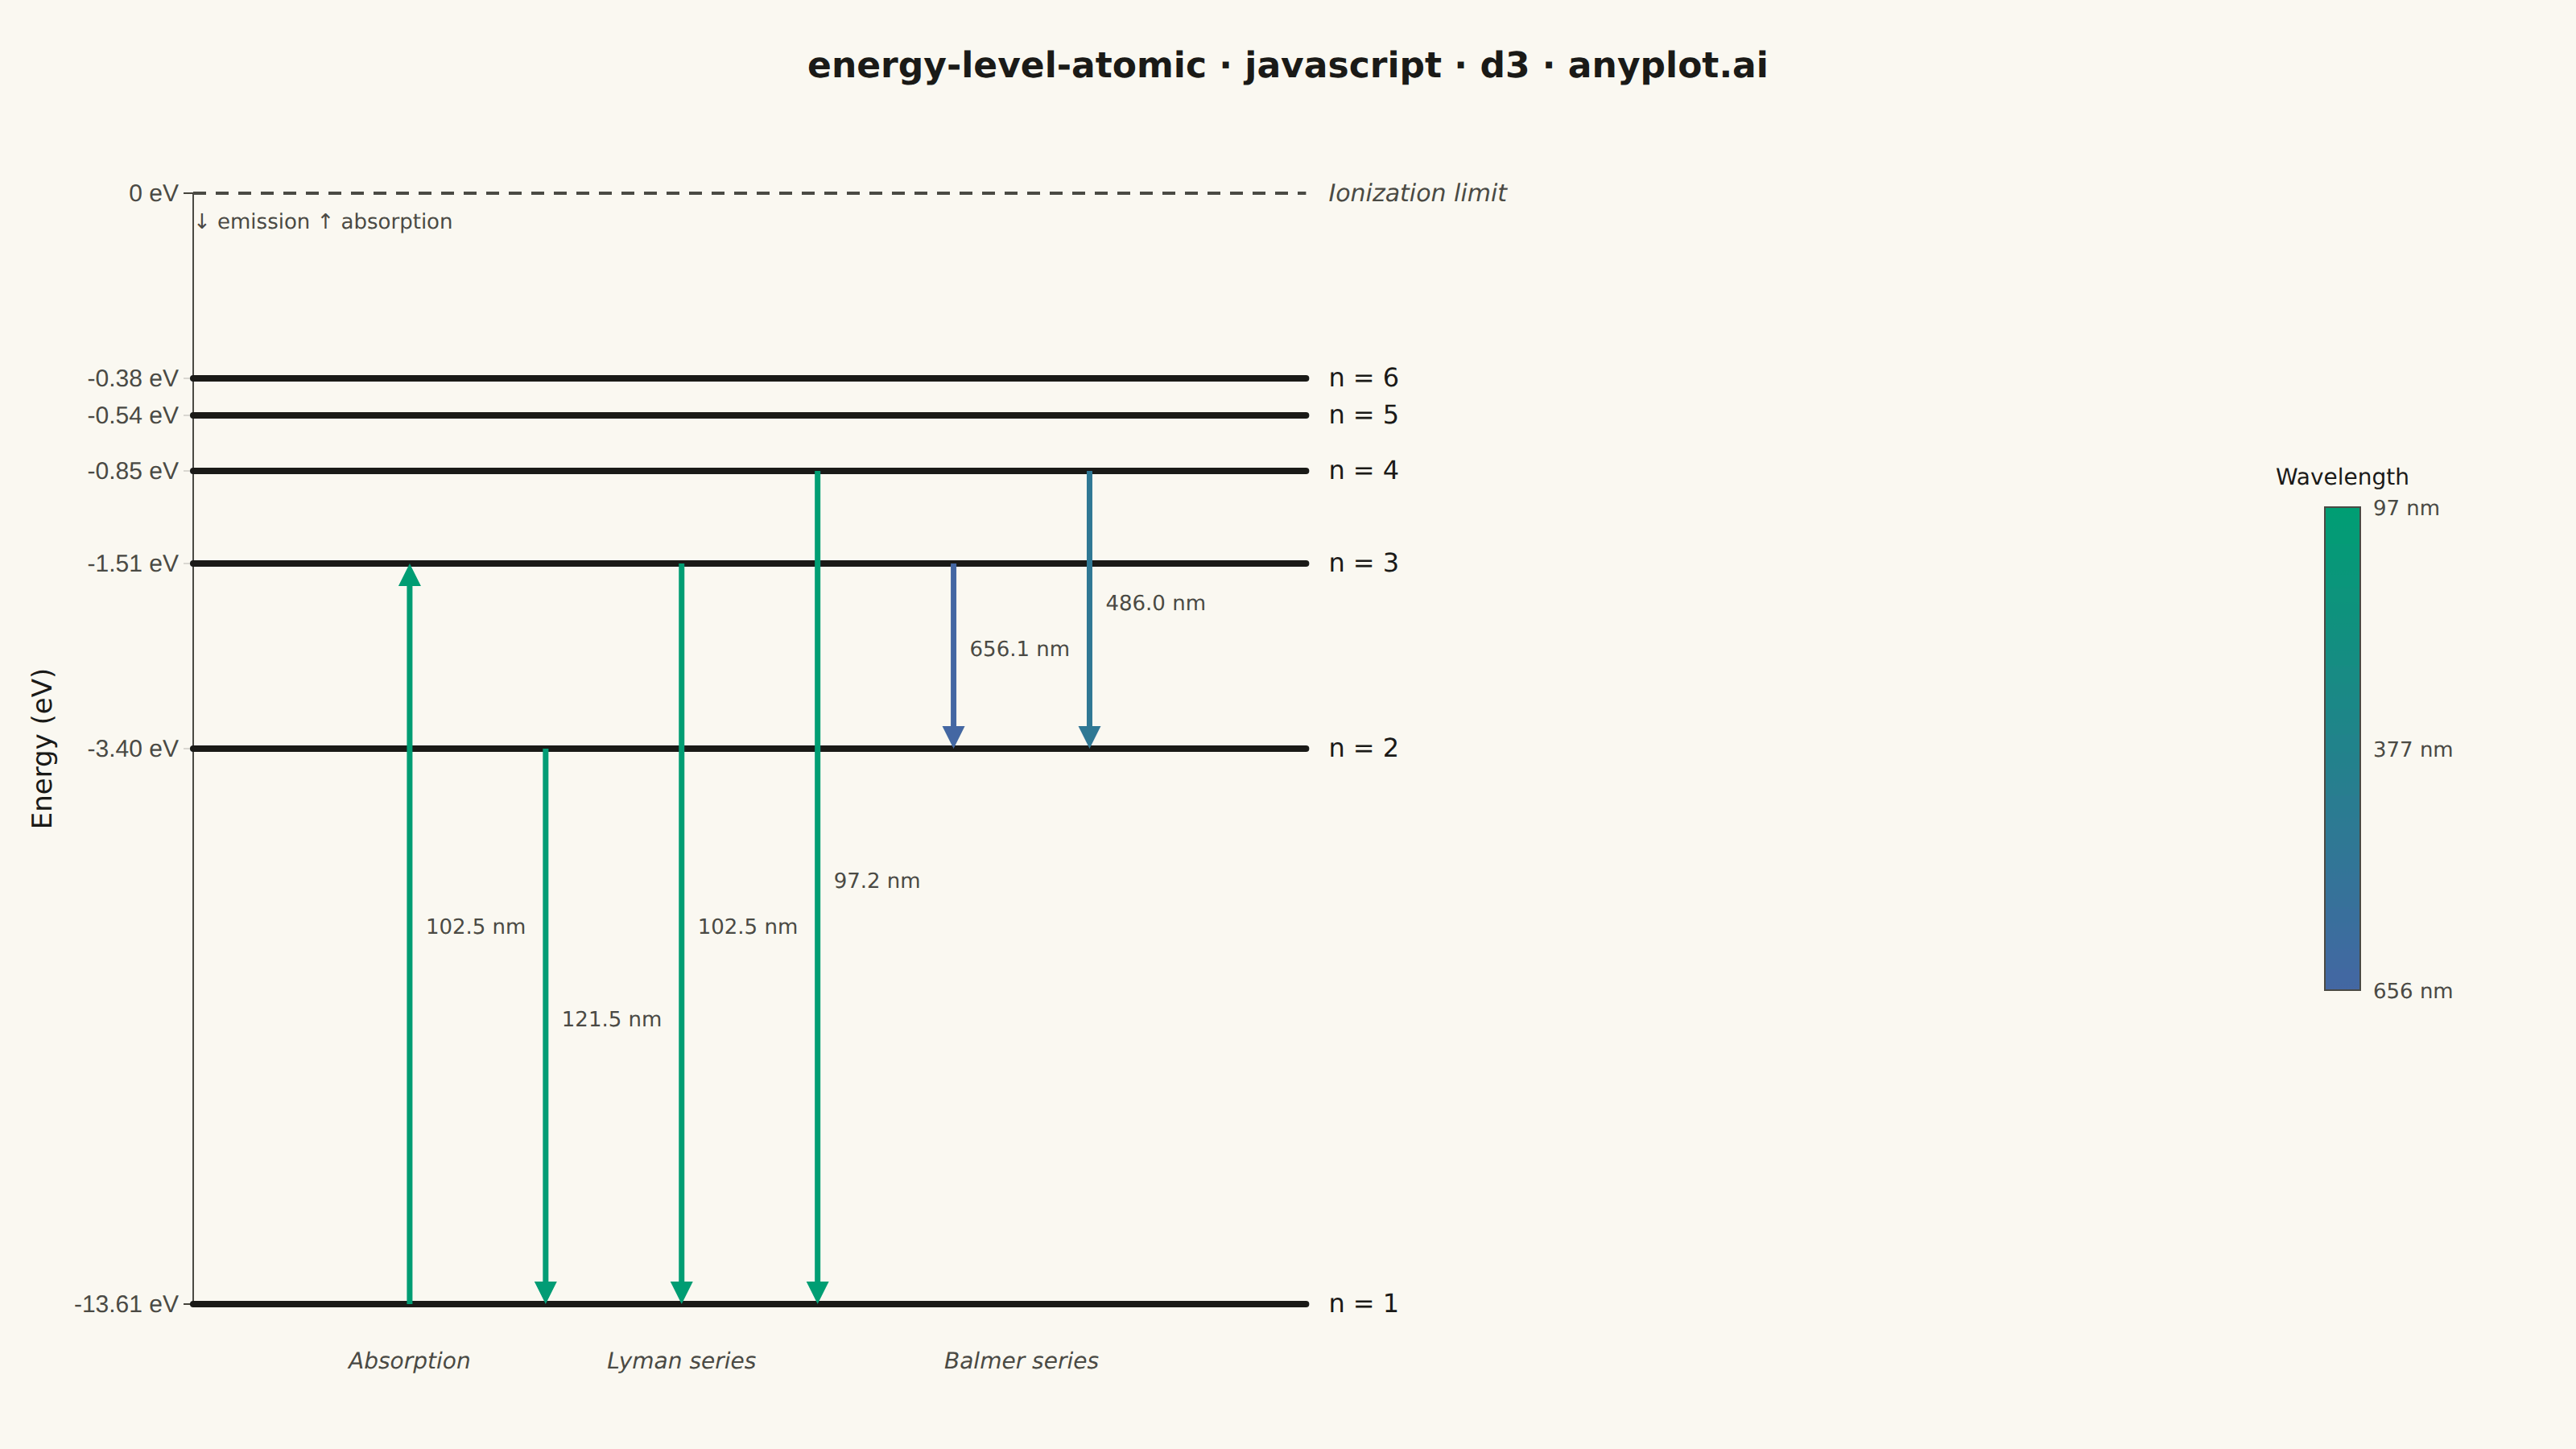
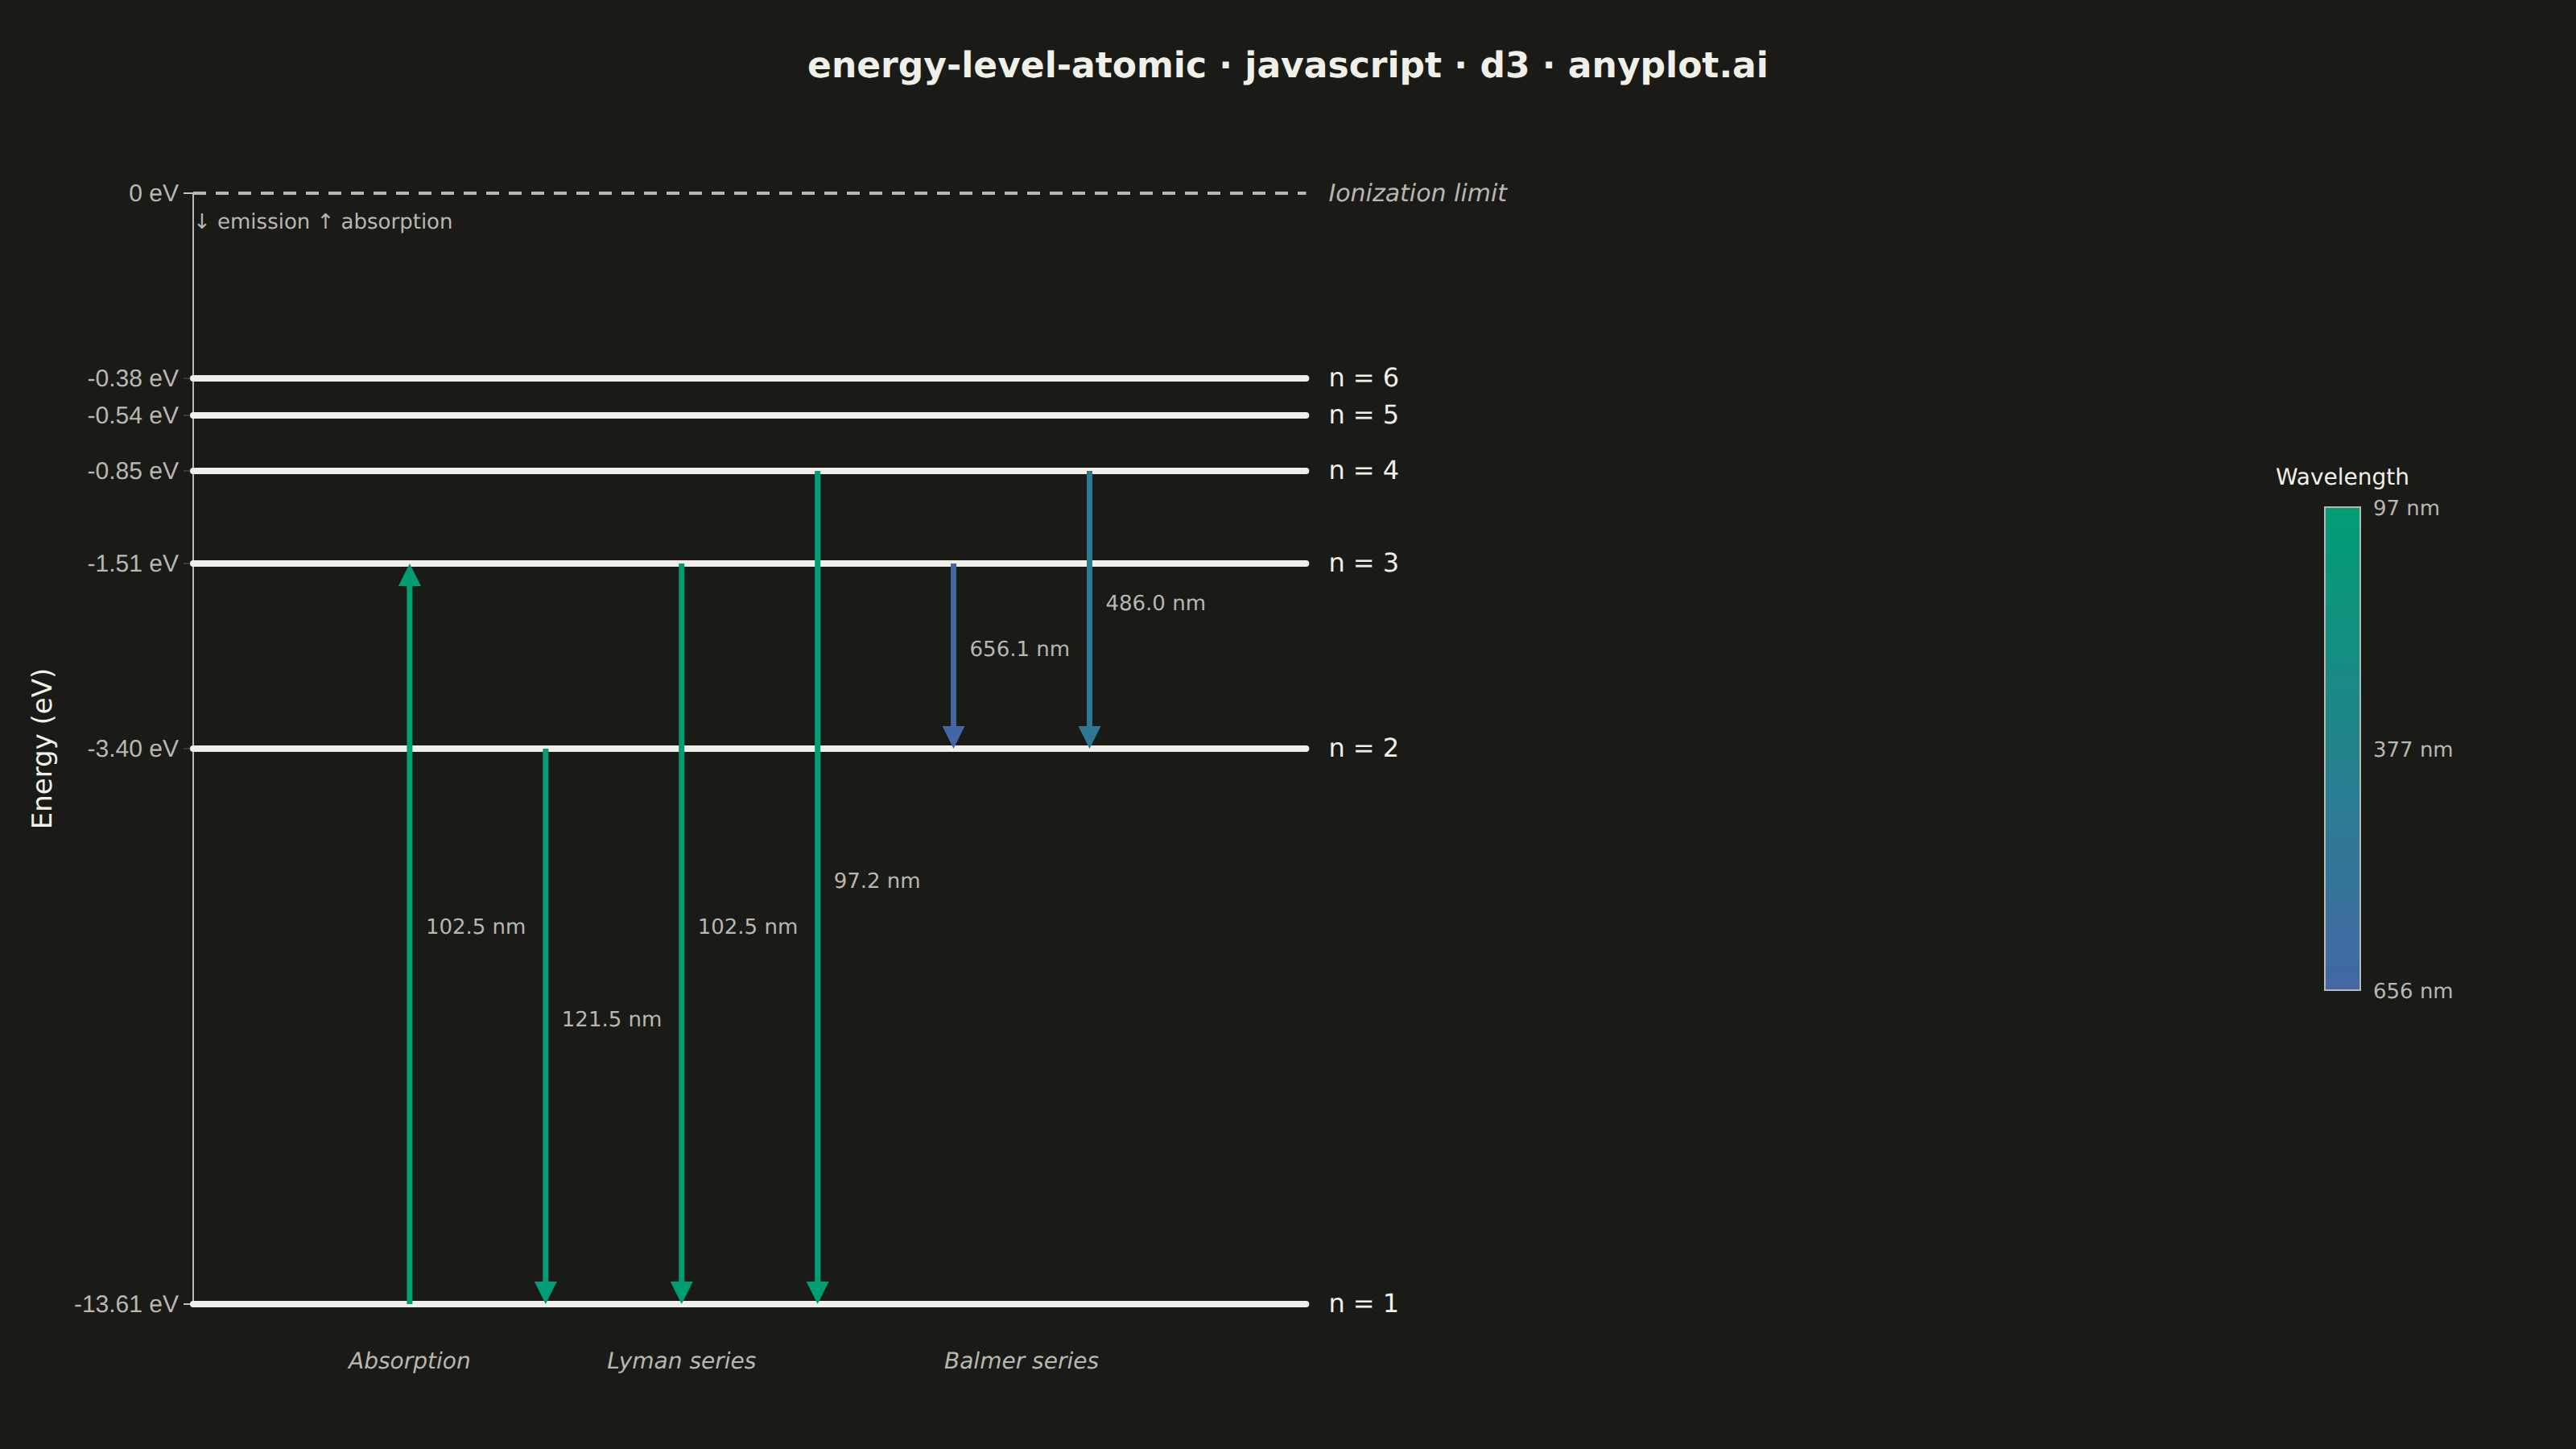
The same plot in 14 other libraries — JavaScript: Chart.js, Apache ECharts, Highcharts, MUI X Charts; Python: Altair, Bokeh, lets-plot, Matplotlib, Plotly, plotnine, Pygal, Seaborn; R: ggplot2; Julia: Makie.jl. Compare all 15 side by side: Atomic Energy Level Diagram in Python, R, Julia and JavaScript.
An energy level diagram displays quantized energy states as horizontal lines positioned at their respective energy values, with vertical arrows representing transitions between levels. This visualization reveals the discrete nature of atomic and molecular energy structures, making it essential for understanding spectral series, electron configurations, and quantum state transitions. It provides an intuitive way to connect abstract quantum numbers to observable spectral phenomena.
// anyplot.ai
// energy-level-atomic: Atomic Energy Level Diagram
// Library: d3 7.9.0 | JavaScript 22.23.2
// Quality: 93/100 | Created: 2026-08-24

const t = window.ANYPLOT_TOKENS;
const { width, height } = window.ANYPLOT_SIZE;
const margin = { top: 120, right: 200, bottom: 90, left: 120 };
const iw = width - margin.left - margin.right;
const ih = height - margin.top - margin.bottom;

// --- Data: hydrogen atom energy levels (in-memory, deterministic) ----------
// E(n) = -13.606 / n^2 eV — Rydberg formula for the hydrogen atom
const RYDBERG_EV = 13.606;
const levels = d3.range(1, 7).map((n) => ({ n, energy: -RYDBERG_EV / (n * n) }));
const energyOf = (n) => levels.find((l) => l.n === n).energy;

// Transitions: emission (downward, upper -> lower) and one absorption (upward)
const transitions = [
  { from: 1, to: 3, kind: "absorption", series: "Absorption" },
  { from: 2, to: 1, kind: "emission", series: "Lyman series" },
  { from: 3, to: 1, kind: "emission", series: "Lyman series" },
  { from: 4, to: 1, kind: "emission", series: "Lyman series" },
  { from: 3, to: 2, kind: "emission", series: "Balmer series" },
  { from: 4, to: 2, kind: "emission", series: "Balmer series" },
].map((tr) => {
  const deltaE = Math.abs(energyOf(tr.to) - energyOf(tr.from));
  const wavelengthNm = 1239.84 / deltaE; // E = hc / lambda, hc = 1239.84 eV*nm
  return { ...tr, deltaE, wavelengthNm };
});

// --- SVG mount ---------------------------------------------------------------
const svg = d3
  .select("#container")
  .append("svg")
  .attr("width", width)
  .attr("height", height)
  .style("font-family", "system-ui, -apple-system, sans-serif");

const g = svg.append("g").attr("transform", `translate(${margin.left},${margin.top})`);

// --- Scales -------------------------------------------------------------------
// Square-root transform on the (negative) energy axis spreads out the levels
// that converge near the ionization limit, per the spec's nonlinear-scale note.
const minEnergy = d3.min(levels, (d) => d.energy);
const y = d3.scalePow().exponent(0.5).domain([minEnergy, 0]).range([ih, 0]);

const levelLineWidth = iw * 0.54;
const arrowX = d3
  .scalePoint()
  .domain(transitions.map((_, i) => i))
  .range([50, levelLineWidth - 50])
  .padding(1);

const wavelengths = transitions.map((tr) => tr.wavelengthNm);
const [minWl, maxWl] = d3.extent(wavelengths);
const color = d3.scaleSequential(d3.interpolateRgbBasis(t.seq)).domain([minWl, maxWl]);

// --- Y axis (energy) -----------------------------------------------------------
const tickValues = [...levels.map((d) => d.energy), 0];
const yAxis = g
  .append("g")
  .call(
    d3
      .axisLeft(y)
      .tickValues(tickValues)
      .tickFormat((d) => (d === 0 ? "0 eV" : `${d.toFixed(2)} eV`))
      .tickSize(6)
  );
yAxis.selectAll("text").attr("fill", t.inkSoft).style("font-size", "15px");
yAxis.selectAll("line").attr("stroke", t.grid);
yAxis.select(".domain").attr("stroke", t.inkSoft);

g.append("text")
  .attr("transform", "rotate(-90)")
  .attr("x", -ih / 2)
  .attr("y", -88)
  .attr("text-anchor", "middle")
  .attr("fill", t.ink)
  .style("font-size", "17px")
  .text("Energy (eV)");

// --- Ionization limit reference line -------------------------------------------
g.append("line")
  .attr("x1", 0)
  .attr("x2", levelLineWidth)
  .attr("y1", y(0))
  .attr("y2", y(0))
  .attr("stroke", t.inkSoft)
  .attr("stroke-width", 2)
  .attr("stroke-dasharray", "8,6");

g.append("text")
  .attr("x", levelLineWidth + 14)
  .attr("y", y(0) + 5)
  .attr("fill", t.inkSoft)
  .style("font-size", "15px")
  .style("font-style", "italic")
  .text("Ionization limit");

// --- Energy level lines ----------------------------------------------------
g.selectAll(".level-line")
  .data(levels)
  .join("line")
  .attr("class", "level-line")
  .attr("x1", 0)
  .attr("x2", levelLineWidth)
  .attr("y1", (d) => y(d.energy))
  .attr("y2", (d) => y(d.energy))
  .attr("stroke", t.ink)
  .attr("stroke-width", 4)
  .attr("stroke-linecap", "round");

g.selectAll(".level-label")
  .data(levels)
  .join("text")
  .attr("class", "level-label")
  .attr("x", levelLineWidth + 14)
  .attr("y", (d) => y(d.energy) + 5)
  .attr("fill", t.ink)
  .style("font-size", "16px")
  .style("font-weight", "500")
  .text((d) => `n = ${d.n}`);

// --- Transition arrows, colored by transition wavelength -----------------------
const headLen = 14;
transitions.forEach((tr, i) => {
  const x = arrowX(i);
  const yFrom = y(energyOf(tr.from));
  const yTo = y(energyOf(tr.to));
  const dir = yTo > yFrom ? 1 : -1; // +1 = pointing down (emission), -1 = up (absorption)
  const c = color(tr.wavelengthNm);

  g.append("line")
    .attr("x1", x)
    .attr("y1", yFrom)
    .attr("x2", x)
    .attr("y2", yTo - dir * headLen)
    .attr("stroke", c)
    .attr("stroke-width", 3.5);

  g.append("path")
    .attr(
      "d",
      `M ${x - 7} ${yTo - dir * headLen} L ${x + 7} ${yTo - dir * headLen} L ${x} ${yTo} Z`
    )
    .attr("fill", c);

  g.append("text")
    .attr("x", x + 10)
    .attr("y", (yFrom + yTo) / 2)
    .attr("fill", t.inkSoft)
    .style("font-size", "13px")
    .text(`${tr.wavelengthNm.toFixed(1)} nm`);
});

// --- Series group labels beneath the plot ---------------------------------------
const seriesGroups = d3.rollup(
  transitions.map((tr, i) => ({ ...tr, x: arrowX(i) })),
  (v) => d3.mean(v, (d) => d.x),
  (d) => d.series
);
for (const [series, cx] of seriesGroups) {
  g.append("text")
    .attr("x", cx)
    .attr("y", ih + 40)
    .attr("text-anchor", "middle")
    .attr("fill", t.inkSoft)
    .style("font-size", "14px")
    .style("font-style", "italic")
    .text(series);
}

// --- Direction legend ------------------------------------------------------
g.append("text")
  .attr("x", 0)
  .attr("y", 22)
  .attr("fill", t.inkSoft)
  .style("font-size", "13px")
  .text("↓ emission   ↑ absorption");

// --- Wavelength colorbar legend (vertical, in the right margin) ----------------
const barX = iw + 44;
const barWidth = 22;
const barHeight = 300;
const barY = (ih - barHeight) / 2;

const gradientId = "wavelength-gradient";
const defs = svg.append("defs");
const gradient = defs
  .append("linearGradient")
  .attr("id", gradientId)
  .attr("x1", "0")
  .attr("x2", "0")
  .attr("y1", "0")
  .attr("y2", "1");
gradient.append("stop").attr("offset", "0%").attr("stop-color", t.seq[0]);
gradient.append("stop").attr("offset", "100%").attr("stop-color", t.seq[1]);

g.append("rect")
  .attr("x", barX)
  .attr("y", barY)
  .attr("width", barWidth)
  .attr("height", barHeight)
  .attr("fill", `url(#${gradientId})`)
  .attr("stroke", t.inkSoft)
  .attr("stroke-width", 1);

const wlScale = d3.scaleLinear().domain([minWl, maxWl]).range([0, barHeight]);
[minWl, (minWl + maxWl) / 2, maxWl].forEach((wl) => {
  g.append("text")
    .attr("x", barX + barWidth + 8)
    .attr("y", barY + wlScale(wl) + 5)
    .attr("fill", t.inkSoft)
    .style("font-size", "13px")
    .text(`${Math.round(wl)} nm`);
});

g.append("text")
  .attr("x", barX + barWidth / 2)
  .attr("y", barY - 14)
  .attr("text-anchor", "middle")
  .attr("fill", t.ink)
  .style("font-size", "14px")
  .text("Wavelength");

// --- Title ------------------------------------------------------------------
svg
  .append("text")
  .attr("x", width / 2)
  .attr("y", 48)
  .attr("text-anchor", "middle")
  .attr("fill", t.ink)
  .style("font-size", "22px")
  .style("font-weight", "600")
  .text("energy-level-atomic · javascript · d3 · anyplot.ai");
Runnable source as JSON, for any HTTP client: https://api.anyplot.ai/specs/energy-level-atomic/d3/code. Any spec id and library id listed in llms-full.txt fit the same URL shape; every URL below is complete and callable.
{
  "spec_id": "energy-level-atomic",
  "language": "javascript",
  "library": "d3",
  "page": "https://anyplot.ai/energy-level-atomic/javascript/d3",
  "hub": "https://anyplot.ai/energy-level-atomic",
  "code_json": "https://api.anyplot.ai/specs/energy-level-atomic/d3/code",
  "spec_json": "https://api.anyplot.ai/specs/energy-level-atomic",
  "render_light_png": "https://storage.googleapis.com/anyplot-images/plots/energy-level-atomic/javascript/d3/plot-light.png",
  "render_dark_png": "https://storage.googleapis.com/anyplot-images/plots/energy-level-atomic/javascript/d3/plot-dark.png",
  "interactive_light_html": "https://storage.googleapis.com/anyplot-images/plots/energy-level-atomic/javascript/d3/plot-light.html",
  "interactive_dark_html": "https://storage.googleapis.com/anyplot-images/plots/energy-level-atomic/javascript/d3/plot-dark.html",
  "quality_score": 93.0,
  "license": "MIT",
  "guide": "https://anyplot.ai/llms.txt"
}
Part of Atomic Energy Level Diagram on anyplot.ai.