The same plot in 14 other libraries — JavaScript: D3.js, Apache ECharts, Highcharts, MUI X Charts; Python: Altair, Bokeh, lets-plot, Matplotlib, Plotly, plotnine, Pygal, Seaborn; R: ggplot2; Julia: Makie.jl. Compare all 15 side by side: Flame Graph for Performance Profiling in Python, R, Julia and JavaScript.
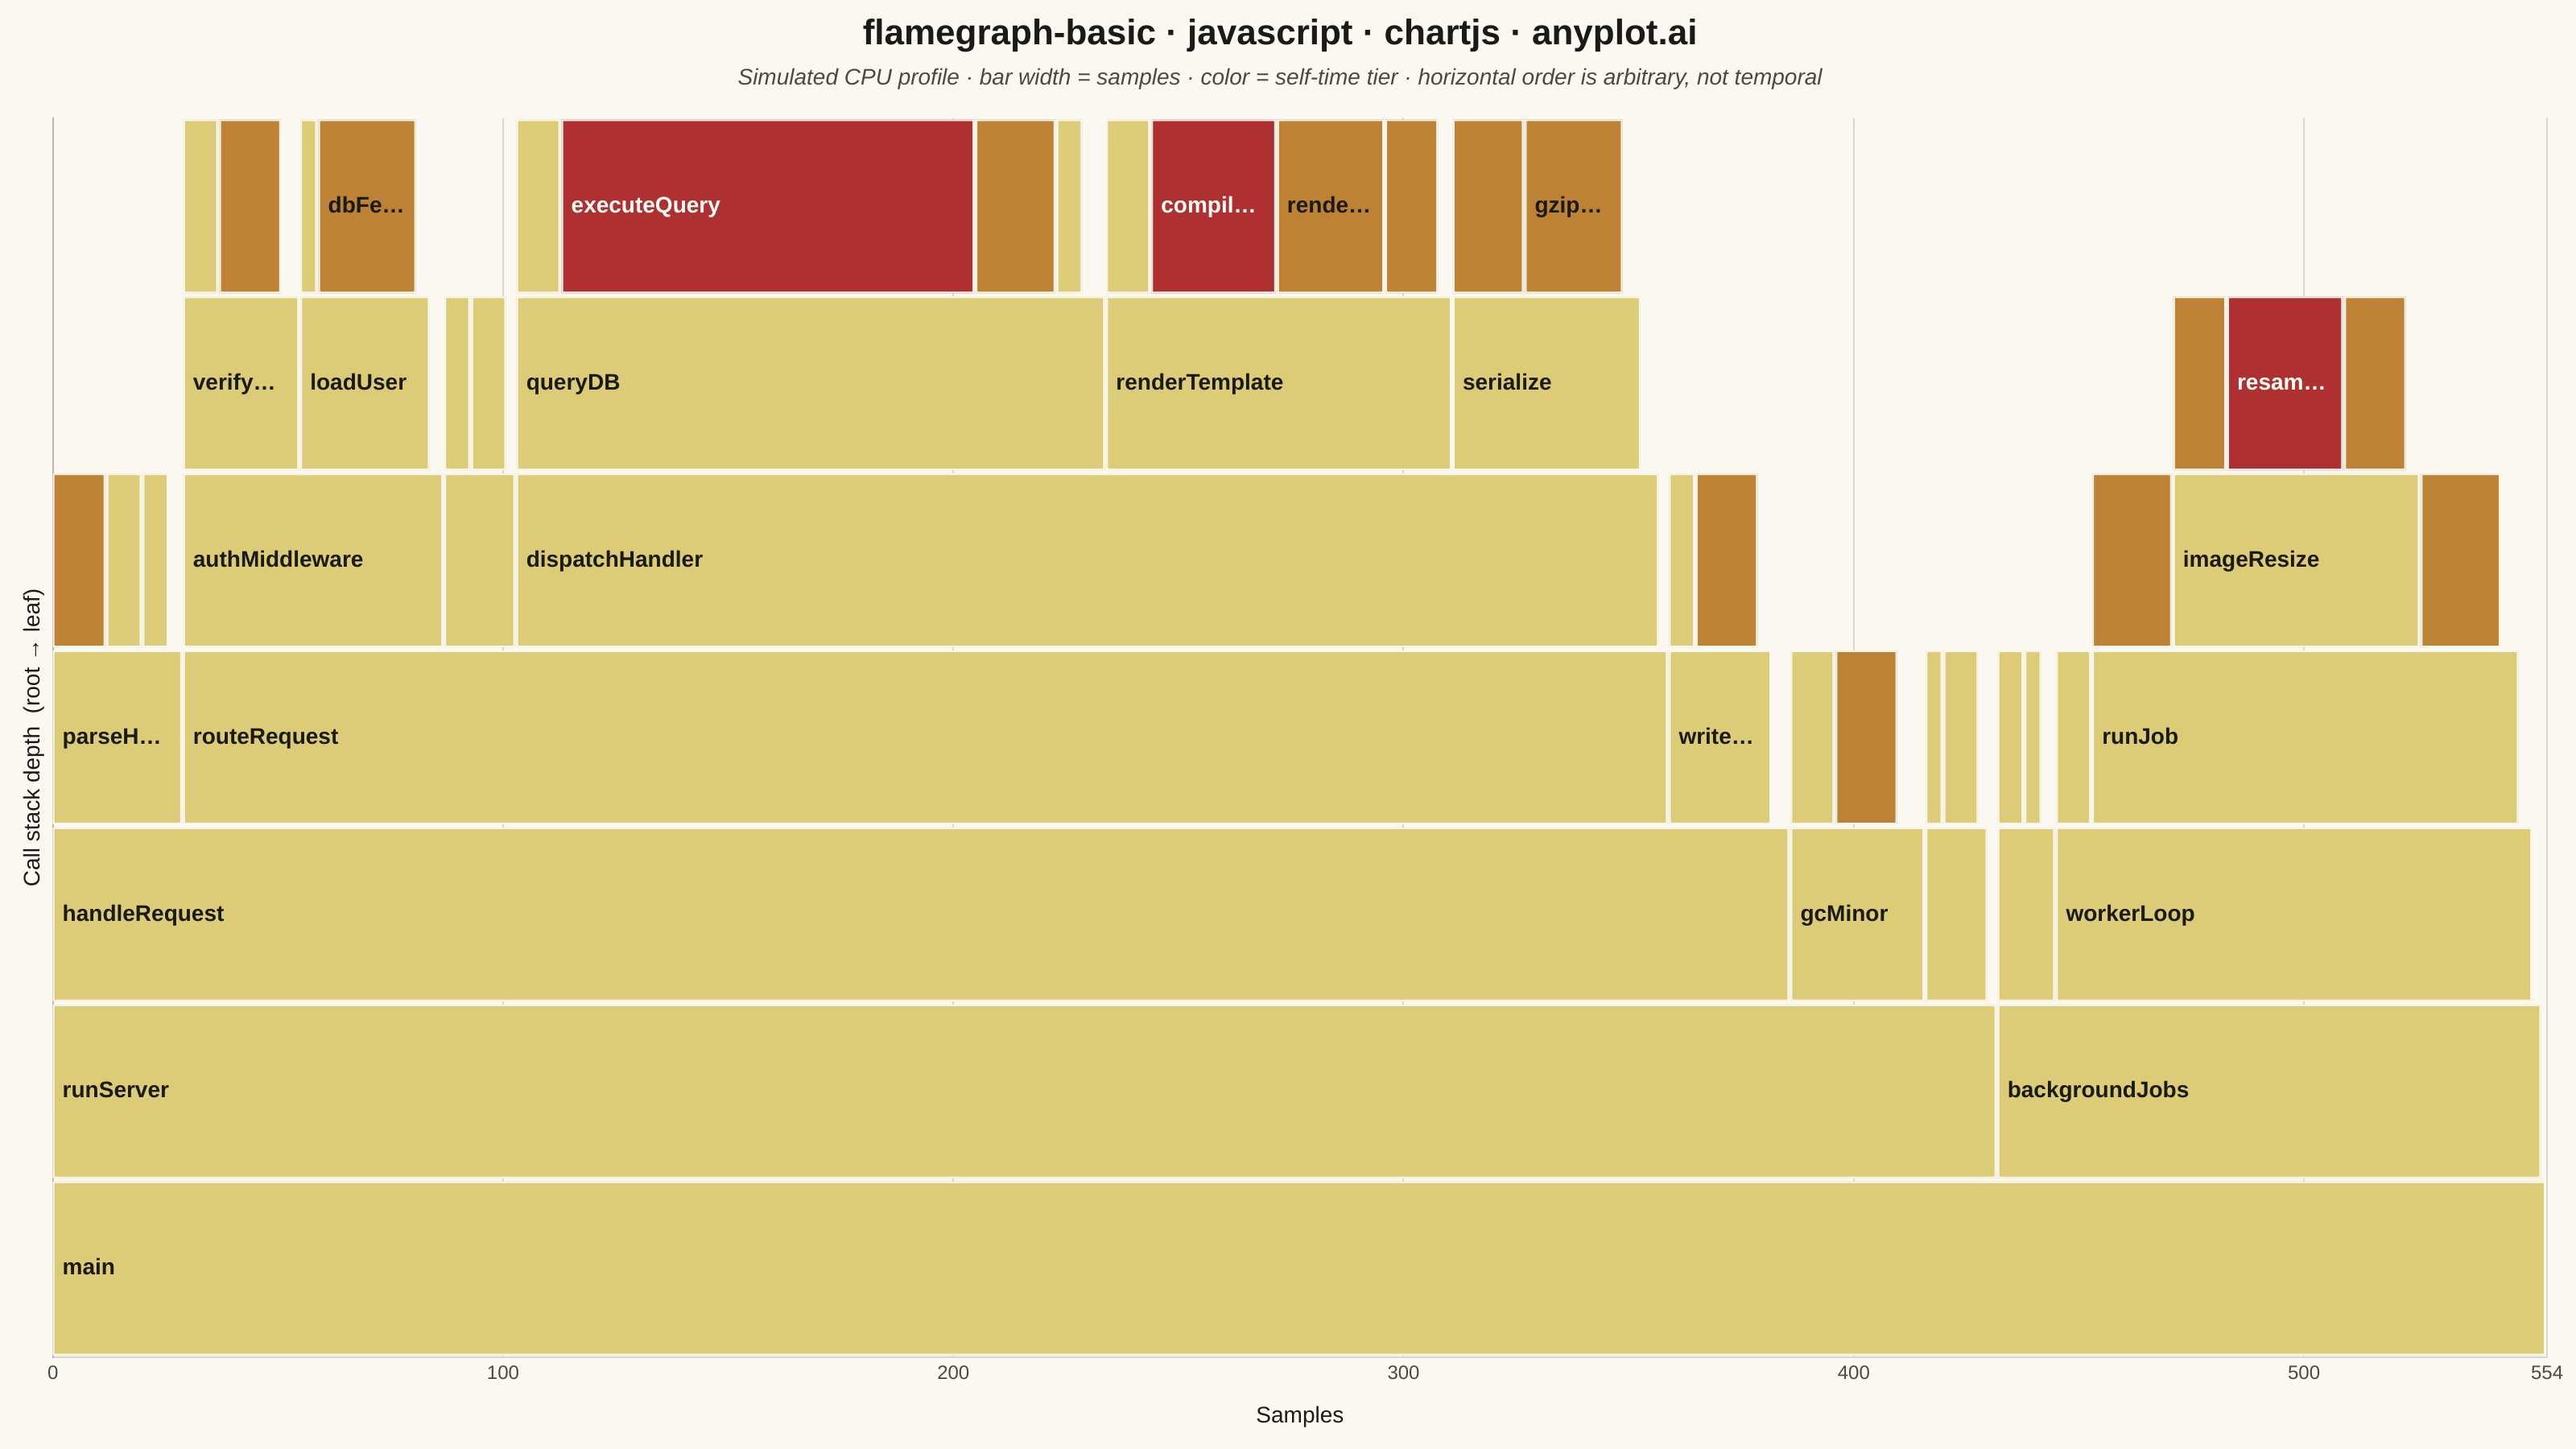
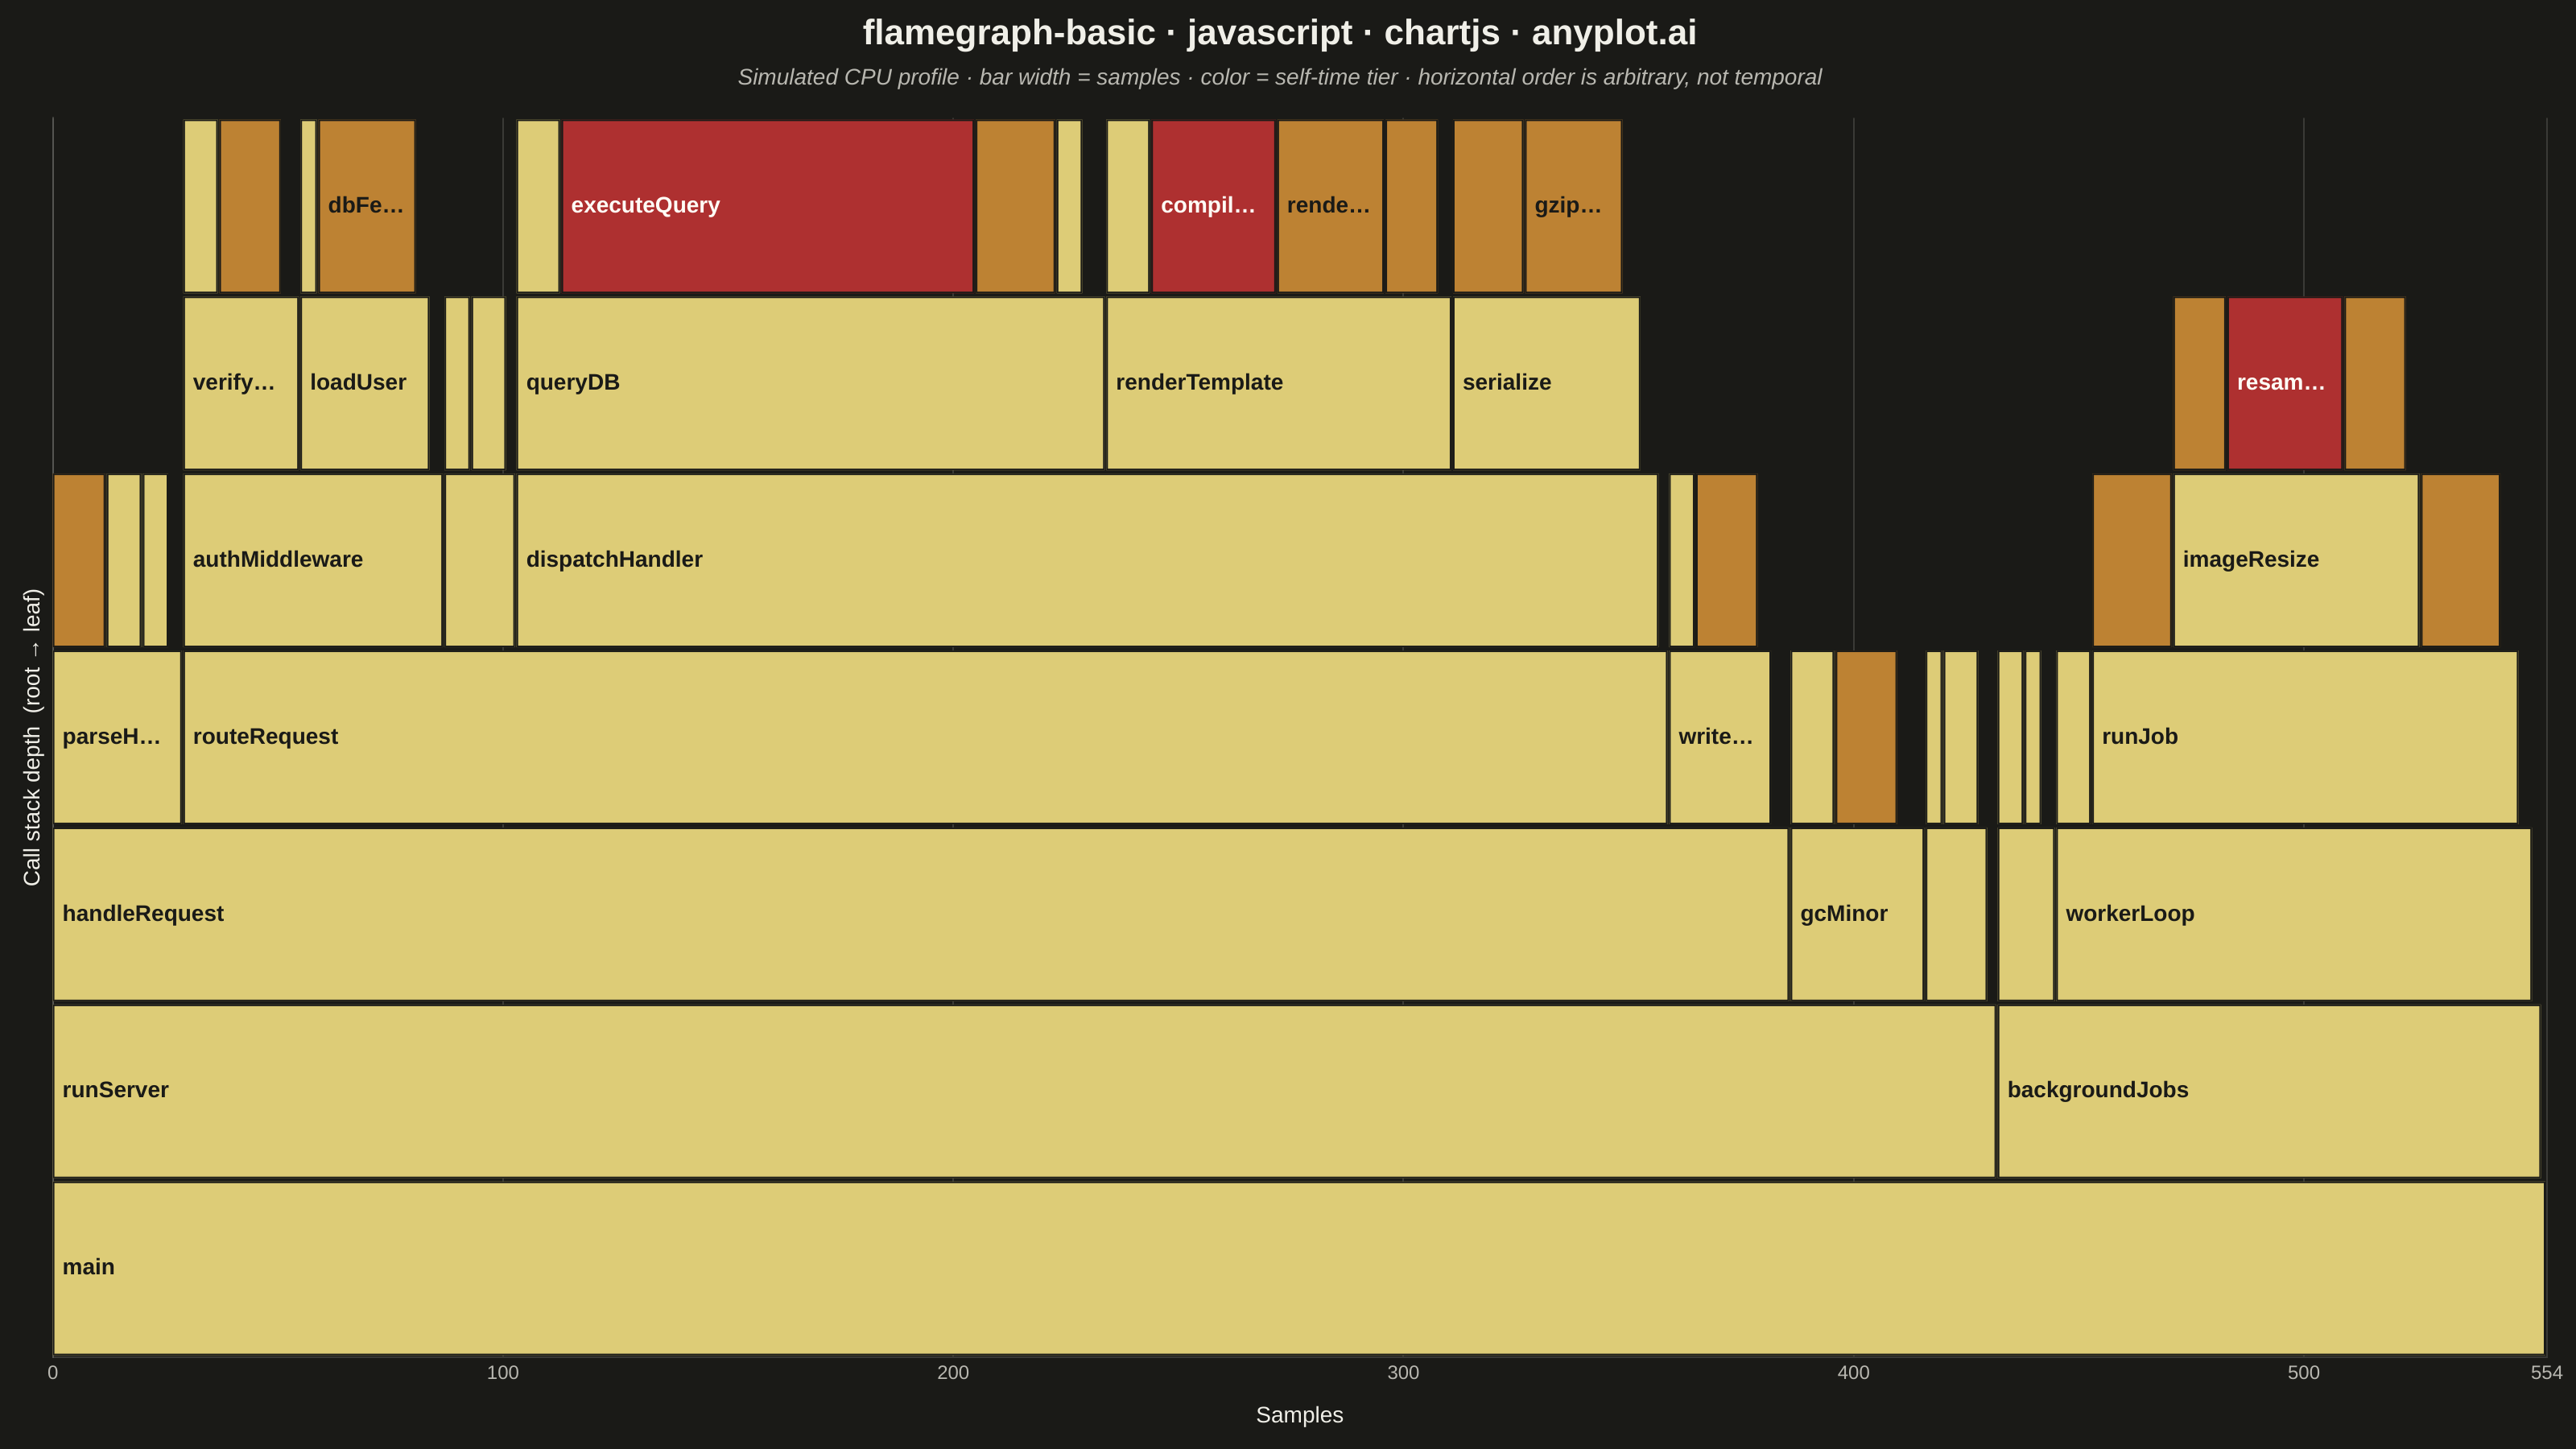
A flame graph visualizes hierarchical call stack data from performance profiling, where each horizontal bar represents a function in the call stack and its width is proportional to the time (or samples) spent in that function. Stacks are layered bottom-to-top showing caller-to-callee relationships. Invented by Brendan Gregg, flame graphs are the standard visualization for identifying CPU bottlenecks and hot code paths across all major programming languages and profiling tools.
// anyplot.ai
// flamegraph-basic: Flame Graph for Performance Profiling
// Library: chartjs 4.4.7 | JavaScript 22.22.3
// Quality: 93/100 | Created: 2026-06-08
//# anyplot-orientation: landscape

const t = window.ANYPLOT_TOKENS;

// --- Data: simulated CPU profile of a web API request handler --------------
// Tree of call stacks. `self` = samples spent in the function itself (not in
// its children). A node's *total* = self + sum(children.total) and becomes the
// width of its flame-graph bar. Children sit above the parent and fill it
// left-to-right; any leftover width at depth+1 is the parent's `self` time.
const profile = {
  name: "main", self: 1, children: [
    { name: "runServer", self: 2, children: [
      { name: "handleRequest", self: 4, children: [
        { name: "parseHeaders", self: 3, children: [
          { name: "decodeUtf8", self: 12, children: [] },
          { name: "lowercaseKeys", self: 8, children: [] },
          { name: "splitCookies", self: 6, children: [] },
        ] },
        { name: "routeRequest", self: 2, children: [
          { name: "authMiddleware", self: 3, children: [
            { name: "verifyToken", self: 4, children: [
              { name: "parseJwt", self: 8, children: [] },
              { name: "validateSig", self: 14, children: [] },
            ] },
            { name: "loadUser", self: 3, children: [
              { name: "cacheGet", self: 4, children: [] },
              { name: "dbFetch", self: 22, children: [] },
            ] },
          ] },
          { name: "rateLimitCheck", self: 2, children: [
            { name: "bucketLookup", self: 6, children: [] },
            { name: "bucketUpdate", self: 8, children: [] },
          ] },
          { name: "dispatchHandler", self: 4, children: [
            { name: "queryDB", self: 5, children: [
              { name: "openConn", self: 10, children: [] },
              { name: "executeQuery", self: 92, children: [] },
              { name: "parseRows", self: 18, children: [] },
              { name: "closeConn", self: 6, children: [] },
            ] },
            { name: "renderTemplate", self: 3, children: [
              { name: "loadTemplate", self: 10, children: [] },
              { name: "compileTemplate", self: 28, children: [] },
              { name: "renderHTML", self: 24, children: [] },
              { name: "escapeHTML", self: 12, children: [] },
            ] },
            { name: "serialize", self: 4, children: [
              { name: "jsonStringify", self: 16, children: [] },
              { name: "gzipCompress", self: 22, children: [] },
            ] },
          ] },
        ] },
        { name: "writeResponse", self: 3, children: [
          { name: "setHeaders", self: 6, children: [] },
          { name: "flushBuffer", self: 14, children: [] },
        ] },
      ] },
      { name: "gcMinor", self: 6, children: [
        { name: "markRefs", self: 10, children: [] },
        { name: "sweepHeap", self: 14, children: [] },
      ] },
      { name: "logRequest", self: 2, children: [
        { name: "formatLog", self: 4, children: [] },
        { name: "writeLog", self: 8, children: [] },
      ] },
    ] },
    { name: "backgroundJobs", self: 2, children: [
      { name: "cronTick", self: 3, children: [
        { name: "scanJobs", self: 6, children: [] },
        { name: "claimJob", self: 4, children: [] },
      ] },
      { name: "workerLoop", self: 3, children: [
        { name: "fetchJob", self: 8, children: [] },
        { name: "runJob", self: 4, children: [
          { name: "emailSend", self: 18, children: [] },
          { name: "imageResize", self: 3, children: [
            { name: "decodeImg", self: 12, children: [] },
            { name: "resampleImg", self: 26, children: [] },
            { name: "encodeImg", self: 14, children: [] },
          ] },
          { name: "dataExport", self: 18, children: [] },
        ] },
      ] },
    ] },
  ],
};

// Flatten the tree into (depth, start, end, total, self) frames via DFS.
const frames = [];
let maxDepth = 0;
function visit(node, depth, x) {
  if (depth > maxDepth) maxDepth = depth;
  let childX = x;
  let kidsTotal = 0;
  for (const child of node.children) {
    const ct = visit(child, depth + 1, childX);
    childX += ct;
    kidsTotal += ct;
  }
  const total = node.self + kidsTotal;
  frames.push({ name: node.name, depth, start: x, end: x + total, total, self: node.self });
  return total;
}
const totalSamples = visit(profile, 0, 0);

// --- Warm palette tiered by self-samples (hotness encoding) ----------------
// Imprint's three warm anchors map to a self-time tier so the eye lands on
// the actual hotspot (the matte-red frame) instead of color being decorative.
// Dark text rides on the lighter amber/ochre tiers; light text on matte red.
// Thresholds: low ≤10 (cool amber), medium ≤24 (ochre), high >24 (matte red).
function colorFor(self) {
  if (self > 24) return { fill: "#AE3030", text: "#FFFDF6" };
  if (self > 10) return { fill: "#BD8233", text: "#1A1A17" };
  return { fill: "#DDCC77", text: "#1A1A17" };
}

// --- Mount -----------------------------------------------------------------
const canvas = document.createElement("canvas");
document.getElementById("container").appendChild(canvas);

// --- Custom flame-graph renderer ------------------------------------------
// Chart.js core has no flame-graph type, so we run a `type: 'bar'` chart for
// its axes / title chrome and draw the per-frame rectangles ourselves in an
// `afterDatasetsDraw` plugin. y-pixel positions are computed from chartArea
// rather than the category scale so reverse / band alignment stay exact.
const flamePlugin = {
  id: "flamegraph",
  afterDatasetsDraw(chart) {
    const { ctx, chartArea, scales: { x } } = chart;
    const rows = maxDepth + 1;
    const bandPx = (chartArea.bottom - chartArea.top) / rows;
    const gap = 2;
    const barH = Math.max(2, bandPx - gap);

    ctx.save();
    ctx.font = "600 14px -apple-system, BlinkMacSystemFont, 'Segoe UI', Roboto, sans-serif";
    ctx.textBaseline = "middle";

    for (const f of frames) {
      const xLeft = x.getPixelForValue(f.start);
      const xRight = x.getPixelForValue(f.end);
      // depth 0 at the bottom band; depth N at the top.
      const yCenter = chartArea.bottom - (f.depth + 0.5) * bandPx;
      const top = yCenter - barH / 2;
      const w = Math.max(1, xRight - xLeft - 1);

      const { fill, text } = colorFor(f.self);
      ctx.fillStyle = fill;
      ctx.fillRect(xLeft, top, w, barH);
      // pageBg-coloured hairline separates adjacent siblings on both themes.
      ctx.strokeStyle = t.pageBg;
      ctx.lineWidth = 1;
      ctx.strokeRect(xLeft + 0.5, top + 0.5, w - 1, barH - 1);

      if (w >= 60) {
        ctx.fillStyle = text;
        let label = f.name;
        const maxText = w - 12;
        if (ctx.measureText(label).width > maxText) {
          while (label.length > 2 && ctx.measureText(label + "…").width > maxText) {
            label = label.slice(0, -1);
          }
          label = label + "…";
        }
        ctx.fillText(label, xLeft + 6, yCenter);
      }
    }
    ctx.restore();
  },
};

// --- Chart -----------------------------------------------------------------
const depthLabels = Array.from({ length: maxDepth + 1 }, (_, i) => String(i));

new Chart(canvas, {
  type: "bar",
  data: {
    labels: depthLabels,
    datasets: [{
      label: "Stack frames",
      data: depthLabels.map(() => 0), // placeholder; real bars are drawn by the plugin
      backgroundColor: "rgba(0,0,0,0)",
      borderColor: "rgba(0,0,0,0)",
    }],
  },
  options: {
    indexAxis: "y",
    responsive: true,
    maintainAspectRatio: false,
    animation: false,
    layout: { padding: { left: 8, right: 18, top: 4, bottom: 8 } },
    plugins: {
      title: {
        display: true,
        text: "flamegraph-basic · javascript · chartjs · anyplot.ai",
        color: t.ink,
        font: { size: 22, weight: "600" },
        padding: { top: 4, bottom: 6 },
      },
      subtitle: {
        display: true,
        text: "Simulated CPU profile · bar width = samples · color = self-time tier · horizontal order is arbitrary, not temporal",
        color: t.inkSoft,
        font: { size: 14, style: "italic" },
        padding: { bottom: 16 },
      },
      legend: { display: false },
      tooltip: { enabled: false },
    },
    scales: {
      x: {
        type: "linear",
        min: 0,
        max: totalSamples,
        title: {
          display: true,
          text: "Samples",
          color: t.ink,
          font: { size: 14 },
          padding: { top: 8 },
        },
        ticks: { color: t.inkSoft, font: { size: 12 } },
        grid: { color: t.grid, drawTicks: false },
        border: { color: t.grid },
      },
      y: {
        type: "category",
        labels: depthLabels,
        reverse: true, // depth 0 (root) at the bottom
        title: {
          display: true,
          text: "Call stack depth  (root → leaf)",
          color: t.ink,
          font: { size: 14 },
        },
        // Hide numeric tick labels — visible bar stacking + axis title already
        // convey depth; numeric ticks would just add chrome noise.
        ticks: { display: false },
        grid: { display: false, drawTicks: false },
        border: { color: t.grid },
      },
    },
  },
  plugins: [flamePlugin],
});
Runnable source as JSON, for any HTTP client: https://api.anyplot.ai/specs/flamegraph-basic/chartjs/code. Any spec id and library id listed in llms-full.txt fit the same URL shape; every URL below is complete and callable.
{
  "spec_id": "flamegraph-basic",
  "language": "javascript",
  "library": "chartjs",
  "page": "https://anyplot.ai/flamegraph-basic/javascript/chartjs",
  "hub": "https://anyplot.ai/flamegraph-basic",
  "code_json": "https://api.anyplot.ai/specs/flamegraph-basic/chartjs/code",
  "spec_json": "https://api.anyplot.ai/specs/flamegraph-basic",
  "render_light_png": "https://storage.googleapis.com/anyplot-images/plots/flamegraph-basic/javascript/chartjs/plot-light.png",
  "render_dark_png": "https://storage.googleapis.com/anyplot-images/plots/flamegraph-basic/javascript/chartjs/plot-dark.png",
  "interactive_light_html": "https://storage.googleapis.com/anyplot-images/plots/flamegraph-basic/javascript/chartjs/plot-light.html",
  "interactive_dark_html": "https://storage.googleapis.com/anyplot-images/plots/flamegraph-basic/javascript/chartjs/plot-dark.html",
  "quality_score": 93.0,
  "license": "MIT",
  "guide": "https://anyplot.ai/llms.txt"
}
Part of Flame Graph for Performance Profiling on anyplot.ai.