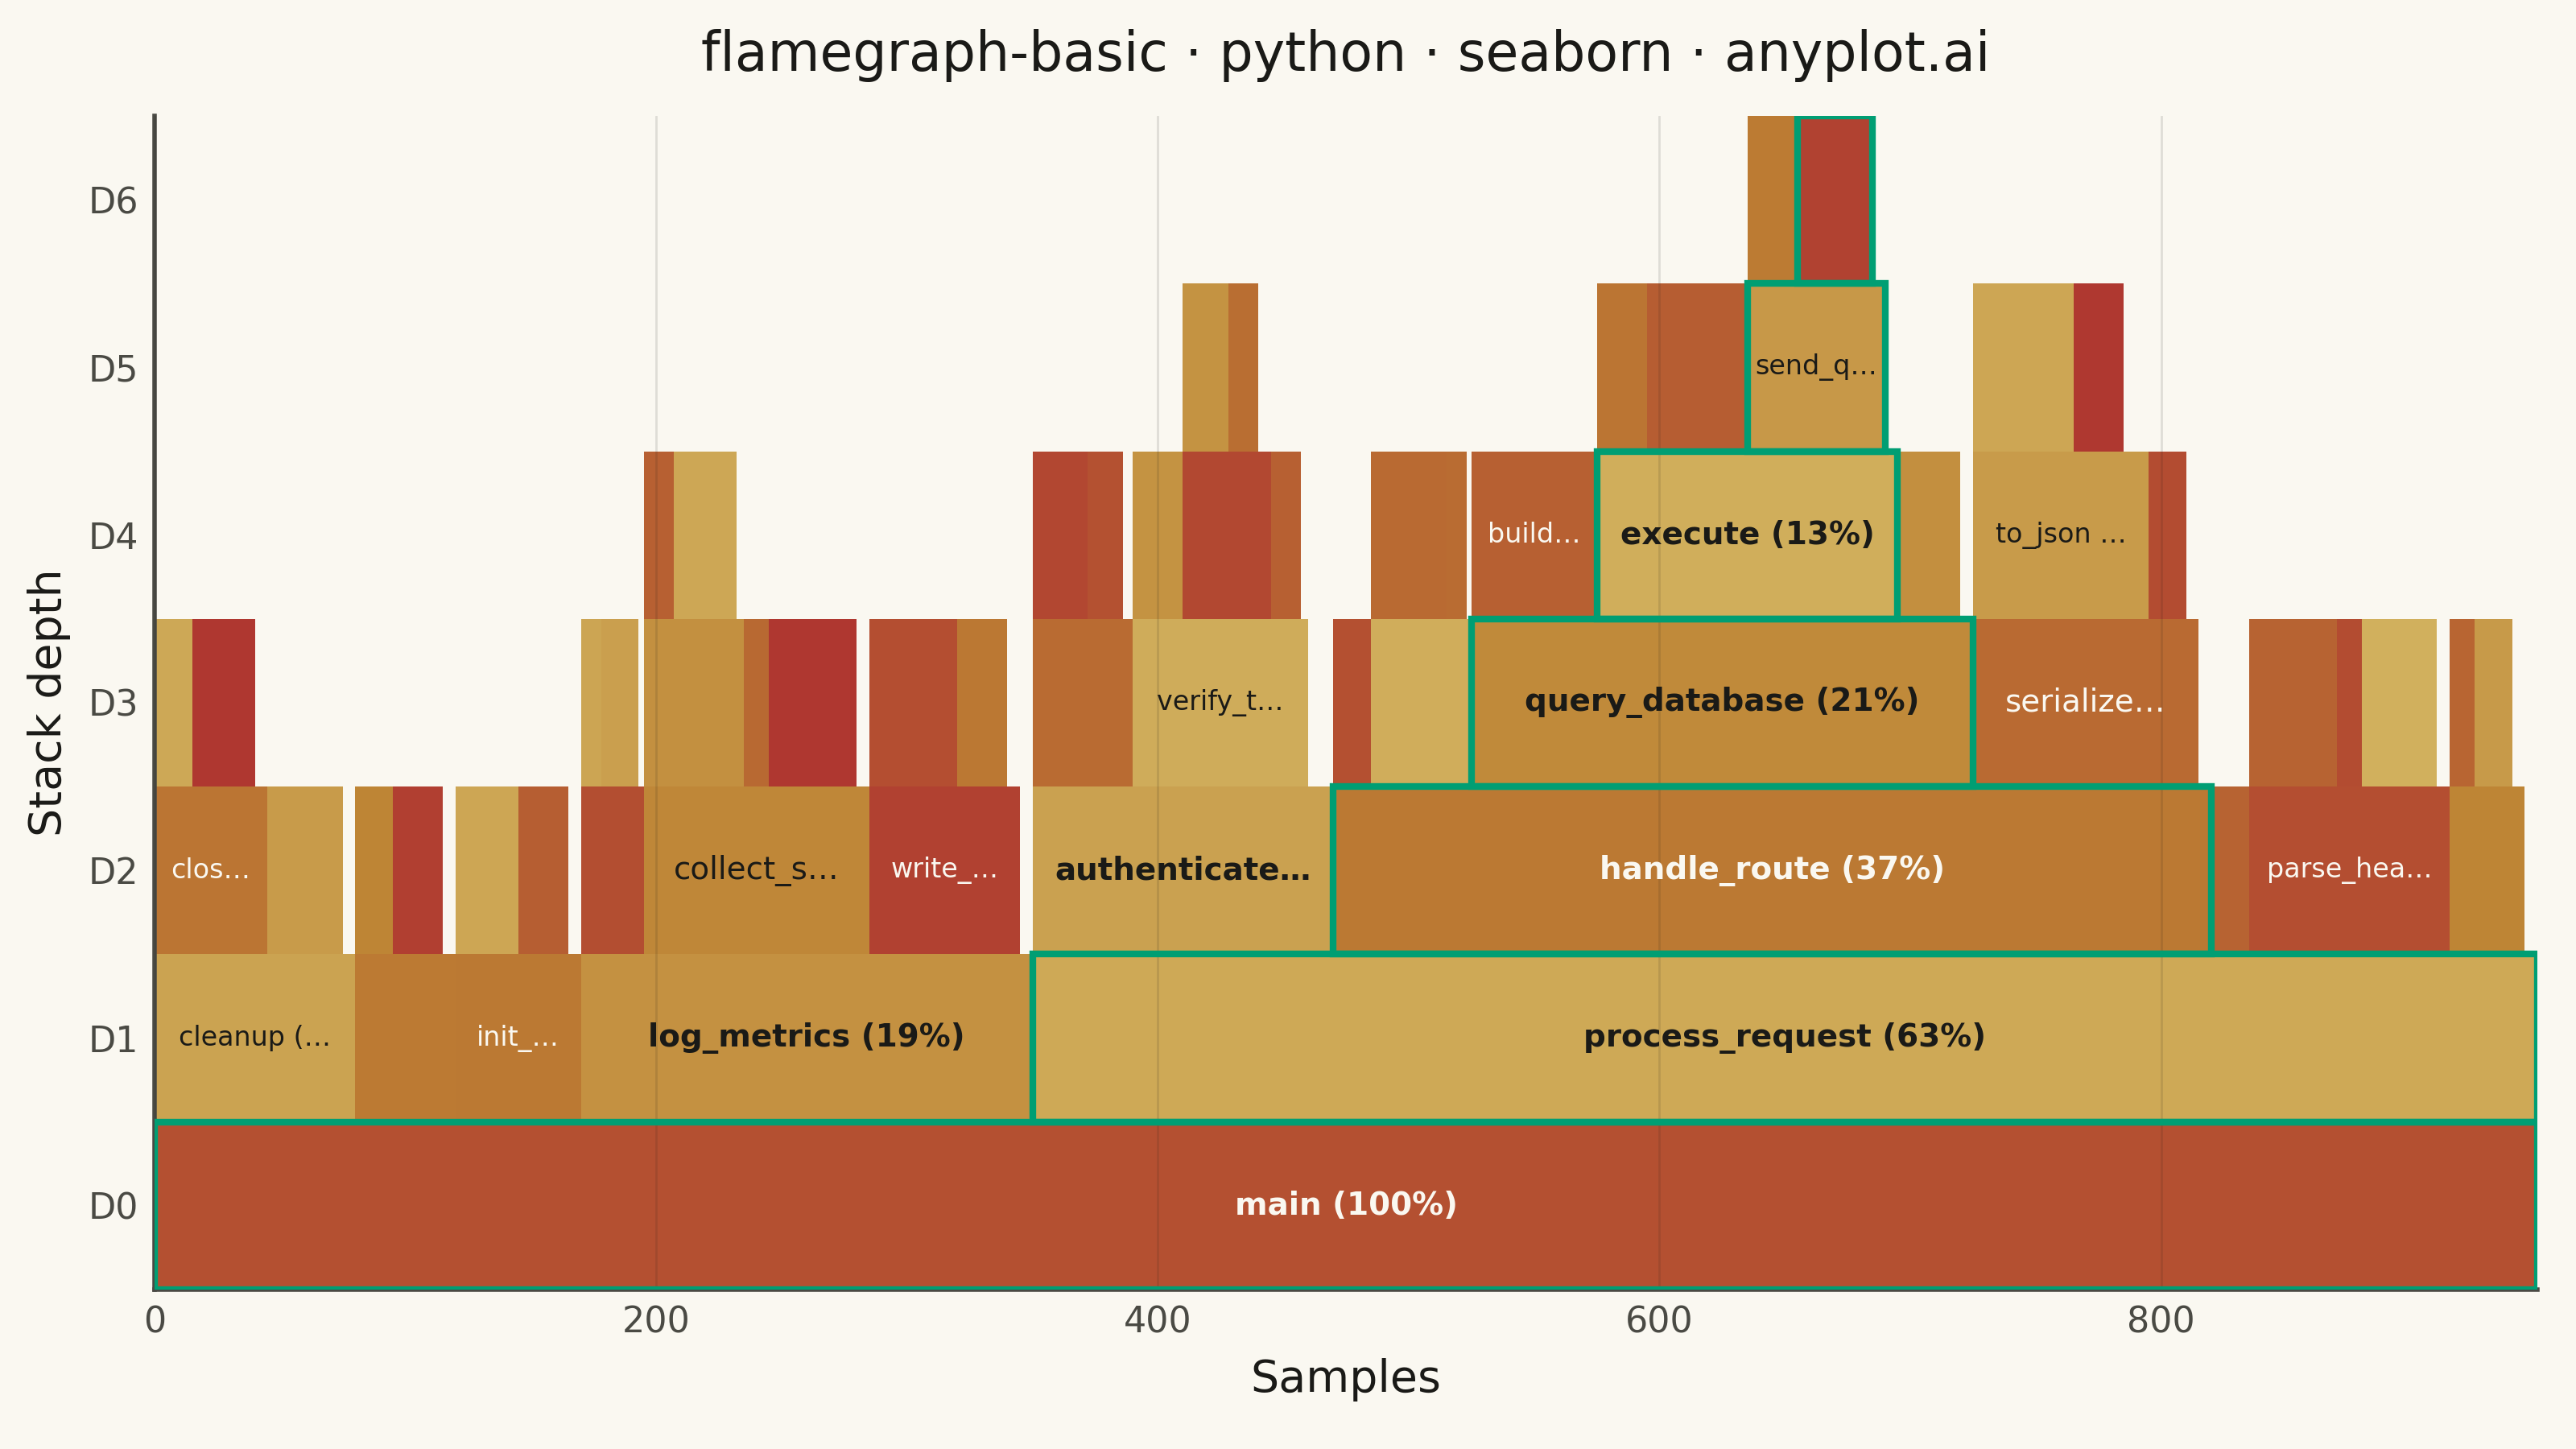
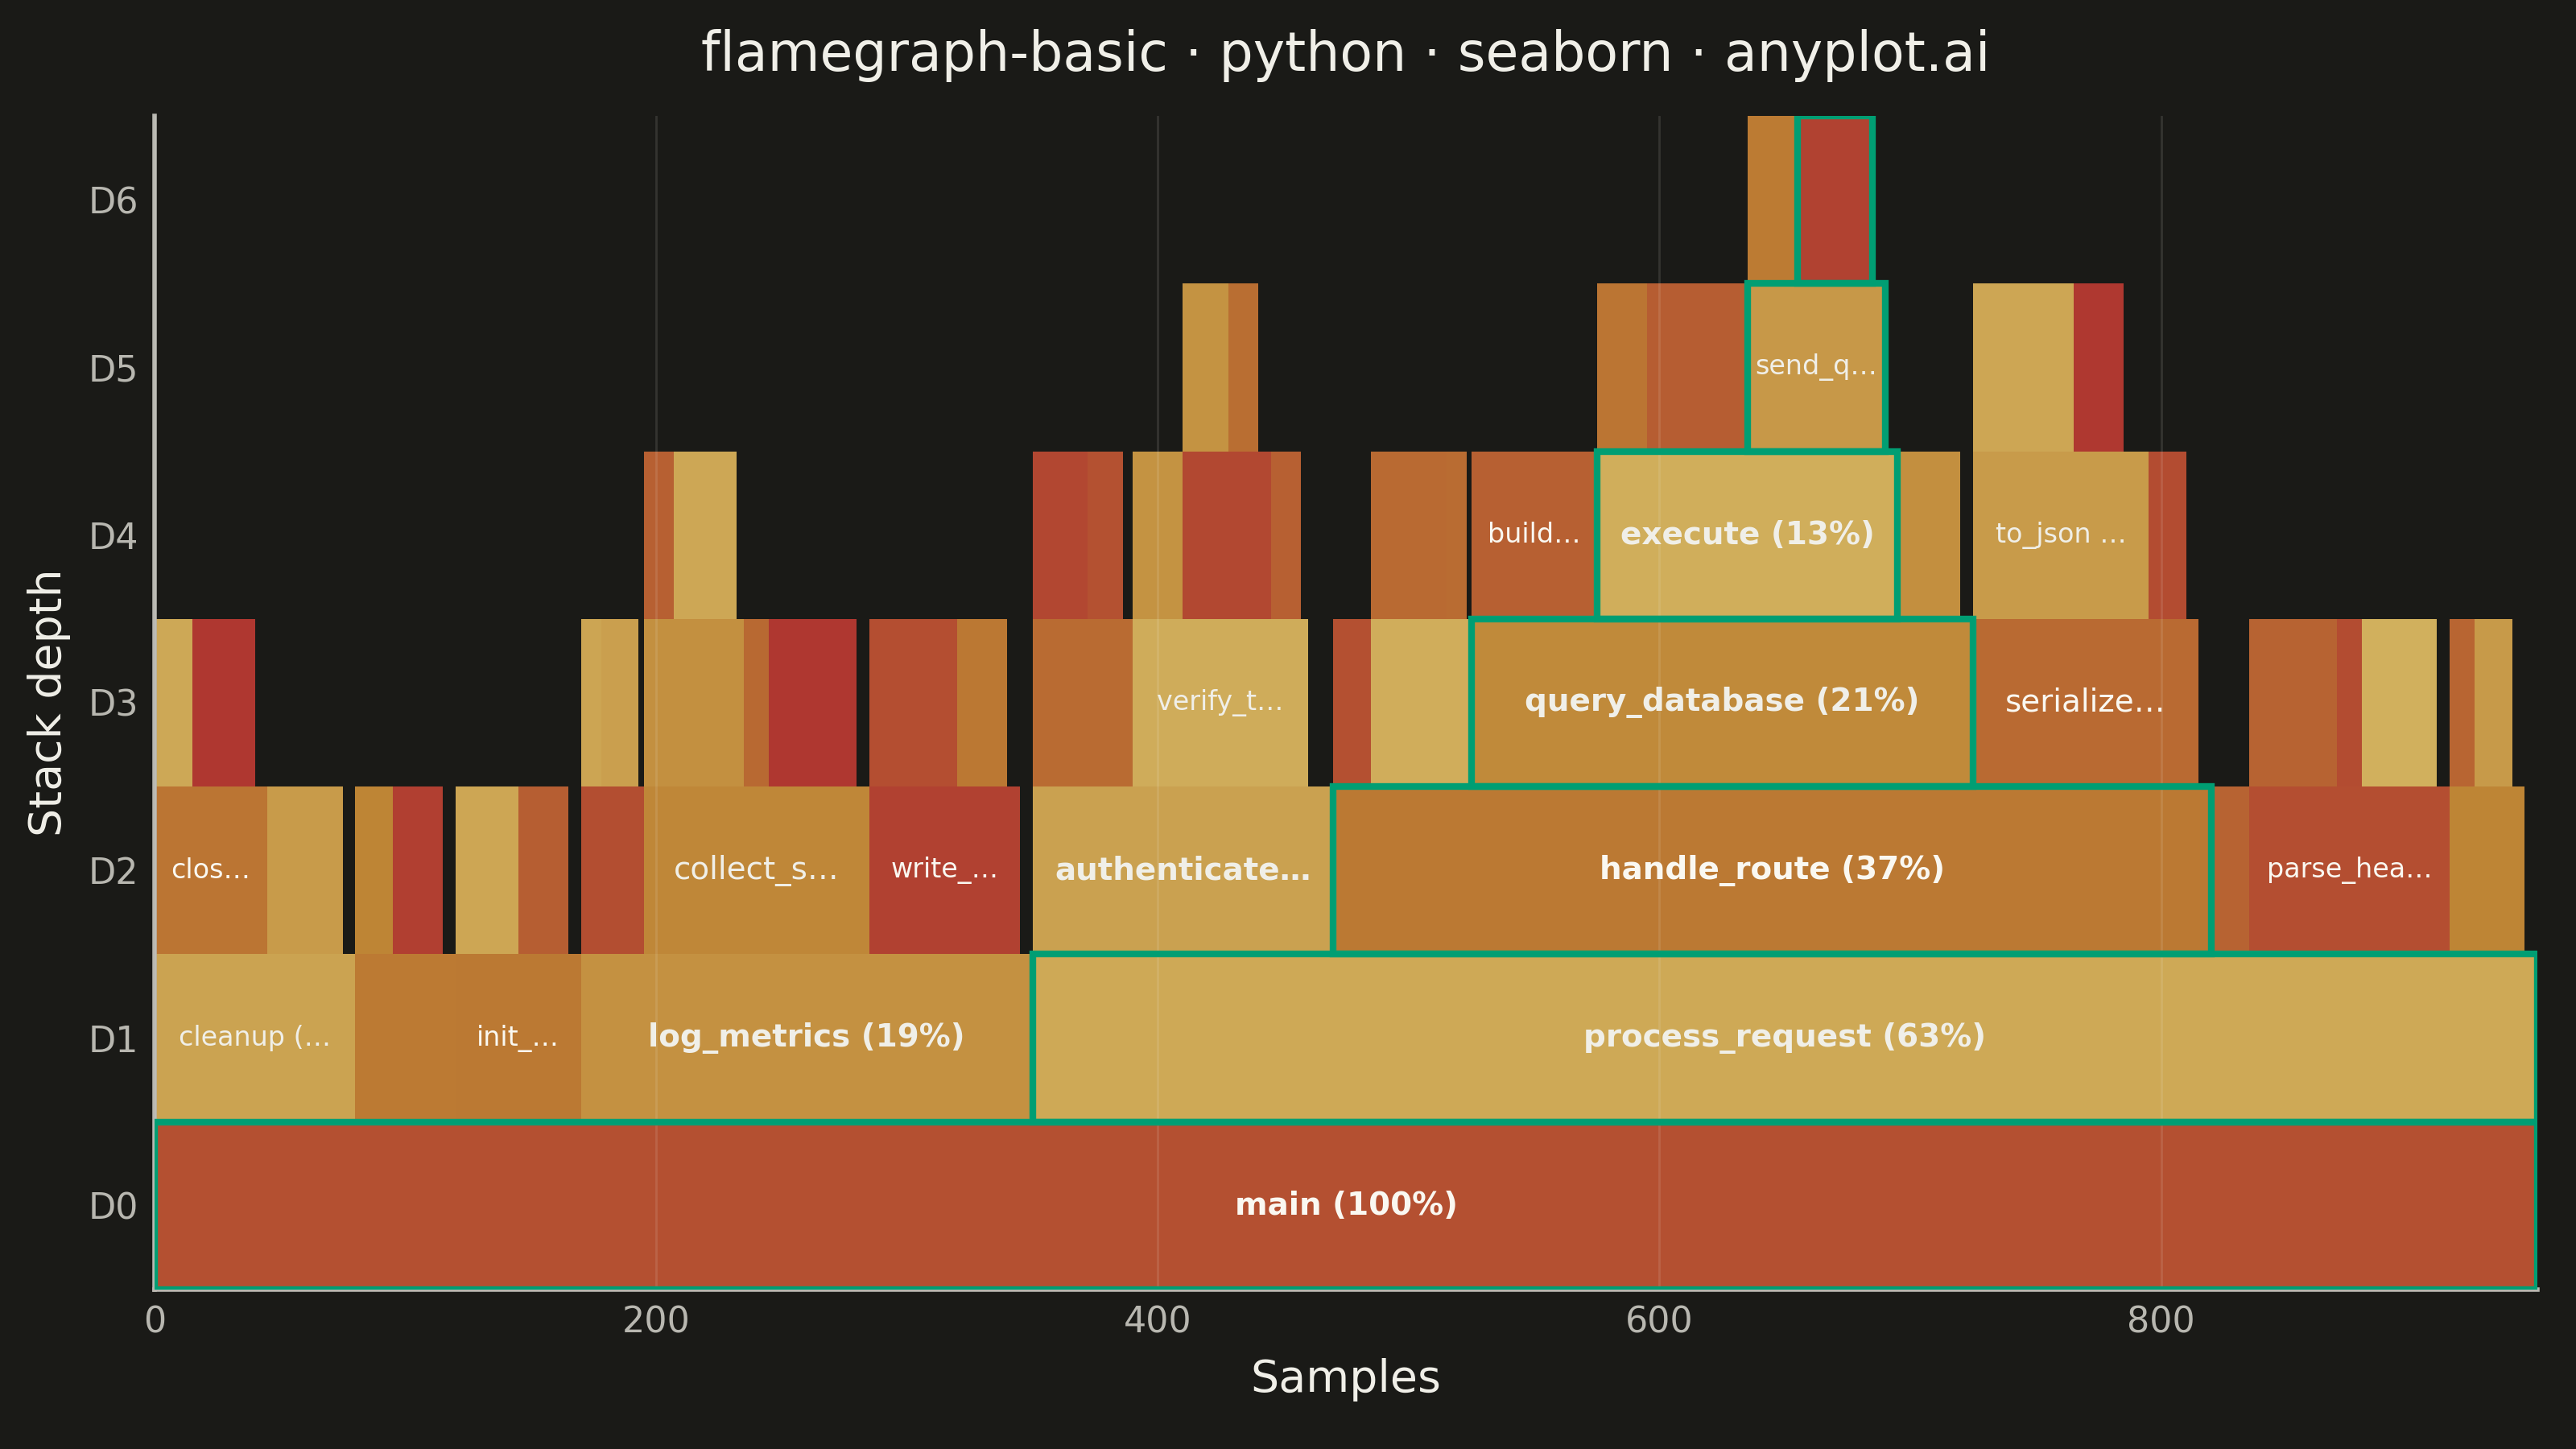
A flame graph visualizes hierarchical call stack data from performance profiling, where each horizontal bar represents a function in the call stack and its width is proportional to the time (or samples) spent in that function. Stacks are layered bottom-to-top showing caller-to-callee relationships. Invented by Brendan Gregg, flame graphs are the standard visualization for identifying CPU bottlenecks and hot code paths across all major programming languages and profiling tools.
""" anyplot.ai
flamegraph-basic: Flame Graph for Performance Profiling
Library: seaborn 0.13.2 | Python 3.13.13
Quality: 91/100 | Updated: 2026-06-08
"""

import hashlib
import os

import matplotlib.pyplot as plt
import numpy as np
import seaborn as sns
from matplotlib.patches import Rectangle


# Theme-adaptive chrome tokens
THEME = os.getenv("ANYPLOT_THEME", "light")
PAGE_BG = "#FAF8F1" if THEME == "light" else "#1A1A17"
ELEVATED_BG = "#FFFDF6" if THEME == "light" else "#242420"
INK = "#1A1A17" if THEME == "light" else "#F0EFE8"
INK_SOFT = "#4A4A44" if THEME == "light" else "#B8B7B0"
INK_MUTED = "#6B6A63" if THEME == "light" else "#A8A79F"

# Imprint palette warm anchors. Flame graphs use a warm palette by domain
# convention; staying inside the Imprint palette means picking its closest
# warm members rather than inventing custom hexes.
IMPRINT_AMBER = "#DDCC77"
IMPRINT_OCHRE = "#BD8233"
IMPRINT_RED = "#AE3030"

sns.set_theme(
    style="ticks",
    context="paper",
    rc={
        "figure.facecolor": PAGE_BG,
        "axes.facecolor": PAGE_BG,
        "axes.edgecolor": INK_SOFT,
        "axes.labelcolor": INK,
        "axes.titlecolor": INK,
        "text.color": INK,
        "xtick.color": INK_SOFT,
        "ytick.color": INK_SOFT,
        "grid.color": INK,
        "grid.alpha": 0.15,
        "legend.facecolor": ELEVATED_BG,
        "legend.edgecolor": INK_SOFT,
    },
)

# Warm flame colormap from Imprint warm anchors via seaborn.blend_palette —
# the seaborn-native way to build a perceptually smooth multi-stop gradient.
flame_cmap = sns.blend_palette([IMPRINT_AMBER, IMPRINT_OCHRE, IMPRINT_RED], n_colors=256, as_cmap=True)

# Simulated CPU profiling stacks — ~65 stack traces, 7 depth levels.
# Models a web-service request handler with realistic bottleneck patterns.
stacks = {
    "main": 950,
    "main;init_config": 50,
    "main;process_request": 600,
    "main;cleanup": 80,
    "main;log_metrics": 180,
    "main;health_check": 40,
    "main;init_config;load_env": 25,
    "main;init_config;parse_args": 20,
    "main;process_request;parse_headers": 80,
    "main;process_request;authenticate": 120,
    "main;process_request;handle_route": 350,
    "main;process_request;send_response": 30,
    "main;process_request;log_request": 15,
    "main;cleanup;close_connections": 45,
    "main;cleanup;flush_logs": 30,
    "main;log_metrics;collect_stats": 90,
    "main;log_metrics;write_to_disk": 60,
    "main;log_metrics;aggregate": 25,
    "main;health_check;ping_db": 20,
    "main;health_check;check_memory": 15,
    "main;process_request;parse_headers;decode_utf8": 35,
    "main;process_request;parse_headers;validate_content_type": 30,
    "main;process_request;parse_headers;extract_cookies": 10,
    "main;process_request;authenticate;verify_token": 70,
    "main;process_request;authenticate;check_permissions": 40,
    "main;process_request;handle_route;query_database": 200,
    "main;process_request;handle_route;serialize_response": 90,
    "main;process_request;handle_route;compress": 40,
    "main;process_request;handle_route;cache_lookup": 15,
    "main;process_request;send_response;write_headers": 15,
    "main;process_request;send_response;write_body": 10,
    "main;log_metrics;collect_stats;cpu_usage": 40,
    "main;log_metrics;collect_stats;mem_usage": 35,
    "main;log_metrics;collect_stats;disk_io": 10,
    "main;log_metrics;write_to_disk;buffer_flush": 35,
    "main;log_metrics;write_to_disk;fsync": 20,
    "main;log_metrics;aggregate;compute_p99": 15,
    "main;log_metrics;aggregate;compute_mean": 8,
    "main;cleanup;close_connections;tcp_shutdown": 25,
    "main;cleanup;close_connections;release_pool": 15,
    "main;process_request;authenticate;verify_token;decode_jwt": 35,
    "main;process_request;authenticate;verify_token;check_expiry": 20,
    "main;process_request;authenticate;verify_token;validate_sig": 12,
    "main;process_request;authenticate;check_permissions;load_acl": 22,
    "main;process_request;authenticate;check_permissions;match_role": 14,
    "main;process_request;handle_route;query_database;build_sql": 50,
    "main;process_request;handle_route;query_database;execute": 120,
    "main;process_request;handle_route;query_database;fetch_rows": 25,
    "main;process_request;handle_route;serialize_response;to_json": 70,
    "main;process_request;handle_route;serialize_response;validate_schema": 15,
    "main;process_request;handle_route;compress;gzip_encode": 30,
    "main;process_request;handle_route;compress;set_headers": 8,
    "main;log_metrics;collect_stats;cpu_usage;read_proc": 25,
    "main;log_metrics;collect_stats;cpu_usage;calc_percent": 12,
    "main;process_request;handle_route;query_database;execute;prepare_stmt": 40,
    "main;process_request;handle_route;query_database;execute;send_query": 55,
    "main;process_request;handle_route;query_database;execute;parse_result": 20,
    "main;process_request;handle_route;serialize_response;to_json;encode_fields": 40,
    "main;process_request;handle_route;serialize_response;to_json;format_dates": 20,
    "main;process_request;authenticate;verify_token;decode_jwt;base64_decode": 18,
    "main;process_request;authenticate;verify_token;decode_jwt;parse_claims": 12,
    "main;process_request;handle_route;query_database;execute;send_query;tcp_write": 30,
    "main;process_request;handle_route;query_database;execute;send_query;await_ack": 20,
}

total_samples = stacks["main"]

# Group frames by depth
frames = {}
for stack_path, samples in stacks.items():
    depth = stack_path.count(";")
    frames.setdefault(depth, []).append((stack_path, stack_path.split(";")[-1], samples))

# Lay out x-positions: each child sits inside its parent's span, siblings adjacent.
positions = {"main": (0, total_samples)}
for depth in sorted(frames):
    if depth == 0:
        continue
    children_by_parent = {}
    for stack_path, func_name, samples in frames[depth]:
        parent = ";".join(stack_path.split(";")[:-1])
        children_by_parent.setdefault(parent, []).append((stack_path, func_name, samples))
    for parent, children in children_by_parent.items():
        if parent not in positions:
            continue
        parent_x, _ = positions[parent]
        children.sort(key=lambda c: c[1])
        cursor = parent_x
        for stack_path, _func_name, samples in children:
            positions[stack_path] = (cursor, samples)
            cursor += samples

max_depth = max(frames)
n_rows = max_depth + 1

# Build a 2D grid as the heatmap substrate. Each sample → RES columns so adjacent
# bars share cell edges with no antialiased seam. Empty regions stay NaN + masked.
RES = 4
n_cols = total_samples * RES


def color_for(name):
    # hashlib so colors stay identical across PYTHONHASHSEED-randomised processes.
    h = int(hashlib.md5(name.encode()).hexdigest(), 16) & 0xFFFF
    return 0.18 + (h / 0xFFFF) * 0.78


grid = np.full((n_rows, n_cols), np.nan)
for stack_path, (x_pos, width) in positions.items():
    depth = stack_path.count(";")
    func_name = stack_path.split(";")[-1]
    grid[depth, int(x_pos * RES) : int((x_pos + width) * RES)] = color_for(func_name)

# Flip rows so depth 0 (root) renders at the bottom of the heatmap.
grid_display = grid[::-1]
mask = np.isnan(grid_display)

# Canvas — figsize × dpi → 3200 × 1800 px. No bbox_inches="tight" on save.
fig, ax = plt.subplots(figsize=(8, 4.5), dpi=400)

sns.heatmap(
    grid_display,
    ax=ax,
    cmap=flame_cmap,
    mask=mask,
    cbar=False,
    linewidths=0,
    xticklabels=False,
    yticklabels=False,
    vmin=0.0,
    vmax=1.0,
    rasterized=True,
)

# In-bar function-name labels. Bars below 0.045 fraction skip labels — at 400px
# web preview their truncated 5pt text was borderline and didn't add value.
for stack_path, (x_pos, width) in positions.items():
    fraction = width / total_samples
    if fraction <= 0.045:
        continue

    func_name = stack_path.split(";")[-1]
    pct = fraction * 100
    label = f"{func_name} ({pct:.0f}%)" if fraction > 0.07 else func_name

    fs = 7 if fraction > 0.09 else 6
    samples_per_char = {7: 9.0, 6: 7.6}[fs]
    max_chars = max(3, int(width / samples_per_char))
    if len(label) > max_chars:
        label = label[: max(3, max_chars - 1)] + "…"

    depth = stack_path.count(";")
    r, g, b = flame_cmap(color_for(func_name))[:3]
    luminance = 0.299 * r + 0.587 * g + 0.114 * b
    text_color = INK if luminance > 0.55 else "#FAF8F1"

    ax.text(
        (x_pos + width / 2) * RES,
        (max_depth - depth) + 0.5,
        label,
        ha="center",
        va="center",
        fontsize=fs,
        fontweight="semibold" if fraction > 0.12 else "regular",
        color=text_color,
        clip_on=True,
        zorder=5,
    )

# Brand-green outline on the hot path (greatest-width child from root to leaf) —
# gives the eye an obvious bottleneck focal point at a glance.
HOT_GREEN = "#009E73"
hot_path = ["main"]
current = "main"
while True:
    candidates = [
        (p, w)
        for p, (_, w) in positions.items()
        if p.startswith(current + ";") and p.count(";") == current.count(";") + 1
    ]
    if not candidates:
        break
    current = max(candidates, key=lambda c: c[1])[0]
    hot_path.append(current)

for stack_path in hot_path:
    x_pos, width = positions[stack_path]
    depth = stack_path.count(";")
    ax.add_patch(
        Rectangle(
            (x_pos * RES, max_depth - depth),
            width * RES,
            1,
            fill=False,
            edgecolor=HOT_GREEN,
            linewidth=1.5,
            zorder=4,
            clip_on=True,
        )
    )

# Axes
ax.set_xlabel("Samples", fontsize=10)
ax.set_ylabel("Stack depth", fontsize=10)
ax.set_title("flamegraph-basic · python · seaborn · anyplot.ai", fontsize=12, fontweight="medium", pad=10)
ax.tick_params(axis="both", labelsize=8, length=0)

ax.set_yticks([i + 0.5 for i in range(n_rows)])
ax.set_yticklabels([f"D{d}" for d in range(max_depth, -1, -1)])

xtick_positions = np.arange(0, total_samples + 1, 200)
ax.set_xticks(xtick_positions * RES)
ax.set_xticklabels([str(int(x)) for x in xtick_positions])

# Heatmap forces all spines on; remove top & right per default style.
sns.despine(ax=ax, top=True, right=True)
ax.spines["left"].set_color(INK_SOFT)
ax.spines["bottom"].set_color(INK_SOFT)

# Subtle vertical guides only — horizontal grid would fight the stacked bars.
ax.xaxis.grid(True, alpha=0.12, linewidth=0.5, color=INK)
ax.yaxis.grid(False)
ax.set_axisbelow(False)

# Pad margins via subplots_adjust — tight_layout/bbox_inches='tight' would
# shave the canvas off-target and fail the post-render size gate.
fig.subplots_adjust(left=0.06, right=0.985, top=0.92, bottom=0.11)

plt.savefig(f"plot-{THEME}.png", dpi=400, facecolor=PAGE_BG)
Runnable source as JSON, for any HTTP client: https://api.anyplot.ai/specs/flamegraph-basic/seaborn/code. Any spec id and library id listed in llms-full.txt fit the same URL shape; every URL below is complete and callable.
{
  "spec_id": "flamegraph-basic",
  "language": "python",
  "library": "seaborn",
  "page": "https://anyplot.ai/flamegraph-basic/python/seaborn",
  "hub": "https://anyplot.ai/flamegraph-basic",
  "code_json": "https://api.anyplot.ai/specs/flamegraph-basic/seaborn/code",
  "spec_json": "https://api.anyplot.ai/specs/flamegraph-basic",
  "render_light_png": "https://storage.googleapis.com/anyplot-images/plots/flamegraph-basic/python/seaborn/plot-light.png",
  "render_dark_png": "https://storage.googleapis.com/anyplot-images/plots/flamegraph-basic/python/seaborn/plot-dark.png",
  "quality_score": 91.0,
  "license": "MIT",
  "guide": "https://anyplot.ai/llms.txt"
}
Part of Flame Graph for Performance Profiling on anyplot.ai.