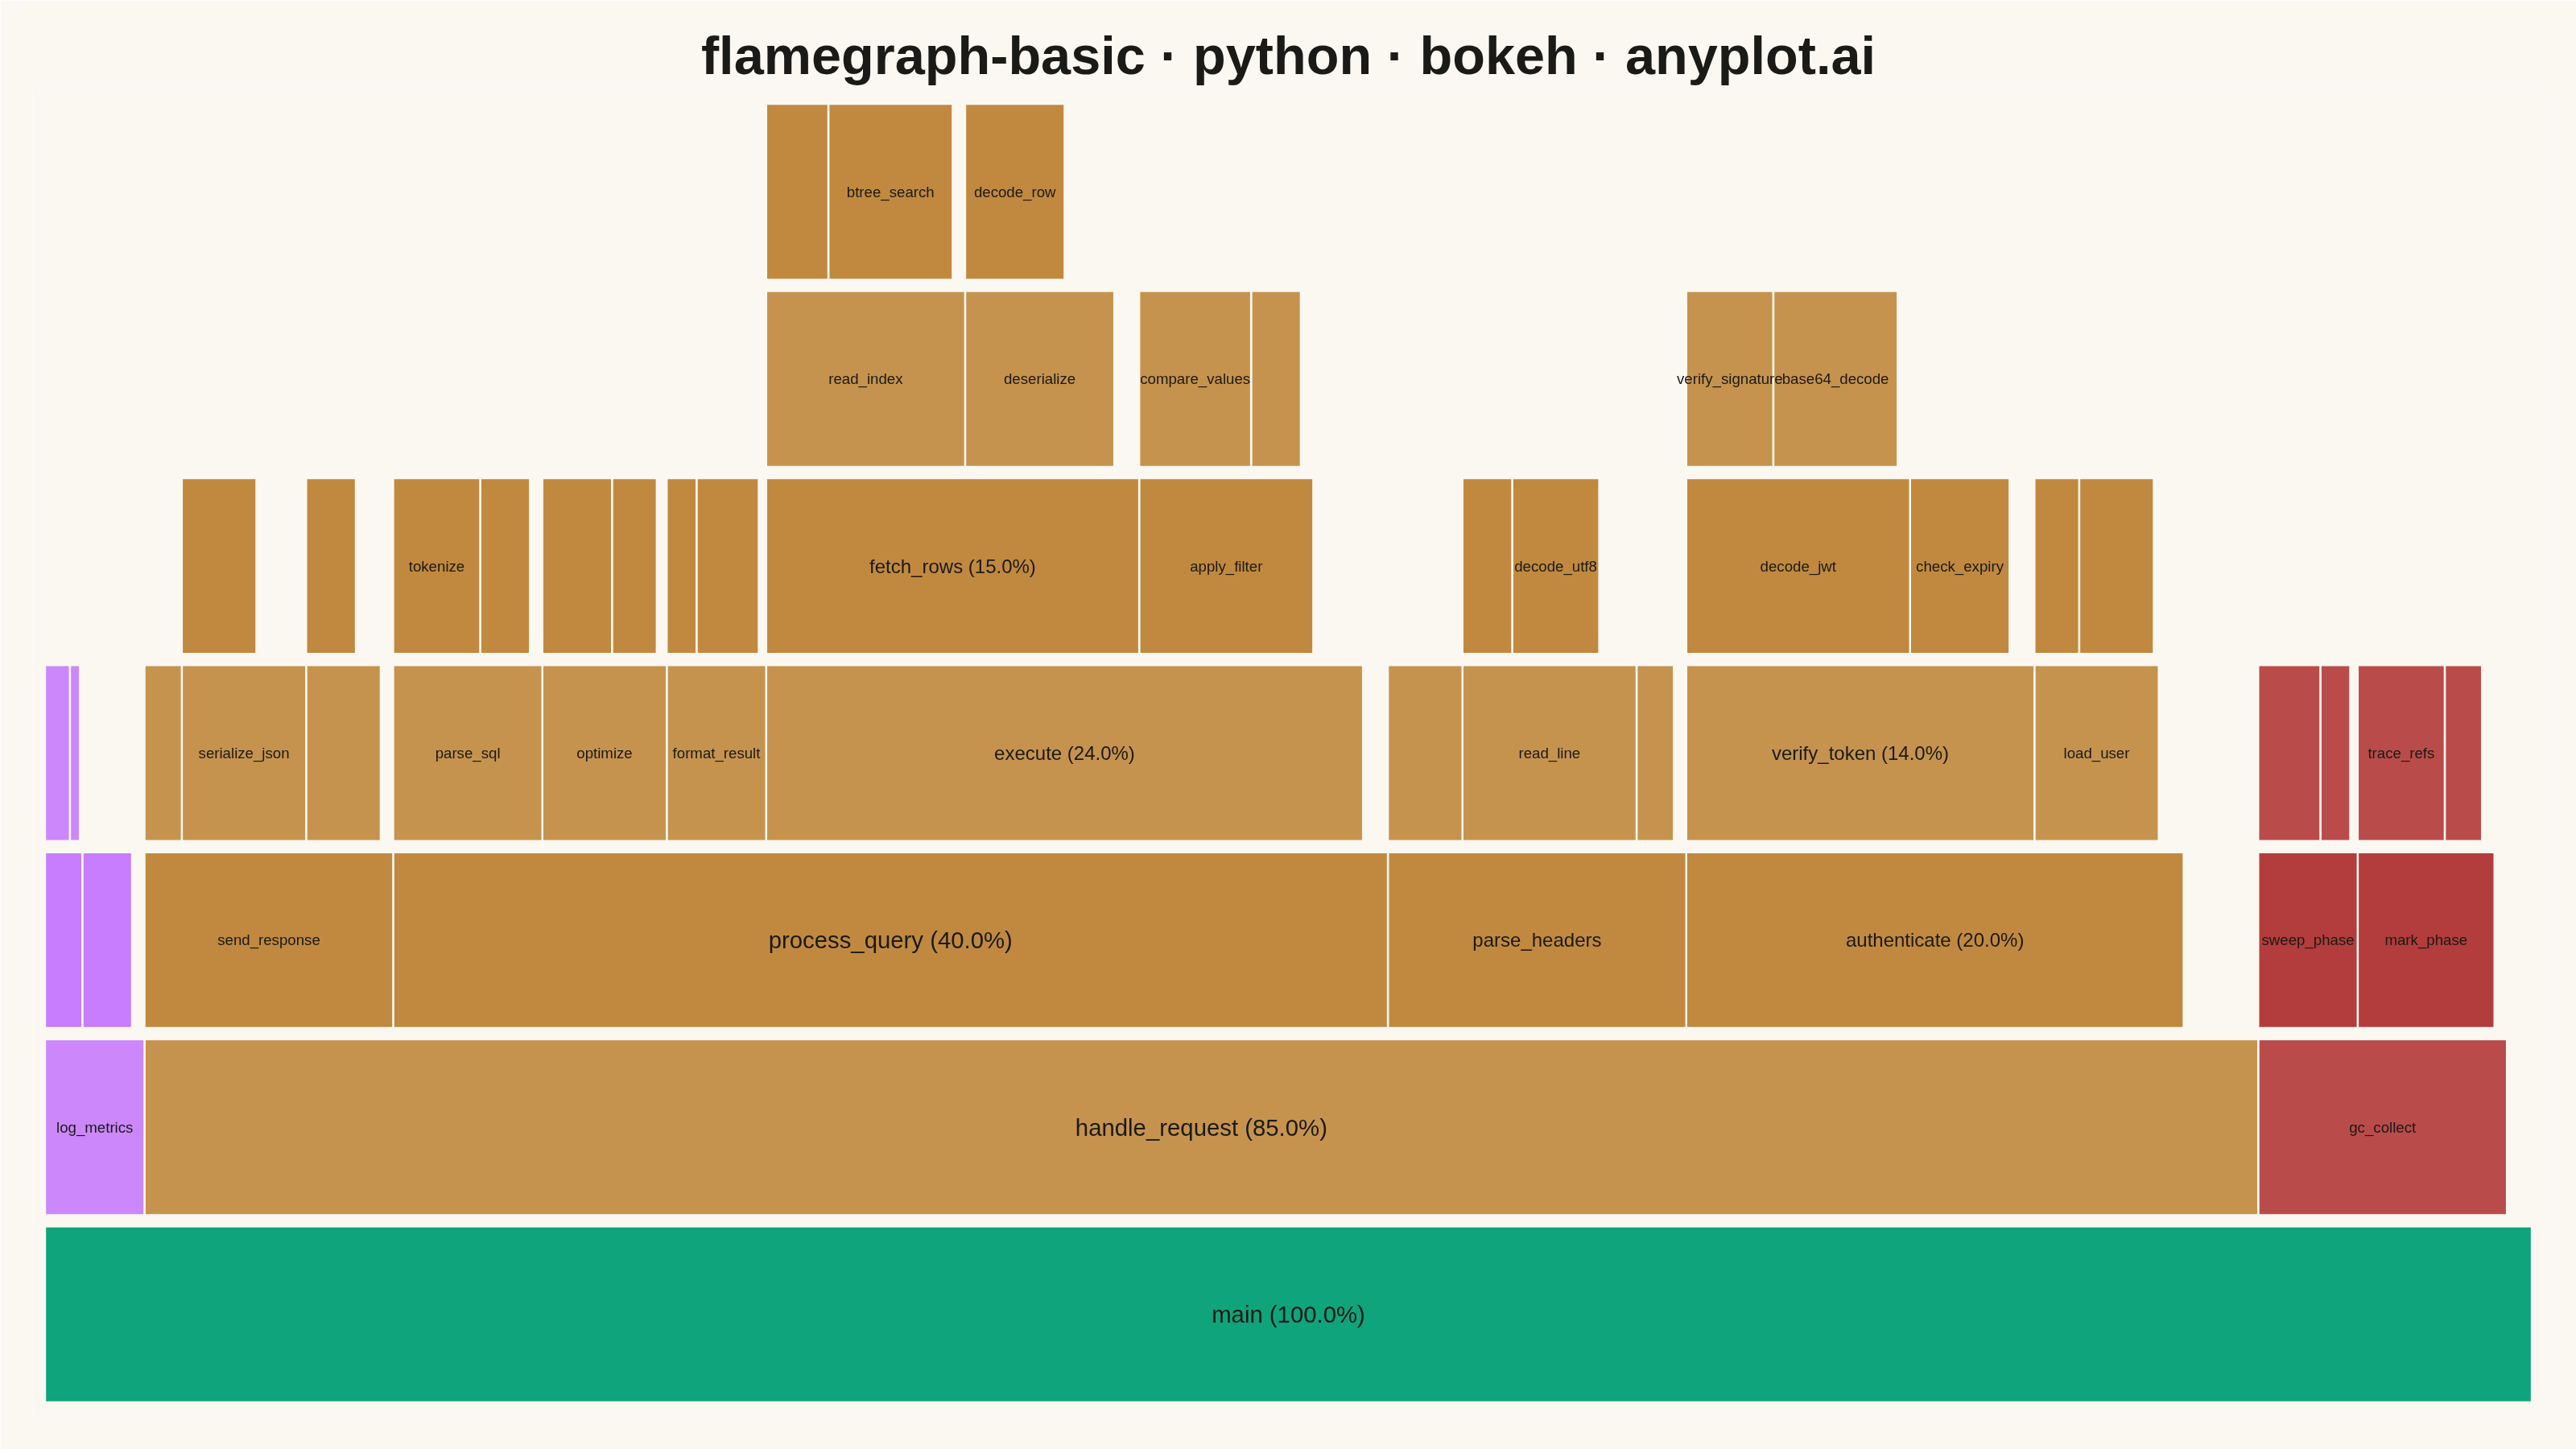
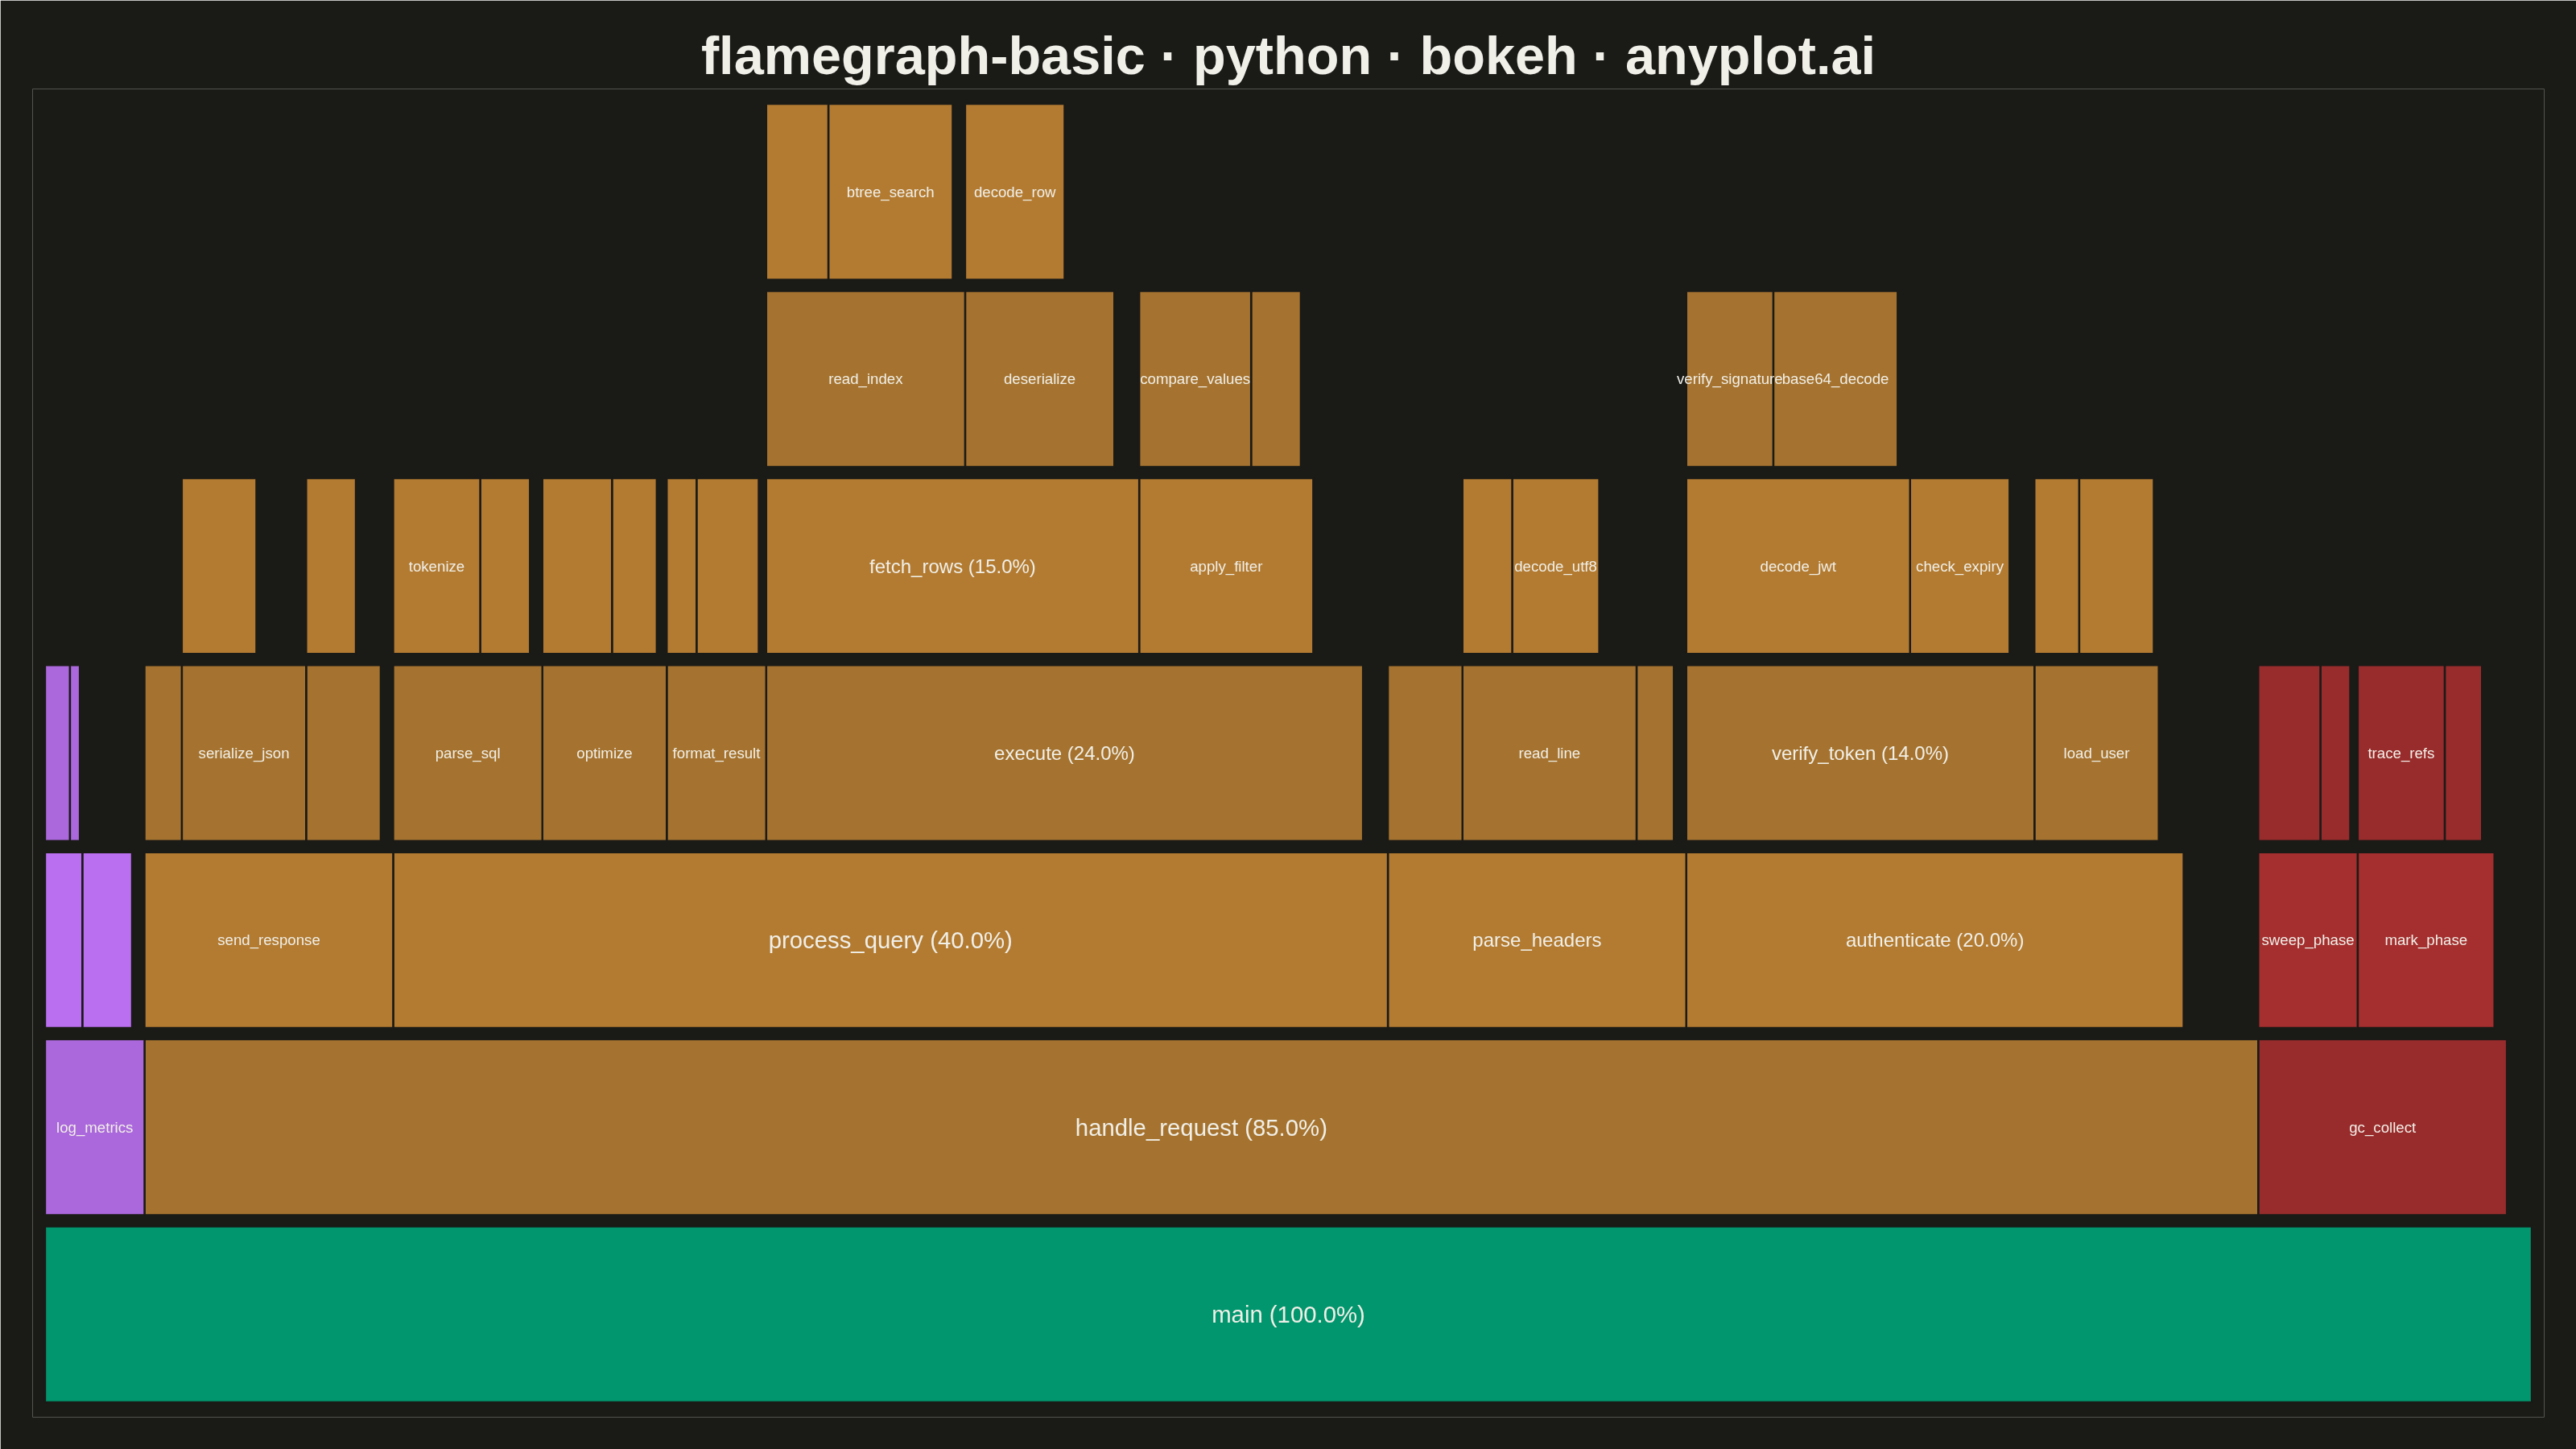
A flame graph visualizes hierarchical call stack data from performance profiling, where each horizontal bar represents a function in the call stack and its width is proportional to the time (or samples) spent in that function. Stacks are layered bottom-to-top showing caller-to-callee relationships. Invented by Brendan Gregg, flame graphs are the standard visualization for identifying CPU bottlenecks and hot code paths across all major programming languages and profiling tools.
""" anyplot.ai
flamegraph-basic: Flame Graph for Performance Profiling
Library: bokeh 3.9.1 | Python 3.13.13
Quality: 85/100 | Updated: 2026-06-08
"""

import os
import time
from pathlib import Path

from bokeh.io import output_file, save
from bokeh.models import ColumnDataSource, HoverTool, Label
from bokeh.plotting import figure
from selenium import webdriver
from selenium.webdriver.chrome.options import Options


# Theme tokens (Imprint palette + theme-adaptive chrome)
THEME = os.getenv("ANYPLOT_THEME", "light")
PAGE_BG = "#FAF8F1" if THEME == "light" else "#1A1A17"
INK = "#1A1A17" if THEME == "light" else "#F0EFE8"
INK_SOFT = "#4A4A44" if THEME == "light" else "#B8B7B0"

# Imprint hues assigned by top-level branch — flame-graph convention is to color
# by code area (not by sample heat), so each subtree gets a stable categorical hue.
# main is the brand-first root; ochre + matte-red lean into the warm flame-graph
# aesthetic from the spec while staying on canonical Imprint positions.
BRANCH_COLOR = {
    "main": "#009E73",  # brand — root frame
    "handle_request": "#BD8233",  # ochre — request handling
    "gc_collect": "#AE3030",  # matte red — garbage collection
    "log_metrics": "#C475FD",  # lavender — logging / metrics
}

# Data — simulated CPU profile of a small web server (10,000 samples)
stack_data = [
    ("main", 10000),
    ("main;handle_request", 8500),
    ("main;handle_request;parse_headers", 1200),
    ("main;handle_request;parse_headers;read_line", 700),
    ("main;handle_request;parse_headers;read_line;decode_utf8", 350),
    ("main;handle_request;parse_headers;read_line;strip_whitespace", 200),
    ("main;handle_request;parse_headers;validate_content_type", 300),
    ("main;handle_request;parse_headers;parse_cookies", 150),
    ("main;handle_request;authenticate", 2000),
    ("main;handle_request;authenticate;verify_token", 1400),
    ("main;handle_request;authenticate;verify_token;decode_jwt", 900),
    ("main;handle_request;authenticate;verify_token;decode_jwt;base64_decode", 500),
    ("main;handle_request;authenticate;verify_token;decode_jwt;verify_signature", 350),
    ("main;handle_request;authenticate;verify_token;check_expiry", 400),
    ("main;handle_request;authenticate;load_user", 500),
    ("main;handle_request;authenticate;load_user;query_cache", 300),
    ("main;handle_request;authenticate;load_user;query_db", 180),
    ("main;handle_request;process_query", 4000),
    ("main;handle_request;process_query;parse_sql", 600),
    ("main;handle_request;process_query;parse_sql;tokenize", 350),
    ("main;handle_request;process_query;parse_sql;build_ast", 200),
    ("main;handle_request;process_query;optimize", 500),
    ("main;handle_request;process_query;optimize;rewrite_joins", 280),
    ("main;handle_request;process_query;optimize;estimate_cost", 180),
    ("main;handle_request;process_query;execute", 2400),
    ("main;handle_request;process_query;execute;fetch_rows", 1500),
    ("main;handle_request;process_query;execute;fetch_rows;read_index", 800),
    ("main;handle_request;process_query;execute;fetch_rows;read_index;btree_search", 500),
    ("main;handle_request;process_query;execute;fetch_rows;read_index;page_read", 250),
    ("main;handle_request;process_query;execute;fetch_rows;deserialize", 600),
    ("main;handle_request;process_query;execute;fetch_rows;deserialize;decode_row", 400),
    ("main;handle_request;process_query;execute;apply_filter", 700),
    ("main;handle_request;process_query;execute;apply_filter;compare_values", 450),
    ("main;handle_request;process_query;execute;apply_filter;check_null", 200),
    ("main;handle_request;process_query;format_result", 400),
    ("main;handle_request;process_query;format_result;build_json", 250),
    ("main;handle_request;process_query;format_result;paginate", 120),
    ("main;handle_request;send_response", 1000),
    ("main;handle_request;send_response;serialize_json", 500),
    ("main;handle_request;send_response;serialize_json;encode_utf8", 300),
    ("main;handle_request;send_response;compress", 300),
    ("main;handle_request;send_response;compress;deflate", 200),
    ("main;handle_request;send_response;write_socket", 150),
    ("main;gc_collect", 1000),
    ("main;gc_collect;mark_phase", 550),
    ("main;gc_collect;mark_phase;trace_refs", 350),
    ("main;gc_collect;mark_phase;check_weak_refs", 150),
    ("main;gc_collect;sweep_phase", 400),
    ("main;gc_collect;sweep_phase;free_objects", 250),
    ("main;gc_collect;sweep_phase;compact_heap", 120),
    ("main;log_metrics", 400),
    ("main;log_metrics;collect_counters", 200),
    ("main;log_metrics;flush_buffer", 150),
    ("main;log_metrics;flush_buffer;write_file", 100),
    ("main;log_metrics;flush_buffer;rotate_log", 40),
]

# Build hierarchy from semicolon-delimited stacks
total_samples = 10000
nodes = {}
children_map = {}
for stack_str, samples in stack_data:
    parts = stack_str.split(";")
    depth = len(parts) - 1
    parent_key = ";".join(parts[:-1]) if depth > 0 else None
    branch = parts[1] if depth >= 1 else "main"
    nodes[stack_str] = {"name": parts[-1], "samples": samples, "depth": depth, "branch": branch}
    children_map.setdefault(parent_key, []).append(stack_str)

max_depth = max(n["depth"] for n in nodes.values())

# Dominant hot-path chain — gets an INK outline to point readers at the bottleneck.
HOT_PATH = {
    "main",
    "main;handle_request",
    "main;handle_request;process_query",
    "main;handle_request;process_query;execute",
    "main;handle_request;process_query;execute;fetch_rows",
}

# Layout — iterative DFS placing each child proportional to its sample share.
# Sibling order is alphabetical (flame-graph convention; x-axis is not temporal).
rects = []
work_stack = [("main", 0.0, 100.0)]
while work_stack:
    stack_key, x_start, x_end = work_stack.pop()
    node = nodes[stack_key]
    rect_w = x_end - x_start
    pct = node["samples"] / total_samples * 100
    # Subtle parity-based alpha gives adjacent frames a faint banding cue
    fill_alpha = 0.94 if node["depth"] % 2 == 0 else 0.86
    is_hot = stack_key in HOT_PATH
    rects.append(
        {
            "name": node["name"],
            "depth": node["depth"],
            "x_center": (x_start + x_end) / 2,
            "y_center": node["depth"] + 0.5,
            "width": rect_w,
            "color": BRANCH_COLOR[node["branch"]],
            "fill_alpha": fill_alpha,
            "line_color": INK if is_hot else PAGE_BG,
            "line_width": 4.0 if is_hot else 1.5,
            "samples": node["samples"],
            "pct": f"{pct:.1f}%",
            "stack": stack_key,
        }
    )
    child_keys = sorted(children_map.get(stack_key, []), reverse=True)
    current_x = x_start
    for ck in child_keys:
        cw = rect_w * (nodes[ck]["samples"] / node["samples"])
        work_stack.append((ck, current_x, current_x + cw))
        current_x += cw

source = ColumnDataSource(
    data={
        "x": [r["x_center"] for r in rects],
        "y": [r["y_center"] for r in rects],
        "width": [r["width"] for r in rects],
        "height": [0.94] * len(rects),
        "color": [r["color"] for r in rects],
        "fill_alpha": [r["fill_alpha"] for r in rects],
        "line_color": [r["line_color"] for r in rects],
        "line_width": [r["line_width"] for r in rects],
        "name": [r["name"] for r in rects],
        "samples": [r["samples"] for r in rects],
        "pct": [r["pct"] for r in rects],
        "stack": [r["stack"] for r in rects],
    }
)

# Plot — landscape canvas, axes hidden (flame-graph convention)
title = "flamegraph-basic · python · bokeh · anyplot.ai"
p = figure(
    width=3200,
    height=1800,
    title=title,
    x_range=(-0.5, 100.5),
    y_range=(-0.05, max_depth + 1.05),
    tools="",
    toolbar_location=None,
    min_border_left=40,
    min_border_right=40,
    min_border_top=110,
    min_border_bottom=40,
)

bars = p.rect(
    x="x",
    y="y",
    width="width",
    height="height",
    source=source,
    fill_color="color",
    fill_alpha="fill_alpha",
    line_color="line_color",
    line_width="line_width",
)

# HoverTool — bokeh's distinctive interactive feature, surfaces the full call stack
hover = HoverTool(
    renderers=[bars],
    tooltips=[("Function", "@name"), ("Samples", "@samples"), ("CPU %", "@pct"), ("Call Stack", "@stack")],
    point_policy="follow_mouse",
)
p.add_tools(hover)

# Function-name labels drawn inside bars wide enough to fit them.
# Narrower frames fall back to the HoverTool — keeps adjacent labels from touching.
for r in rects:
    if r["width"] <= 5:
        continue
    if r["width"] > 25:
        font_size = "22pt"
    elif r["width"] > 10:
        font_size = "18pt"
    else:
        font_size = "14pt"
    label_text = f"{r['name']} ({r['pct']})" if r["width"] > 12 else r["name"]
    p.add_layout(
        Label(
            x=r["x_center"],
            y=r["y_center"],
            text=label_text,
            text_align="center",
            text_baseline="middle",
            text_font_size=font_size,
            text_color=INK,
        )
    )

# Style — chrome (axes hidden, theme-adaptive title + background)
p.title.text_font_size = "50pt"
p.title.text_color = INK
p.title.text_font_style = "bold"
p.title.align = "center"

p.xaxis.visible = False
p.yaxis.visible = False
p.xgrid.visible = False
p.ygrid.visible = False
p.outline_line_color = None
p.background_fill_color = PAGE_BG
p.border_fill_color = PAGE_BG

# Save — interactive HTML + headless-Chrome screenshot at exact canvas size.
# CDP setDeviceMetricsOverride makes the inner viewport authoritative — --window-size
# alone leaves Chrome chrome eating ~140 px, yielding 3200x1661 instead of 3200x1800.
output_file(f"plot-{THEME}.html")
save(p)

W, H = 3200, 1800
opts = Options()
for arg in (
    "--headless=new",
    "--no-sandbox",
    "--disable-dev-shm-usage",
    "--disable-gpu",
    f"--window-size={W},{H}",
    "--hide-scrollbars",
):
    opts.add_argument(arg)
driver = webdriver.Chrome(options=opts)
driver.execute_cdp_cmd(
    "Emulation.setDeviceMetricsOverride", {"width": W, "height": H, "deviceScaleFactor": 1, "mobile": False}
)
driver.get(f"file://{Path(f'plot-{THEME}.html').resolve()}")
time.sleep(3)
driver.save_screenshot(f"plot-{THEME}.png")
driver.quit()

# Belt-and-braces: pin the saved PNG to exact dims so the post-render gate passes.
from PIL import Image as _PILImage


_img = _PILImage.open(f"plot-{THEME}.png").convert("RGB")
if _img.size != (W, H):
    _norm = _PILImage.new("RGB", (W, H), PAGE_BG)
    _norm.paste(_img, ((W - _img.size[0]) // 2, (H - _img.size[1]) // 2))
    _norm.save(f"plot-{THEME}.png")
Runnable source as JSON, for any HTTP client: https://api.anyplot.ai/specs/flamegraph-basic/bokeh/code. Any spec id and library id listed in llms-full.txt fit the same URL shape; every URL below is complete and callable.
{
  "spec_id": "flamegraph-basic",
  "language": "python",
  "library": "bokeh",
  "page": "https://anyplot.ai/flamegraph-basic/python/bokeh",
  "hub": "https://anyplot.ai/flamegraph-basic",
  "code_json": "https://api.anyplot.ai/specs/flamegraph-basic/bokeh/code",
  "spec_json": "https://api.anyplot.ai/specs/flamegraph-basic",
  "render_light_png": "https://storage.googleapis.com/anyplot-images/plots/flamegraph-basic/python/bokeh/plot-light.png",
  "render_dark_png": "https://storage.googleapis.com/anyplot-images/plots/flamegraph-basic/python/bokeh/plot-dark.png",
  "interactive_light_html": "https://storage.googleapis.com/anyplot-images/plots/flamegraph-basic/python/bokeh/plot-light.html",
  "interactive_dark_html": "https://storage.googleapis.com/anyplot-images/plots/flamegraph-basic/python/bokeh/plot-dark.html",
  "quality_score": 85.0,
  "license": "MIT",
  "guide": "https://anyplot.ai/llms.txt"
}
Part of Flame Graph for Performance Profiling on anyplot.ai.