The same plot in 14 other libraries — JavaScript: Chart.js, D3.js, Highcharts, MUI X Charts; Python: Altair, Bokeh, lets-plot, Matplotlib, Plotly, plotnine, Pygal, Seaborn; R: ggplot2; Julia: Makie.jl. Compare all 15 side by side: Flame Graph for Performance Profiling in Python, R, Julia and JavaScript.
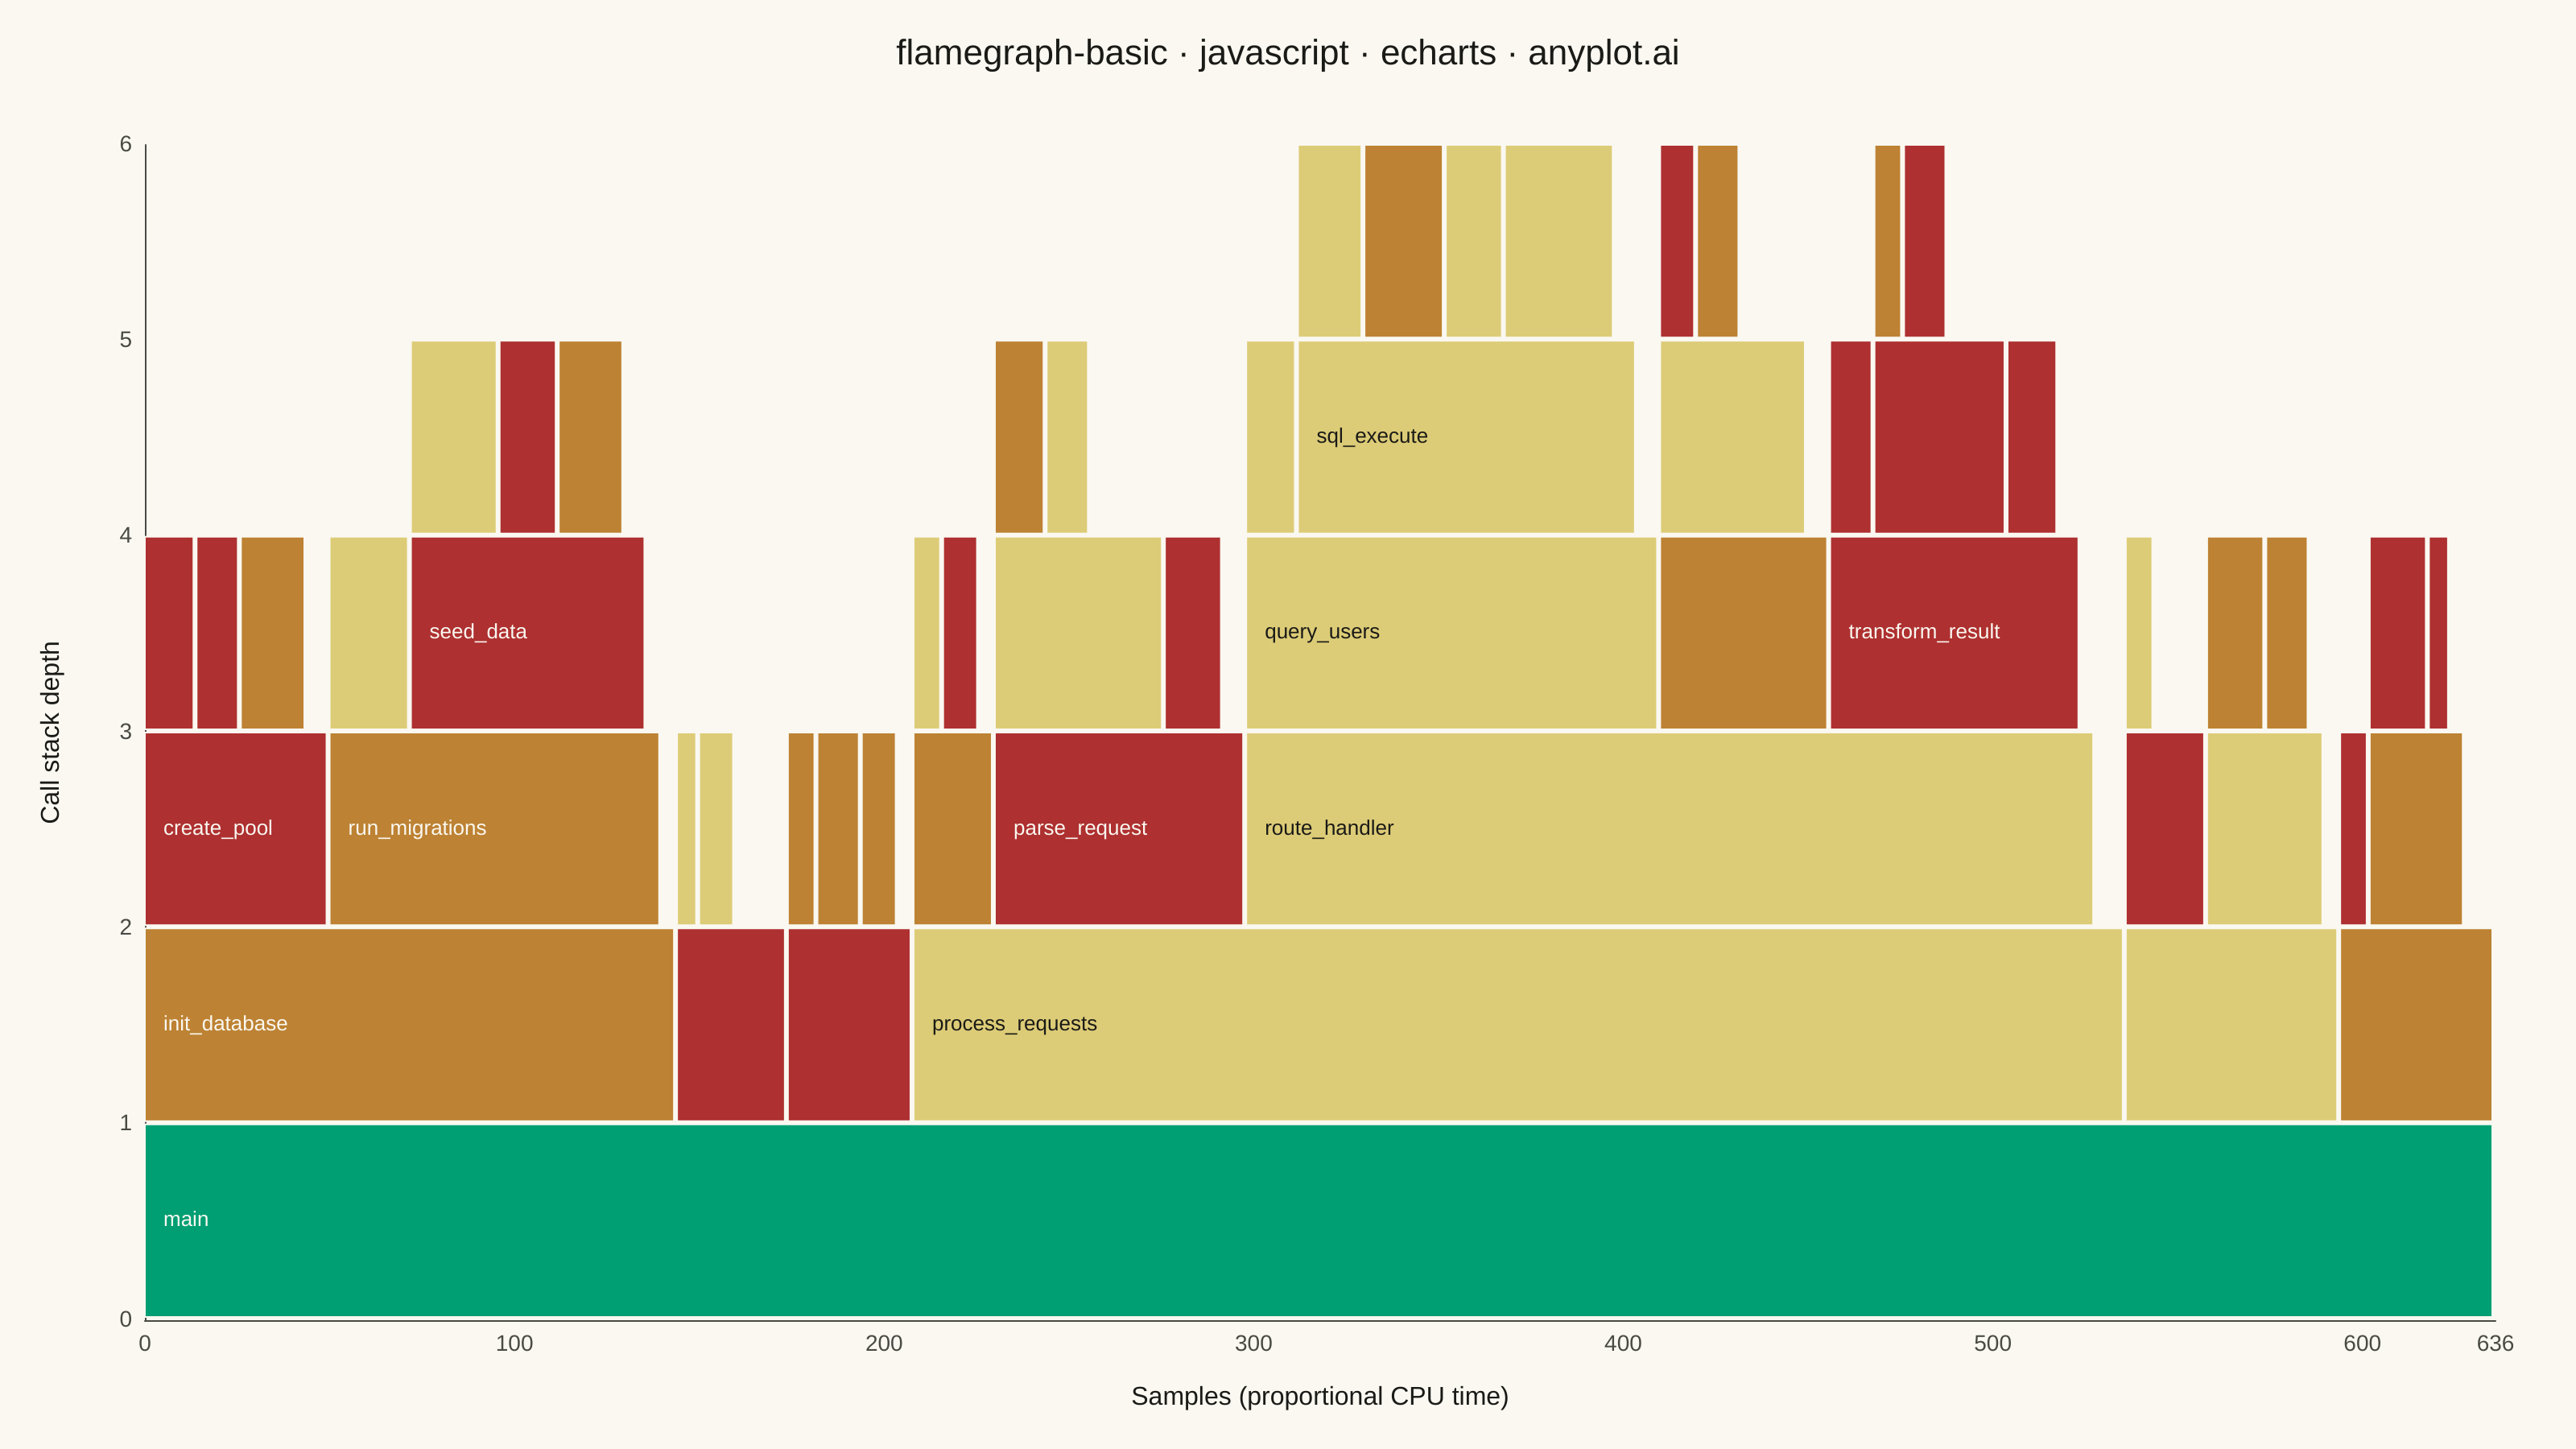
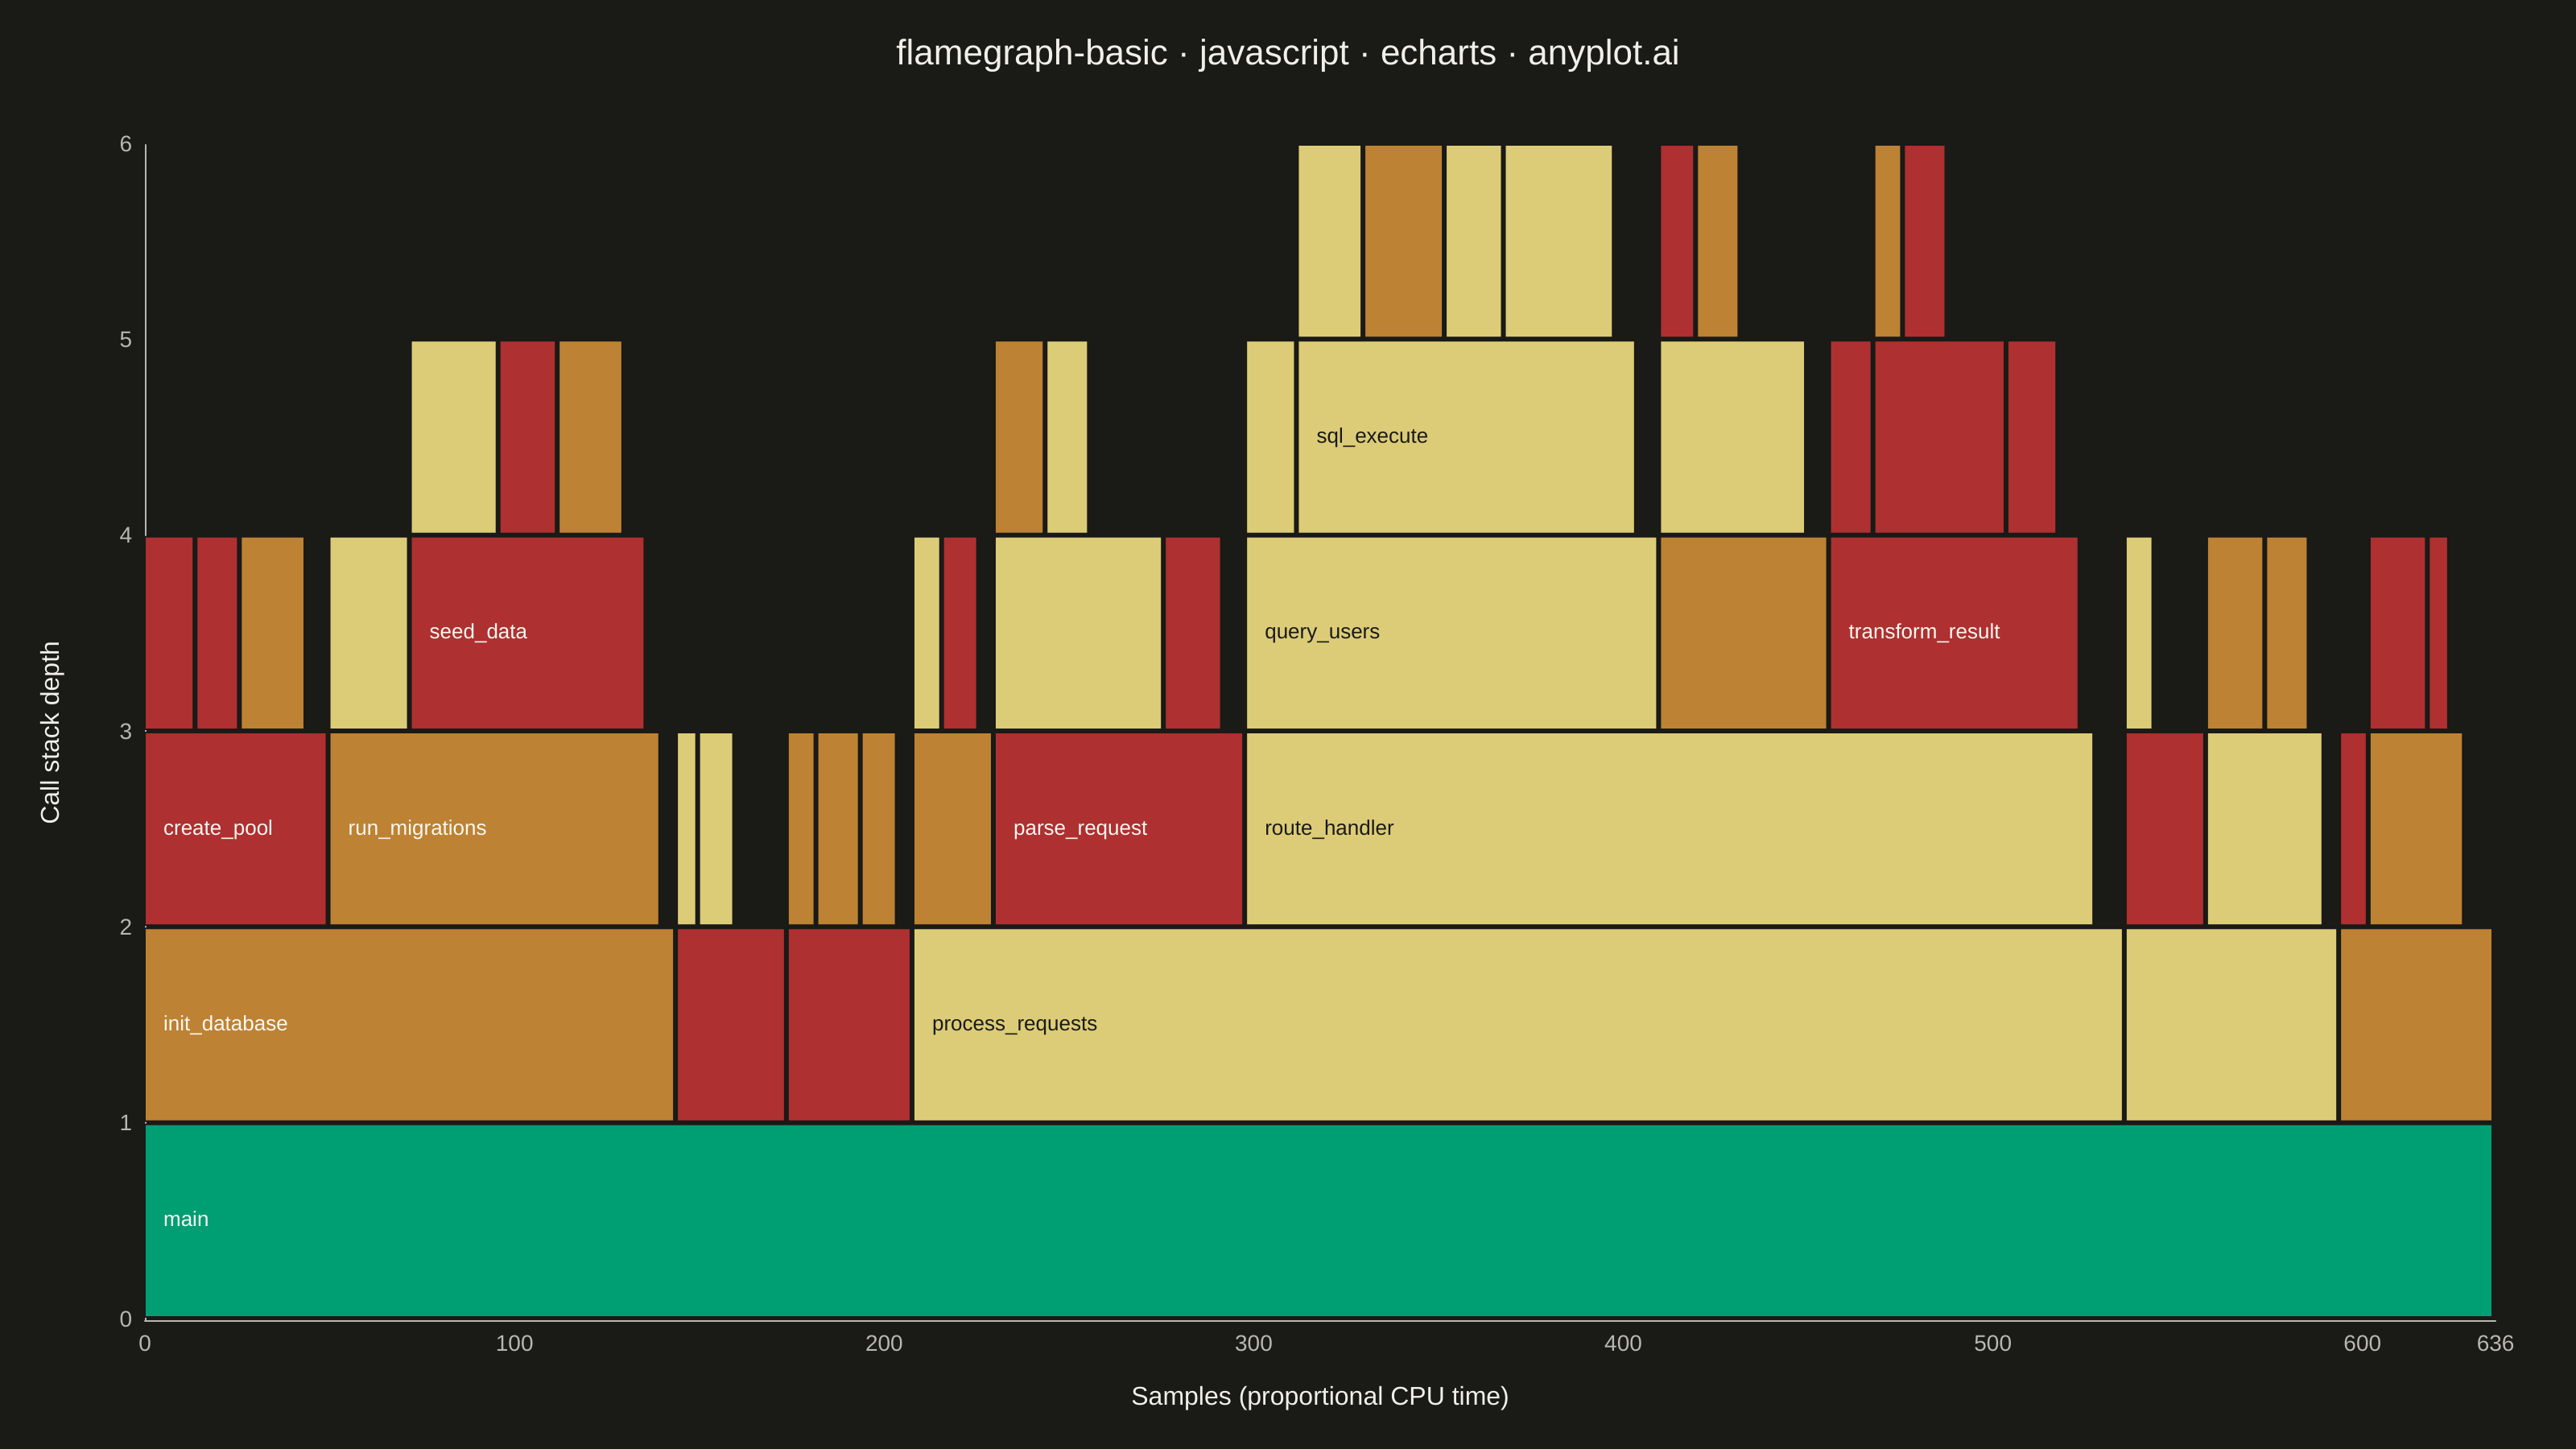
A flame graph visualizes hierarchical call stack data from performance profiling, where each horizontal bar represents a function in the call stack and its width is proportional to the time (or samples) spent in that function. Stacks are layered bottom-to-top showing caller-to-callee relationships. Invented by Brendan Gregg, flame graphs are the standard visualization for identifying CPU bottlenecks and hot code paths across all major programming languages and profiling tools.
// anyplot.ai
// flamegraph-basic: Flame Graph for Performance Profiling
// Library: echarts 5.5.1 | JavaScript 22.22.3
// Quality: 82/100 | Created: 2026-06-08
//# anyplot-orientation: landscape

const t = window.ANYPLOT_TOKENS;

// Simulated CPU profiling tree. Each node carries `self` samples; totals are
// folded up so a bar's width encodes self + descendant time.
const profile = {
  name: "main",
  self: 0,
  children: [
    { name: "load_config", self: 14, children: [
      { name: "read_yaml", self: 10 },
      { name: "merge_env", self: 6 },
    ]},
    { name: "init_database", self: 4, children: [
      { name: "create_pool", self: 6, children: [
        { name: "open_socket", self: 18 },
        { name: "auth_handshake", self: 14 },
        { name: "negotiate_tls", self: 12 },
      ]},
      { name: "run_migrations", self: 4, children: [
        { name: "alter_schema", self: 22 },
        { name: "seed_data", self: 6, children: [
          { name: "insert_users", self: 18 },
          { name: "insert_orders", self: 24 },
          { name: "insert_products", self: 16 },
        ]},
      ]},
    ]},
    { name: "process_requests", self: 8, children: [
      { name: "parse_request", self: 6, children: [
        { name: "decode_json", self: 20, children: [
          { name: "tokenize", self: 12 },
          { name: "build_ast", self: 14 },
        ]},
        { name: "validate_schema", self: 16 },
      ]},
      { name: "route_handler", self: 4, children: [
        { name: "query_users", self: 6, children: [
          { name: "sql_execute", self: 6, children: [
            { name: "plan_query", self: 16 },
            { name: "scan_index", self: 30 },
            { name: "fetch_rows", self: 22 },
            { name: "decode_pages", self: 18 },
          ]},
          { name: "build_query", self: 14 },
        ]},
        { name: "transform_result", self: 6, children: [
          { name: "map_fields", self: 16, children: [
            { name: "lookup_dict", self: 12 },
            { name: "format_currency", self: 8 },
          ]},
          { name: "filter_rows", self: 12 },
          { name: "sort_results", self: 14 },
        ]},
        { name: "serialize_response", self: 6, children: [
          { name: "encode_json", self: 18, children: [
            { name: "escape_strings", self: 10 },
            { name: "write_buffer", self: 12 },
          ]},
        ]},
      ]},
      { name: "log_request", self: 4, children: [
        { name: "format_line", self: 8 },
        { name: "write_log", self: 10 },
      ]},
    ]},
    { name: "render_template", self: 4, children: [
      { name: "compile_template", self: 14, children: [
        { name: "lex_tokens", self: 8 },
      ]},
      { name: "interpolate_values", self: 4, children: [
        { name: "escape_html", self: 16 },
        { name: "resolve_partials", self: 12 },
      ]},
    ]},
    { name: "send_metrics", self: 8, children: [
      { name: "collect_counters", self: 8 },
      { name: "flush_buffer", self: 4, children: [
        { name: "http_post", self: 16 },
        { name: "retry_backoff", self: 6 },
      ]},
    ]},
    { name: "network_io", self: 4, children: [
      { name: "read_socket", self: 12 },
      { name: "write_socket", self: 10 },
      { name: "dns_lookup", self: 8 },
    ]},
  ],
};

// Fold descendant samples into each node's total.
function computeTotals(node) {
  let total = node.self || 0;
  for (const child of node.children || []) total += computeTotals(child);
  node.total = total;
  return total;
}
computeTotals(profile);

// Lay out rectangles bottom-up: depth = row, [x0, x1] proportional to total.
const rectangles = [];
function layout(node, x0, depth) {
  rectangles.push({ name: node.name, x0, x1: x0 + node.total, depth });
  const children = (node.children || []).slice().sort((a, b) => a.name.localeCompare(b.name));
  let cx = x0;
  for (const child of children) {
    layout(child, cx, depth + 1);
    cx += child.total;
  }
}
layout(profile, 0, 0);

const totalSamples = profile.total;
const maxDepth = Math.max.apply(null, rectangles.map((r) => r.depth));

// Warm Imprint subset for flame graph aesthetic — ochre, matte red, amber —
// keyed deterministically off the function name so repeat frames keep their
// identity. Brand green (#009E73, Imprint position 1) anchors the root frame,
// satisfying the "first categorical series" rule while preserving the
// conventional warm flame palette for stacked frames above.
const warmColors = ["#BD8233", "#AE3030", "#DDCC77"];
function colorFor(rect) {
  if (rect.depth === 0) return t.palette[0];
  let h = 0;
  for (let i = 0; i < rect.name.length; i++) h = (h * 31 + rect.name.charCodeAt(i)) >>> 0;
  return warmColors[h % warmColors.length];
}

// WCAG relative luminance — pick label ink from per-bar fill luminance so
// labels keep contrast regardless of theme (dark text on light fills, light
// text on dark fills).
function labelInkFor(hex) {
  const h = hex.replace("#", "");
  const channels = [0, 2, 4].map((i) => {
    const c = parseInt(h.slice(i, i + 2), 16) / 255;
    return c <= 0.03928 ? c / 12.92 : Math.pow((c + 0.055) / 1.055, 2.4);
  });
  const lum = 0.2126 * channels[0] + 0.7152 * channels[1] + 0.0722 * channels[2];
  return lum > 0.5 ? "#1A1A17" : "#FAF8F1";
}

// Encode each rectangle as [x0, x1, depth, name]. Pre-compute fill + label ink.
const data = rectangles.map((r) => {
  const fill = colorFor(r);
  return {
    value: [r.x0, r.x1, r.depth, r.name, fill, labelInkFor(fill)],
    itemStyle: { color: fill },
  };
});

const chart = echarts.init(document.getElementById("container"));

chart.setOption({
  animation: false,
  backgroundColor: "transparent",
  title: {
    text: "flamegraph-basic · javascript · echarts · anyplot.ai",
    left: "center",
    top: 18,
    textStyle: { color: t.ink, fontSize: 22, fontWeight: "normal" },
  },
  grid: { left: 90, right: 50, top: 90, bottom: 80 },
  xAxis: {
    type: "value",
    min: 0,
    max: totalSamples,
    name: "Samples (proportional CPU time)",
    nameLocation: "middle",
    nameGap: 40,
    nameTextStyle: { color: t.ink, fontSize: 16 },
    axisLabel: { color: t.inkSoft, fontSize: 14 },
    axisLine: { lineStyle: { color: t.inkSoft } },
    axisTick: { show: false },
    splitLine: { show: false },
  },
  yAxis: {
    type: "value",
    min: 0,
    max: maxDepth + 1,
    interval: 1,
    name: "Call stack depth",
    nameLocation: "middle",
    nameGap: 50,
    nameTextStyle: { color: t.ink, fontSize: 16 },
    axisLabel: { color: t.inkSoft, fontSize: 14, formatter: (v) => (Number.isInteger(v) ? v : "") },
    axisLine: { lineStyle: { color: t.inkSoft } },
    axisTick: { show: false },
    splitLine: { show: false },
  },
  series: [{
    type: "custom",
    encode: { x: [0, 1], y: 2 },
    renderItem: (params, api) => {
      const x0 = api.coord([api.value(0), api.value(2)])[0];
      const x1 = api.coord([api.value(1), api.value(2)])[0];
      const yTop = api.coord([0, api.value(2) + 1])[1];
      const yBottom = api.coord([0, api.value(2)])[1];
      const width = Math.max(0, x1 - x0);
      const height = Math.max(0, yBottom - yTop);
      const name = api.value(3);
      const fill = api.value(4);
      const labelInk = api.value(5);
      // Only label when the function name + left inset + right safety gap
      // genuinely fits — keeps adjacent in-bar labels from butting at depth 3.
      const estTextWidth = String(name).length * 7.2;
      const showLabel = width > estTextWidth + 28;
      return {
        type: "rect",
        shape: { x: x0, y: yTop, width: Math.max(0, width - 2), height: Math.max(0, height - 2) },
        style: { fill, stroke: t.pageBg, lineWidth: 1 },
        textContent: showLabel ? {
          type: "text",
          style: {
            text: name,
            fill: labelInk,
            font: '13px -apple-system, "Segoe UI", Roboto, sans-serif',
            textAlign: "left",
            textVerticalAlign: "middle",
          },
        } : undefined,
        textConfig: showLabel ? { position: "insideLeft", inside: true, distance: 12 } : undefined,
      };
    },
    data,
  }],
});

window.__anyplotReady = true;
Runnable source as JSON, for any HTTP client: https://api.anyplot.ai/specs/flamegraph-basic/echarts/code. Any spec id and library id listed in llms-full.txt fit the same URL shape; every URL below is complete and callable.
{
  "spec_id": "flamegraph-basic",
  "language": "javascript",
  "library": "echarts",
  "page": "https://anyplot.ai/flamegraph-basic/javascript/echarts",
  "hub": "https://anyplot.ai/flamegraph-basic",
  "code_json": "https://api.anyplot.ai/specs/flamegraph-basic/echarts/code",
  "spec_json": "https://api.anyplot.ai/specs/flamegraph-basic",
  "render_light_png": "https://storage.googleapis.com/anyplot-images/plots/flamegraph-basic/javascript/echarts/plot-light.png",
  "render_dark_png": "https://storage.googleapis.com/anyplot-images/plots/flamegraph-basic/javascript/echarts/plot-dark.png",
  "interactive_light_html": "https://storage.googleapis.com/anyplot-images/plots/flamegraph-basic/javascript/echarts/plot-light.html",
  "interactive_dark_html": "https://storage.googleapis.com/anyplot-images/plots/flamegraph-basic/javascript/echarts/plot-dark.html",
  "quality_score": 82.0,
  "license": "MIT",
  "guide": "https://anyplot.ai/llms.txt"
}
Part of Flame Graph for Performance Profiling on anyplot.ai.