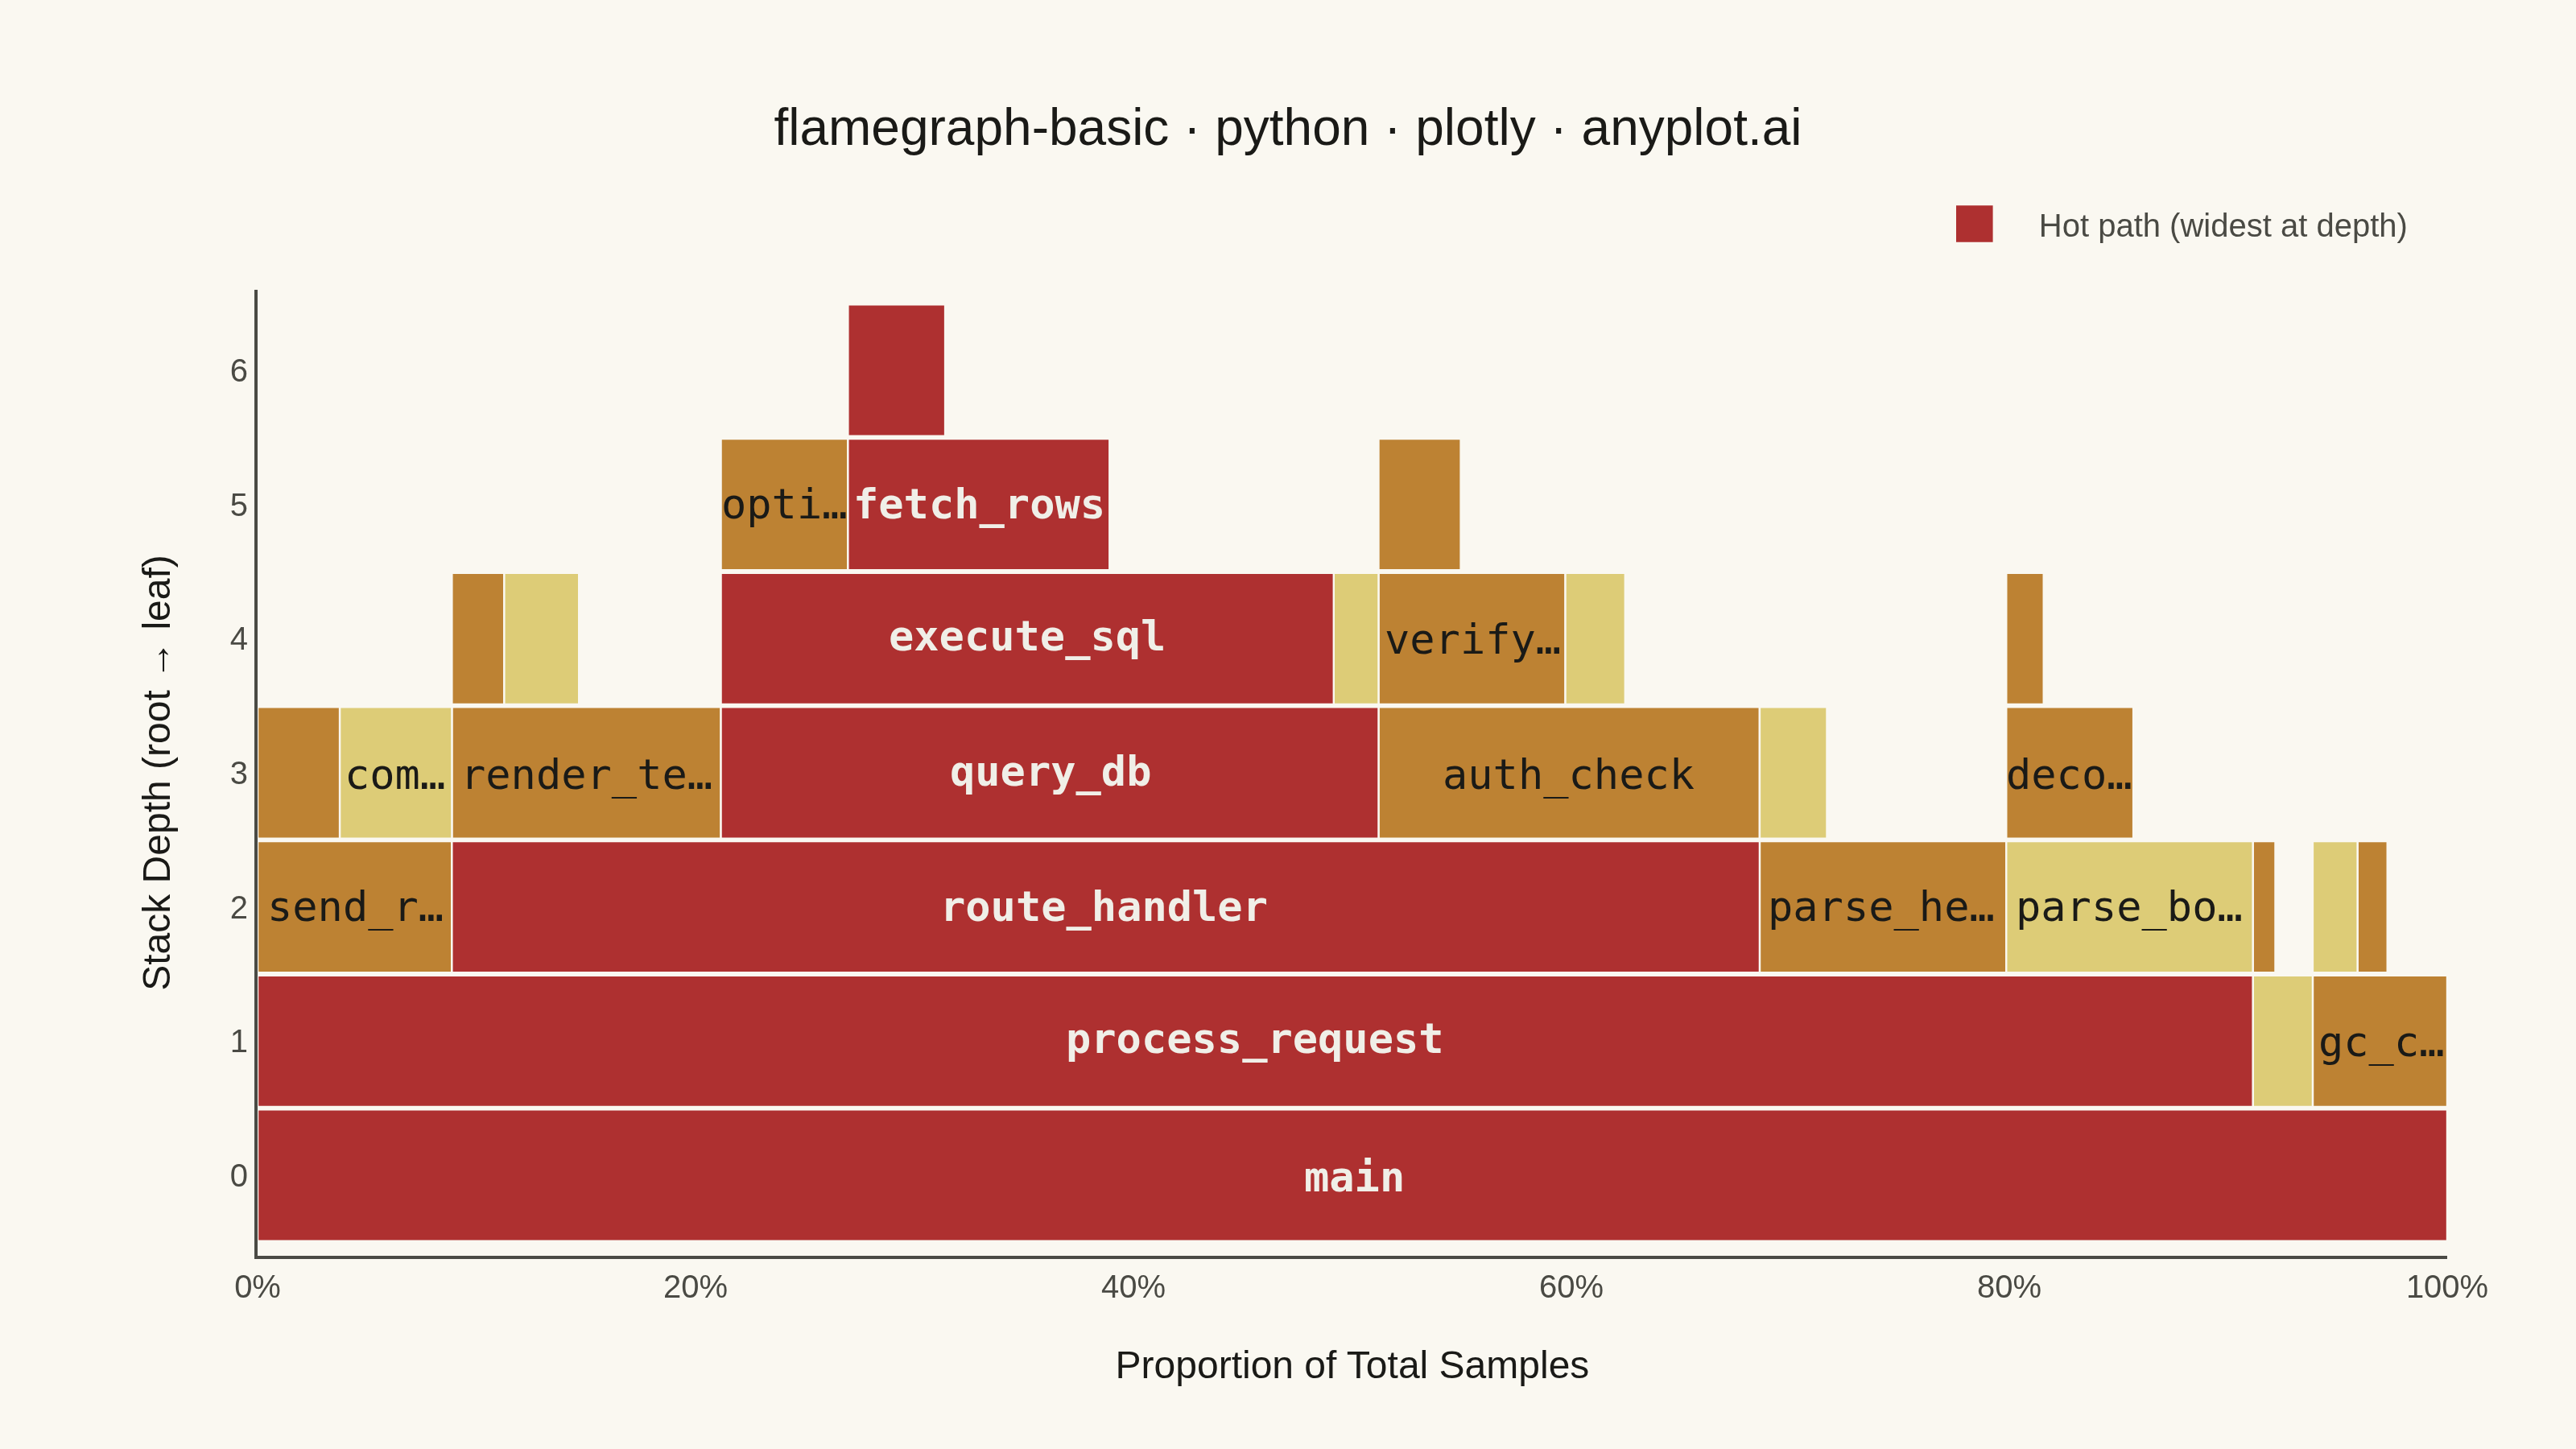
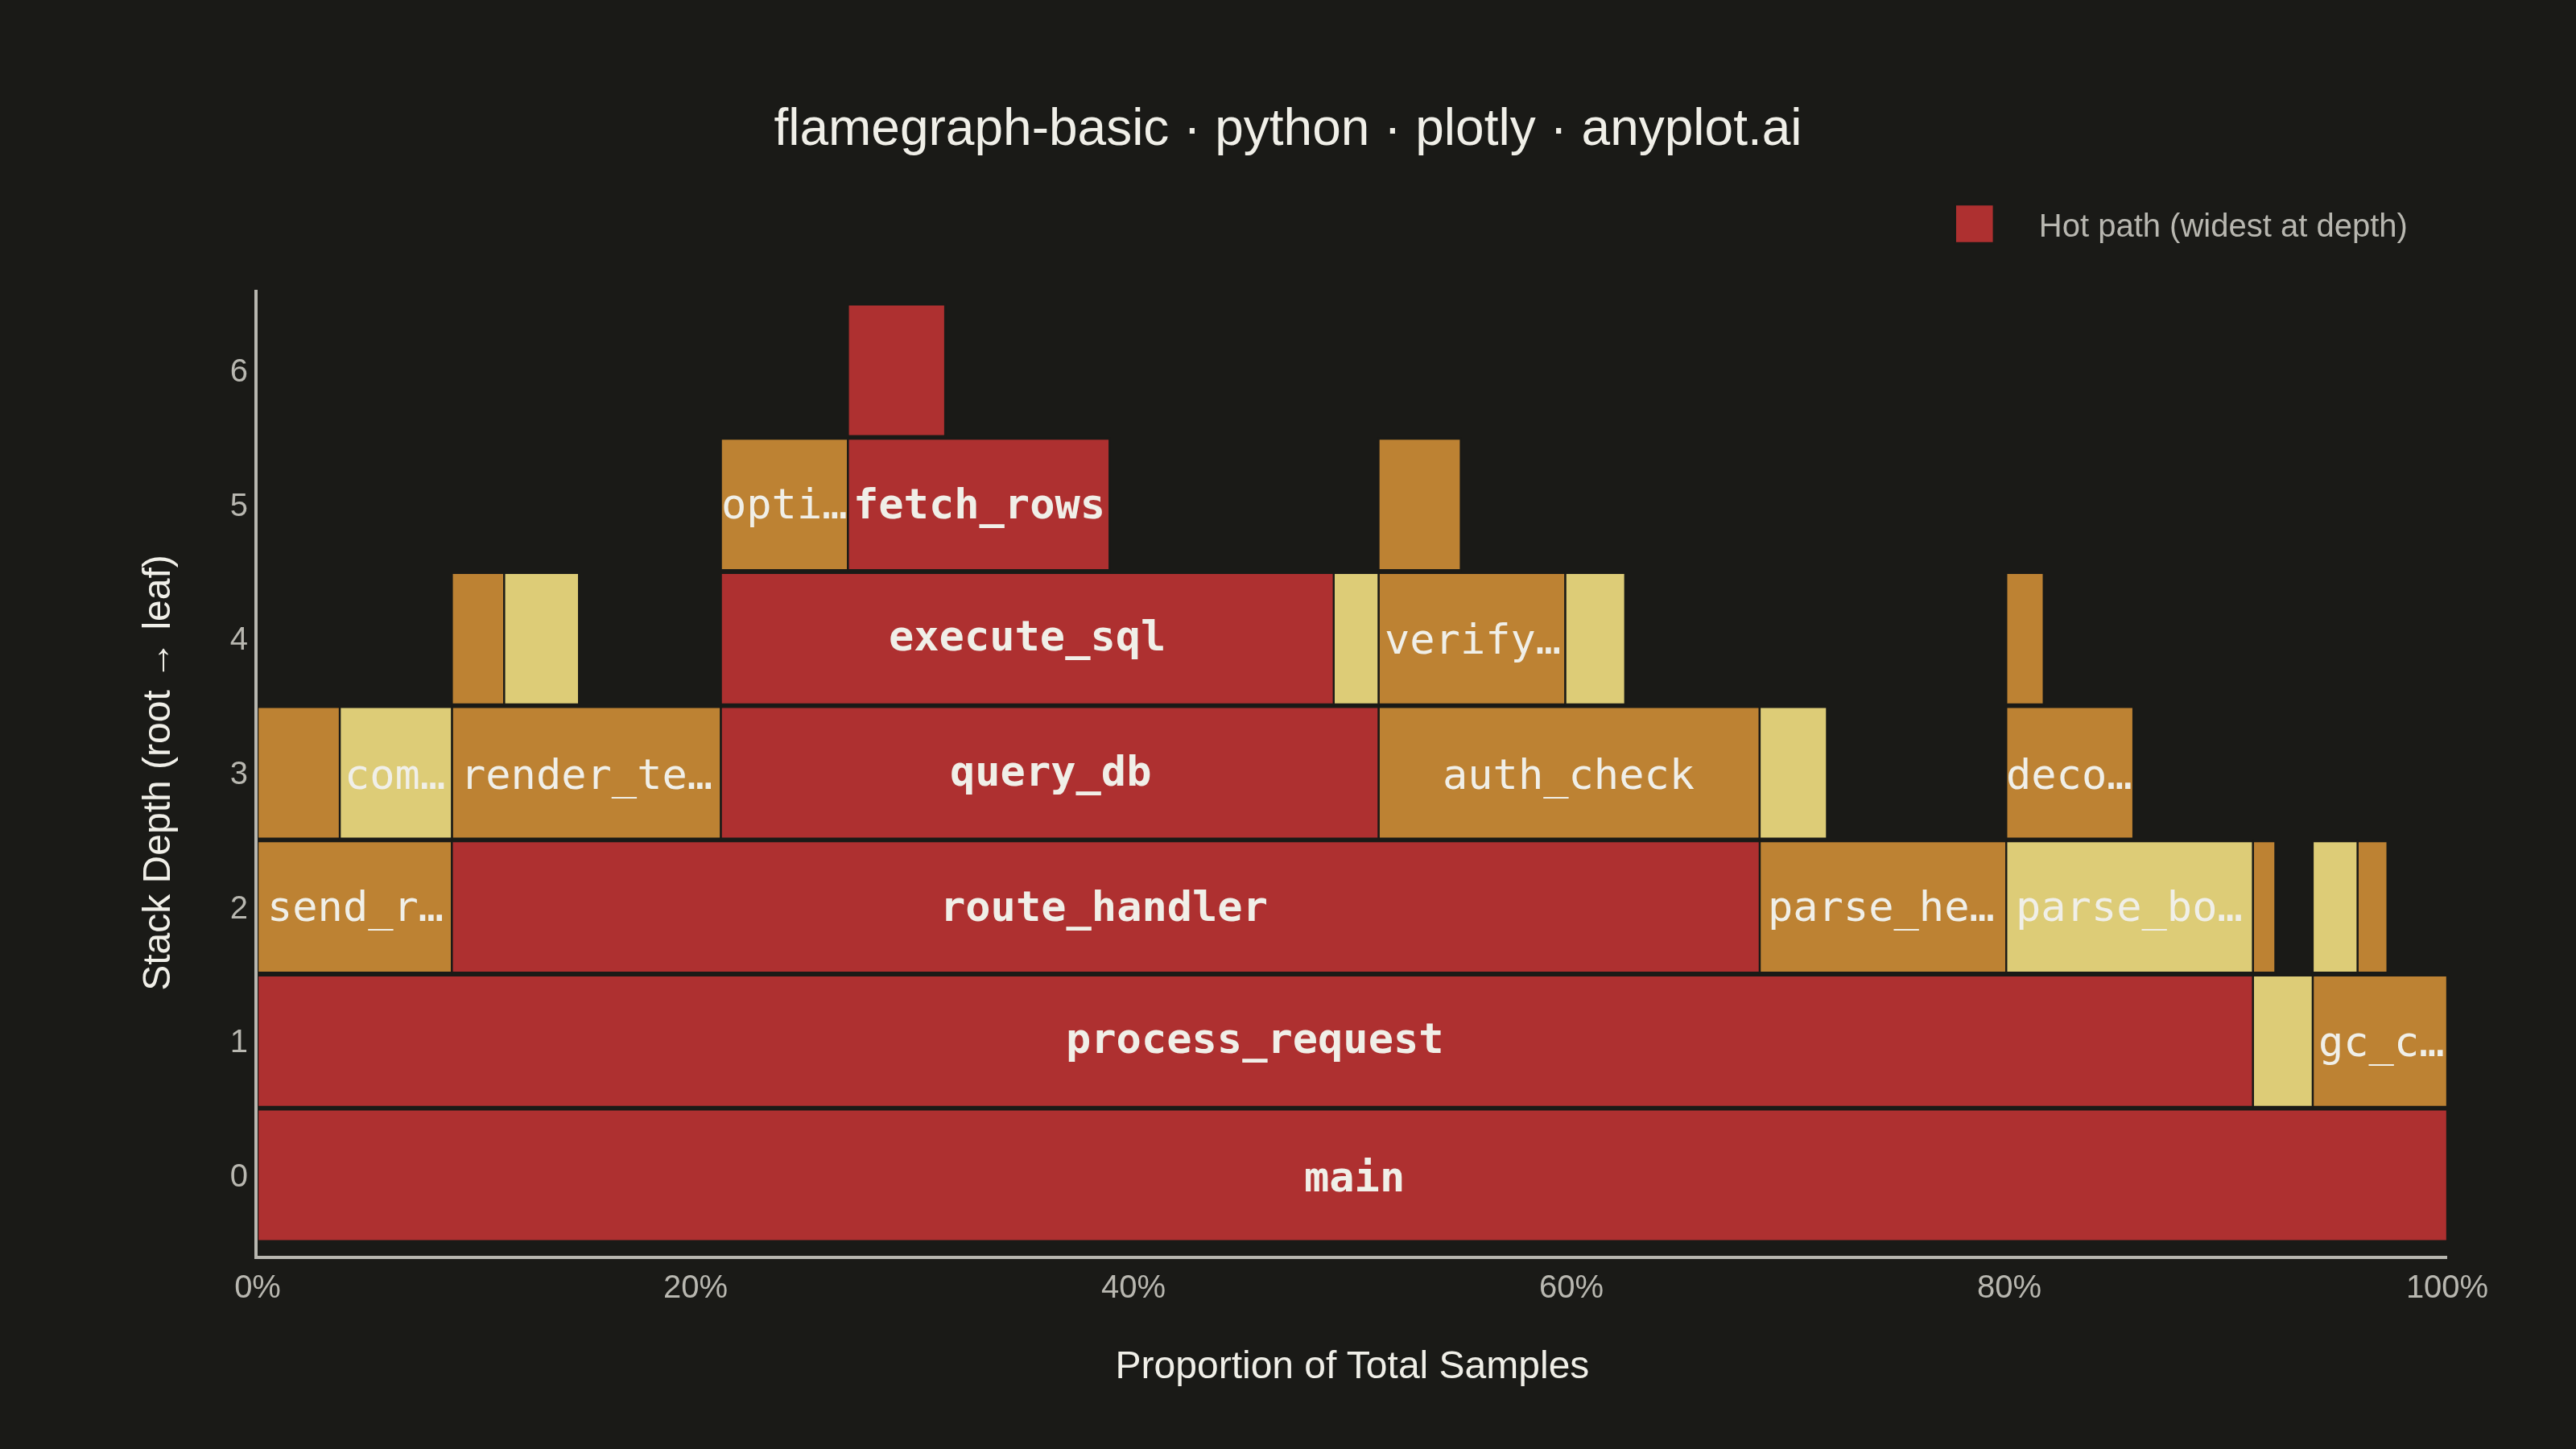
A flame graph visualizes hierarchical call stack data from performance profiling, where each horizontal bar represents a function in the call stack and its width is proportional to the time (or samples) spent in that function. Stacks are layered bottom-to-top showing caller-to-callee relationships. Invented by Brendan Gregg, flame graphs are the standard visualization for identifying CPU bottlenecks and hot code paths across all major programming languages and profiling tools.
""" anyplot.ai
flamegraph-basic: Flame Graph for Performance Profiling
Library: plotly 6.8.0 | Python 3.13.13
Quality: 88/100 | Updated: 2026-06-08
"""

import os

import plotly.graph_objects as go


# Theme tokens (Imprint palette + theme-adaptive chrome)
THEME = os.getenv("ANYPLOT_THEME", "light")
PAGE_BG = "#FAF8F1" if THEME == "light" else "#1A1A17"
ELEVATED_BG = "#FFFDF6" if THEME == "light" else "#242420"
INK = "#1A1A17" if THEME == "light" else "#F0EFE8"
INK_SOFT = "#4A4A44" if THEME == "light" else "#B8B7B0"
GRID = "rgba(26,26,23,0.15)" if THEME == "light" else "rgba(240,239,232,0.15)"

# Imprint warm trio (semantic exception: flame graphs conventionally use warm colors).
# Hot path uses matte red as the "alert / bottleneck" semantic anchor; non-hot bars
# alternate ochre and amber for high-contrast neighbour differentiation.
HOT_COLOR = "#AE3030"  # Imprint matte red — semantic anchor for bottleneck
OCHRE = "#BD8233"  # Imprint ochre
AMBER = "#DDCC77"  # Imprint amber semantic anchor (warning)
BAR_EDGE = PAGE_BG  # subtle inter-bar separation against page surface

# Data — simulated CPU profiling: web request handler stack samples
# Format: (semicolon_stack_path, self_samples)
raw_stacks = [
    ("main", 0),
    ("main;process_request", 0),
    ("main;process_request;parse_headers", 120),
    ("main;process_request;parse_headers;validate_encoding", 45),
    ("main;process_request;parse_body", 80),
    ("main;process_request;parse_body;decode_json", 60),
    ("main;process_request;parse_body;decode_json;alloc_buffer", 25),
    ("main;process_request;route_handler", 0),
    ("main;process_request;route_handler;auth_check", 90),
    ("main;process_request;route_handler;auth_check;verify_token", 70),
    ("main;process_request;route_handler;auth_check;verify_token;decrypt", 55),
    ("main;process_request;route_handler;auth_check;load_session", 40),
    ("main;process_request;route_handler;query_db", 0),
    ("main;process_request;route_handler;query_db;connect", 30),
    ("main;process_request;route_handler;query_db;execute_sql", 150),
    ("main;process_request;route_handler;query_db;execute_sql;optimize_plan", 85),
    ("main;process_request;route_handler;query_db;execute_sql;fetch_rows", 110),
    ("main;process_request;route_handler;query_db;execute_sql;fetch_rows;deserialize", 65),
    ("main;process_request;route_handler;render_template", 95),
    ("main;process_request;route_handler;render_template;compile", 50),
    ("main;process_request;route_handler;render_template;escape_html", 35),
    ("main;process_request;send_response", 0),
    ("main;process_request;send_response;compress", 75),
    ("main;process_request;send_response;write_socket", 55),
    ("main;gc_collect", 40),
    ("main;gc_collect;mark_sweep", 30),
    ("main;gc_collect;compact_heap", 20),
    ("main;log_metrics", 25),
    ("main;log_metrics;serialize", 15),
]

stack_self = dict(raw_stacks)

# Collect all stacks (including intermediate ancestors that may have no self samples)
all_stacks = set()
for stack, _ in raw_stacks:
    parts = stack.split(";")
    for i in range(len(parts)):
        all_stacks.add(";".join(parts[: i + 1]))

# Inclusive samples = self + sum of all descendants
inclusive = {}
for stack in all_stacks:
    total = stack_self.get(stack, 0)
    prefix = stack + ";"
    for other, samples in stack_self.items():
        if other.startswith(prefix) and samples > 0:
            total += samples
    inclusive[stack] = total

total_samples = inclusive["main"]

# Build children map and sort siblings alphabetically (flame graph convention)
children_map = {}
for stack in all_stacks:
    parts = stack.split(";")
    if len(parts) > 1:
        parent = ";".join(parts[:-1])
        children_map.setdefault(parent, []).append(stack)

for parent in children_map:
    children_map[parent].sort(key=lambda s: s.split(";")[-1])

# Assign x positions iteratively (DFS via worklist)
bars = []
work_stack = [("main", 0.0)]
while work_stack:
    stack, x_start = work_stack.pop()
    width = inclusive[stack] / total_samples
    depth = stack.count(";")
    func_name = stack.split(";")[-1]
    bars.append((x_start, width, depth, func_name, inclusive[stack], stack))
    if stack in children_map:
        child_x = x_start
        for child in reversed(children_map[stack]):
            child_width = inclusive[child] / total_samples
            work_stack.append((child, child_x))
            child_x += child_width

# Identify hot path: widest bar at each depth
hot_path_stacks = set()
depth_bars = {}
for _, _, depth, _, samples, stack in bars:
    if depth not in depth_bars or samples > depth_bars[depth][1]:
        depth_bars[depth] = (stack, samples)
for stack, _ in depth_bars.values():
    hot_path_stacks.add(stack)

max_depth = max(b[2] for b in bars)

# Color assignment: hot path -> matte red; others alternate ochre/amber so neighbours
# at the same depth never share a color (deterministic by sibling x-position rank).
sibling_rank = {}
by_depth = {}
for x_start, _w, depth, _f, _s, stack in bars:
    by_depth.setdefault(depth, []).append((x_start, stack))
for items in by_depth.values():
    items.sort()
    for rank, (_x, stack) in enumerate(items):
        sibling_rank[stack] = rank

# Plot — group bars by color into batched horizontal-bar traces (idiomatic Plotly)
groups = {"hot": [], "ochre": [], "amber": []}
for x_start, width, depth, func_name, samples, stack in bars:
    if stack in hot_path_stacks:
        key = "hot"
    elif sibling_rank[stack] % 2 == 0:
        key = "ochre"
    else:
        key = "amber"
    groups[key].append((x_start, width, depth, func_name, samples, stack))

color_for = {"hot": HOT_COLOR, "ochre": OCHRE, "amber": AMBER}
legend_label = {"hot": "Hot path (widest at depth)", "ochre": "", "amber": ""}

bar_height = 0.98  # flame-graph convention: depth rows touch; BAR_EDGE provides hairline separation
fig = go.Figure()

# Only "Hot path" appears in legend — ochre/amber alternation is decorative, not semantic
show_in_legend = {"hot": True, "ochre": False, "amber": False}

for key in ("ochre", "amber", "hot"):
    group = groups[key]
    if not group:
        continue
    widths = [g[1] for g in group]
    bases = [g[0] for g in group]
    depths = [g[2] for g in group]
    hover_texts = [
        f"<b>{g[3]}</b><br>Stack: {g[5]}<br>Samples: {g[4]} ({g[1] * 100:.1f}%)<extra></extra>" for g in group
    ]
    fig.add_trace(
        go.Bar(
            x=widths,
            y=depths,
            base=bases,
            orientation="h",
            marker={"color": color_for[key], "line": {"color": BAR_EDGE, "width": 0.6}},
            width=bar_height,
            name=legend_label[key],
            showlegend=show_in_legend[key],
            hovertemplate=hover_texts,
        )
    )

# Function-name labels — strict pixel-fit gate so labels never overflow bar bounds.
# Logical canvas = 800 px × scale 4 = 3200 px. Inner plot width = 800 - margin.l - margin.r.
# At 13 px monospace, each glyph is ~7.8 logical px; drop the label if even a 3-char + ellipsis
# truncation would not fit — the hover tooltip already carries the full function name.
INNER_PLOT_PX = 800 - 80 - 40
PX_PER_CHAR = 7.8
MIN_FIT_CHARS = 4

for x_start, width, depth, func_name, _samples, stack in bars:
    bar_px = INNER_PLOT_PX * width
    max_chars = int(bar_px / PX_PER_CHAR)
    if max_chars < MIN_FIT_CHARS:
        continue
    if len(func_name) <= max_chars:
        display_text = func_name
    else:
        display_text = func_name[: max_chars - 1] + "…"
    is_hot = stack in hot_path_stacks
    font_color = "#F0EFE8" if is_hot else INK
    fig.add_annotation(
        x=x_start + width / 2,
        y=depth,
        text=f"<b>{display_text}</b>" if is_hot else display_text,
        showarrow=False,
        font={"size": 13, "color": font_color, "family": "Consolas, Monaco, monospace"},
        xanchor="center",
        yanchor="middle",
    )

# Style
title_text = "flamegraph-basic · python · plotly · anyplot.ai"
fig.update_layout(
    autosize=False,
    title={"text": title_text, "font": {"size": 16, "color": INK}, "x": 0.5, "xanchor": "center"},
    barmode="overlay",
    bargap=0,
    hovermode="closest",
    hoverlabel={
        "bgcolor": ELEVATED_BG,
        "bordercolor": INK_SOFT,
        "font": {"family": "Consolas, Monaco, monospace", "size": 12, "color": INK},
        "align": "left",
    },
    xaxis={
        "title": {"text": "Proportion of Total Samples", "font": {"size": 12, "color": INK}},
        "tickfont": {"size": 10, "color": INK_SOFT},
        "range": [0, 1],
        "tickformat": ".0%",
        "showgrid": False,
        "zeroline": False,
        "linecolor": INK_SOFT,
    },
    yaxis={
        "title": {"text": "Stack Depth (root → leaf)", "font": {"size": 12, "color": INK}},
        "tickfont": {"size": 10, "color": INK_SOFT},
        "dtick": 1,
        "range": [-0.6, max_depth + 0.6],
        "showgrid": False,
        "zeroline": False,
        "linecolor": INK_SOFT,
    },
    legend={
        "bgcolor": "rgba(0,0,0,0)",
        "bordercolor": "rgba(0,0,0,0)",
        "borderwidth": 0,
        "font": {"size": 10, "color": INK_SOFT},
        "orientation": "h",
        "x": 0.99,
        "xanchor": "right",
        "y": 1.02,
        "yanchor": "bottom",
        "itemclick": False,
        "itemdoubleclick": False,
    },
    margin={"l": 80, "r": 40, "t": 90, "b": 60},
    paper_bgcolor=PAGE_BG,
    plot_bgcolor=PAGE_BG,
    font={"color": INK},
)

# Save — hard target 3200×1800 (landscape): width=800, height=450, scale=4
fig.write_image(f"plot-{THEME}.png", width=800, height=450, scale=4)
# Interactive HTML: cleaner Plotly modebar — drop selection tools that don't apply to flame graphs
fig.write_html(
    f"plot-{THEME}.html",
    include_plotlyjs="cdn",
    config={
        "displaylogo": False,
        "modeBarButtonsToRemove": ["select2d", "lasso2d", "autoScale2d"],
        "toImageButtonOptions": {"format": "png", "filename": "flamegraph-basic", "scale": 4},
    },
)
Runnable source as JSON, for any HTTP client: https://api.anyplot.ai/specs/flamegraph-basic/plotly/code. Any spec id and library id listed in llms-full.txt fit the same URL shape; every URL below is complete and callable.
{
  "spec_id": "flamegraph-basic",
  "language": "python",
  "library": "plotly",
  "page": "https://anyplot.ai/flamegraph-basic/python/plotly",
  "hub": "https://anyplot.ai/flamegraph-basic",
  "code_json": "https://api.anyplot.ai/specs/flamegraph-basic/plotly/code",
  "spec_json": "https://api.anyplot.ai/specs/flamegraph-basic",
  "render_light_png": "https://storage.googleapis.com/anyplot-images/plots/flamegraph-basic/python/plotly/plot-light.png",
  "render_dark_png": "https://storage.googleapis.com/anyplot-images/plots/flamegraph-basic/python/plotly/plot-dark.png",
  "interactive_light_html": "https://storage.googleapis.com/anyplot-images/plots/flamegraph-basic/python/plotly/plot-light.html",
  "interactive_dark_html": "https://storage.googleapis.com/anyplot-images/plots/flamegraph-basic/python/plotly/plot-dark.html",
  "quality_score": 88.0,
  "license": "MIT",
  "guide": "https://anyplot.ai/llms.txt"
}
Part of Flame Graph for Performance Profiling on anyplot.ai.