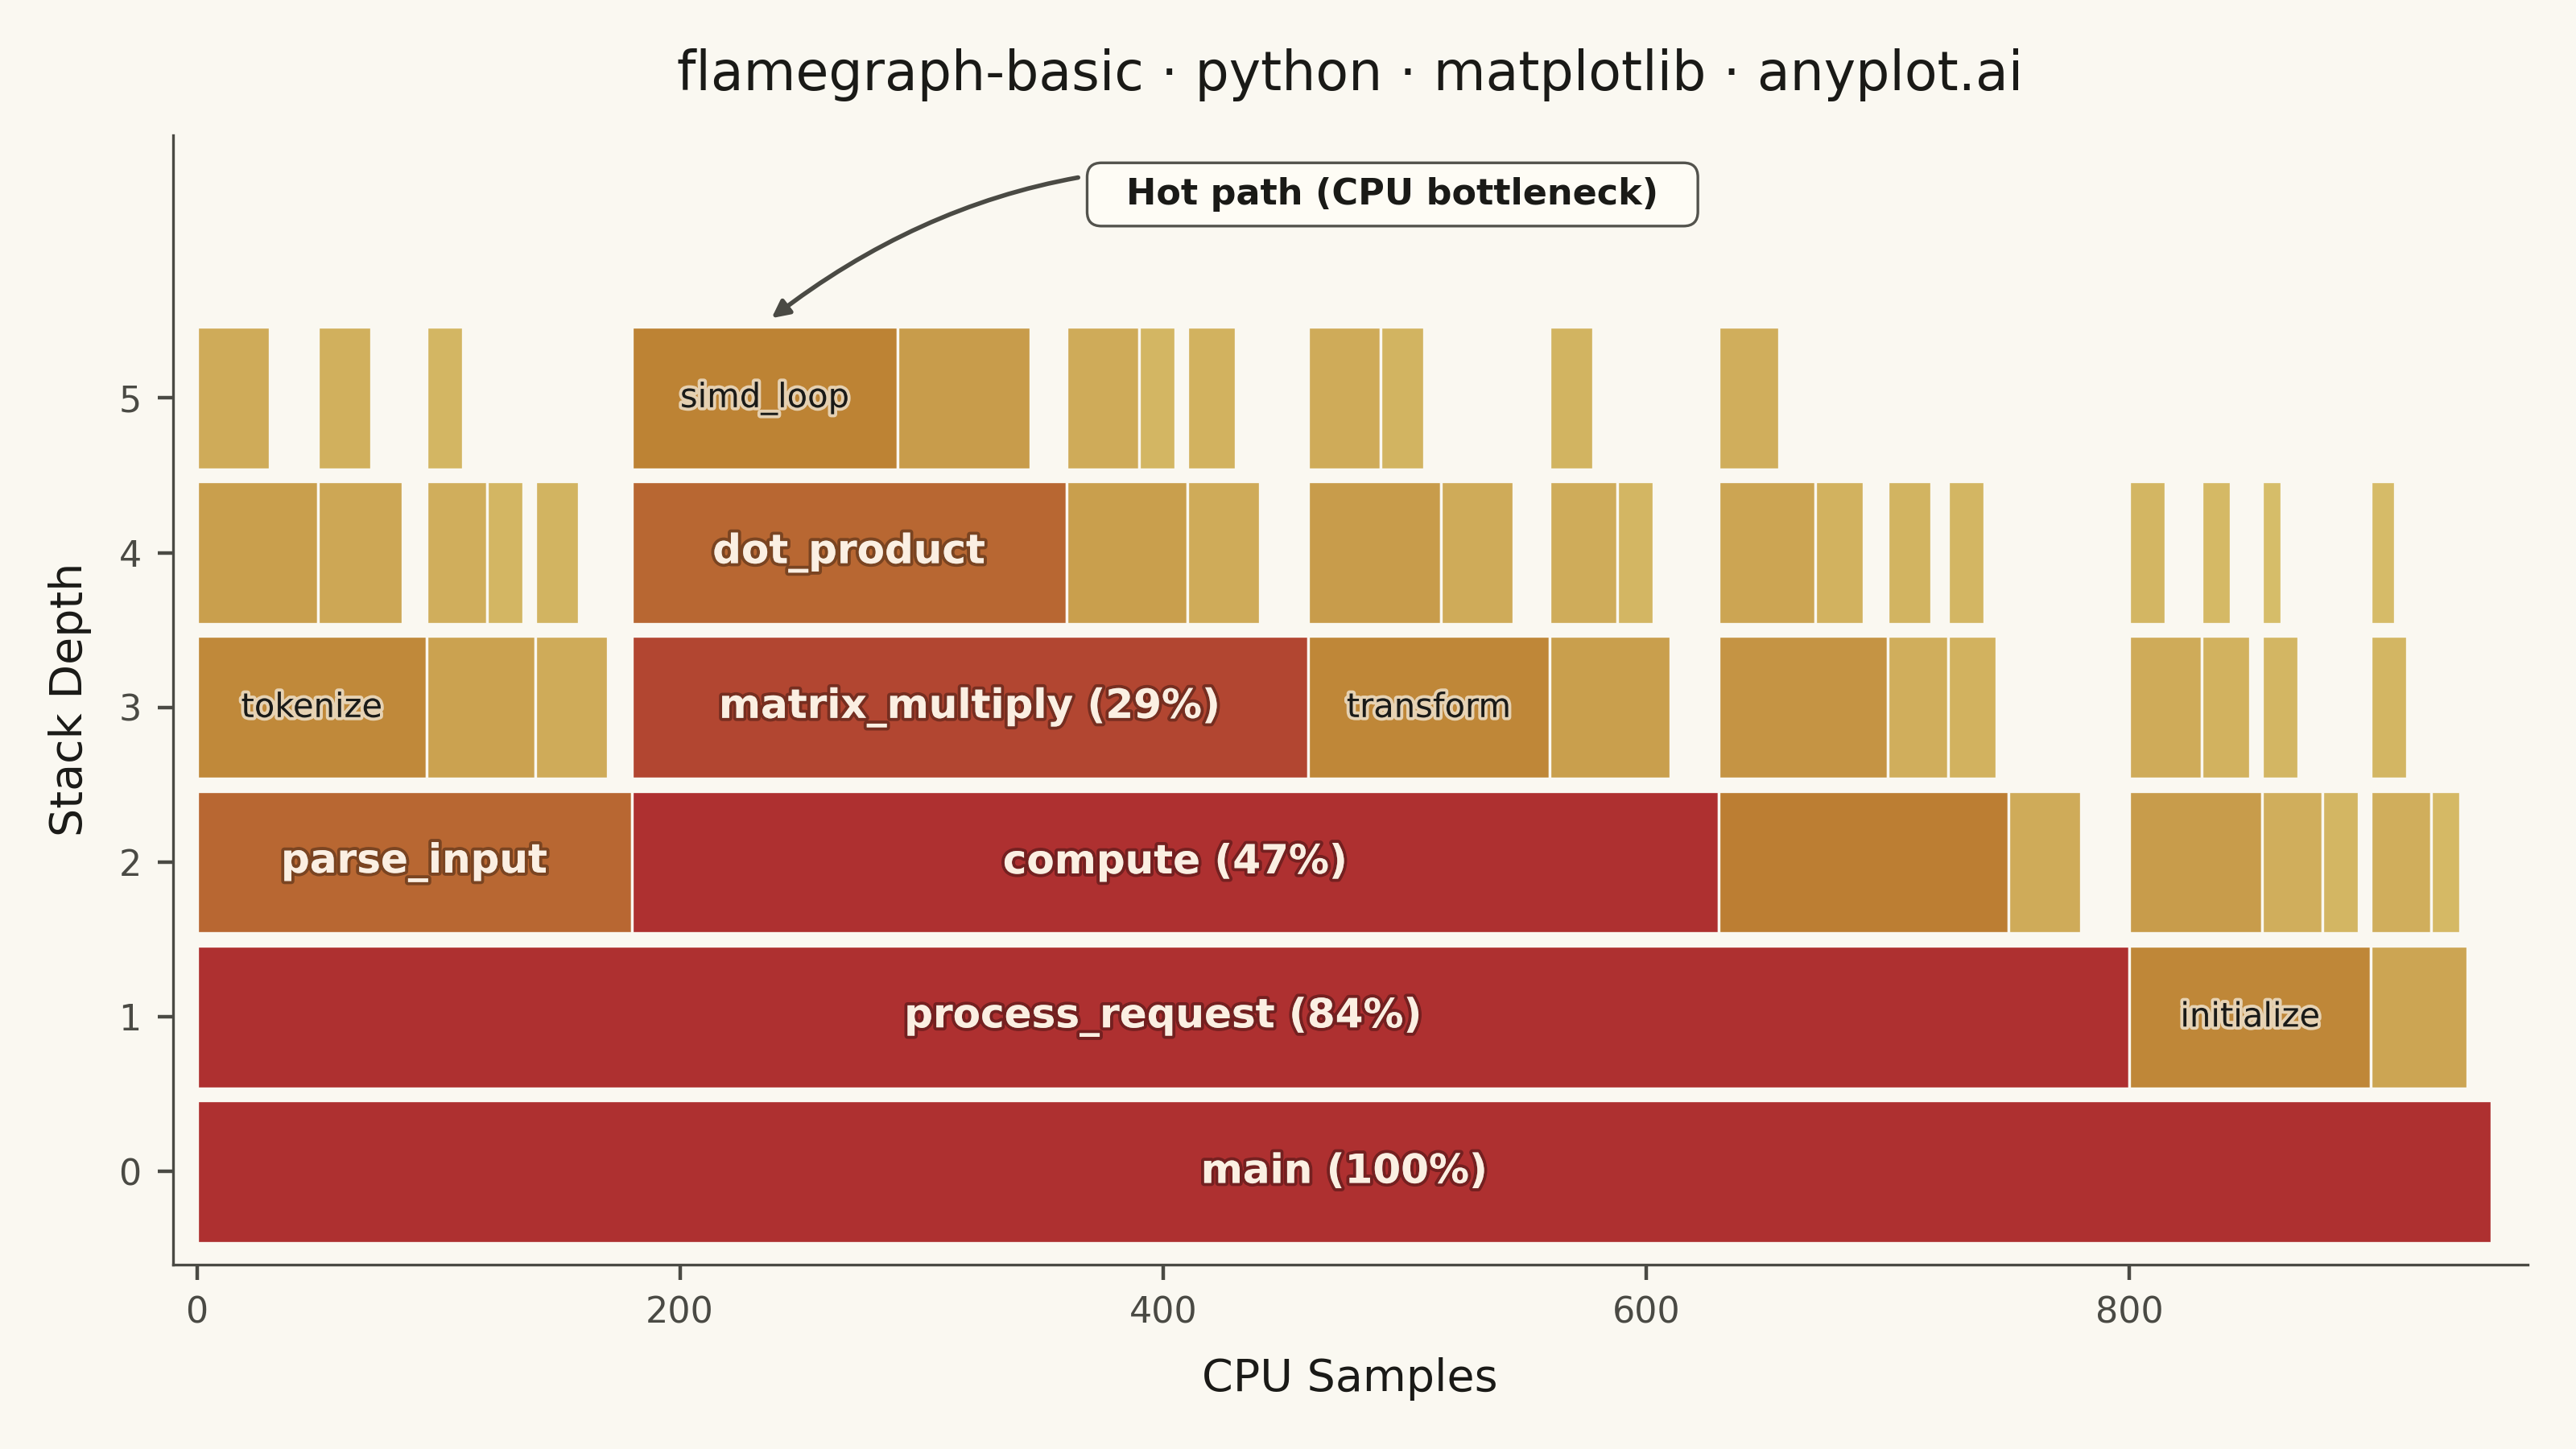
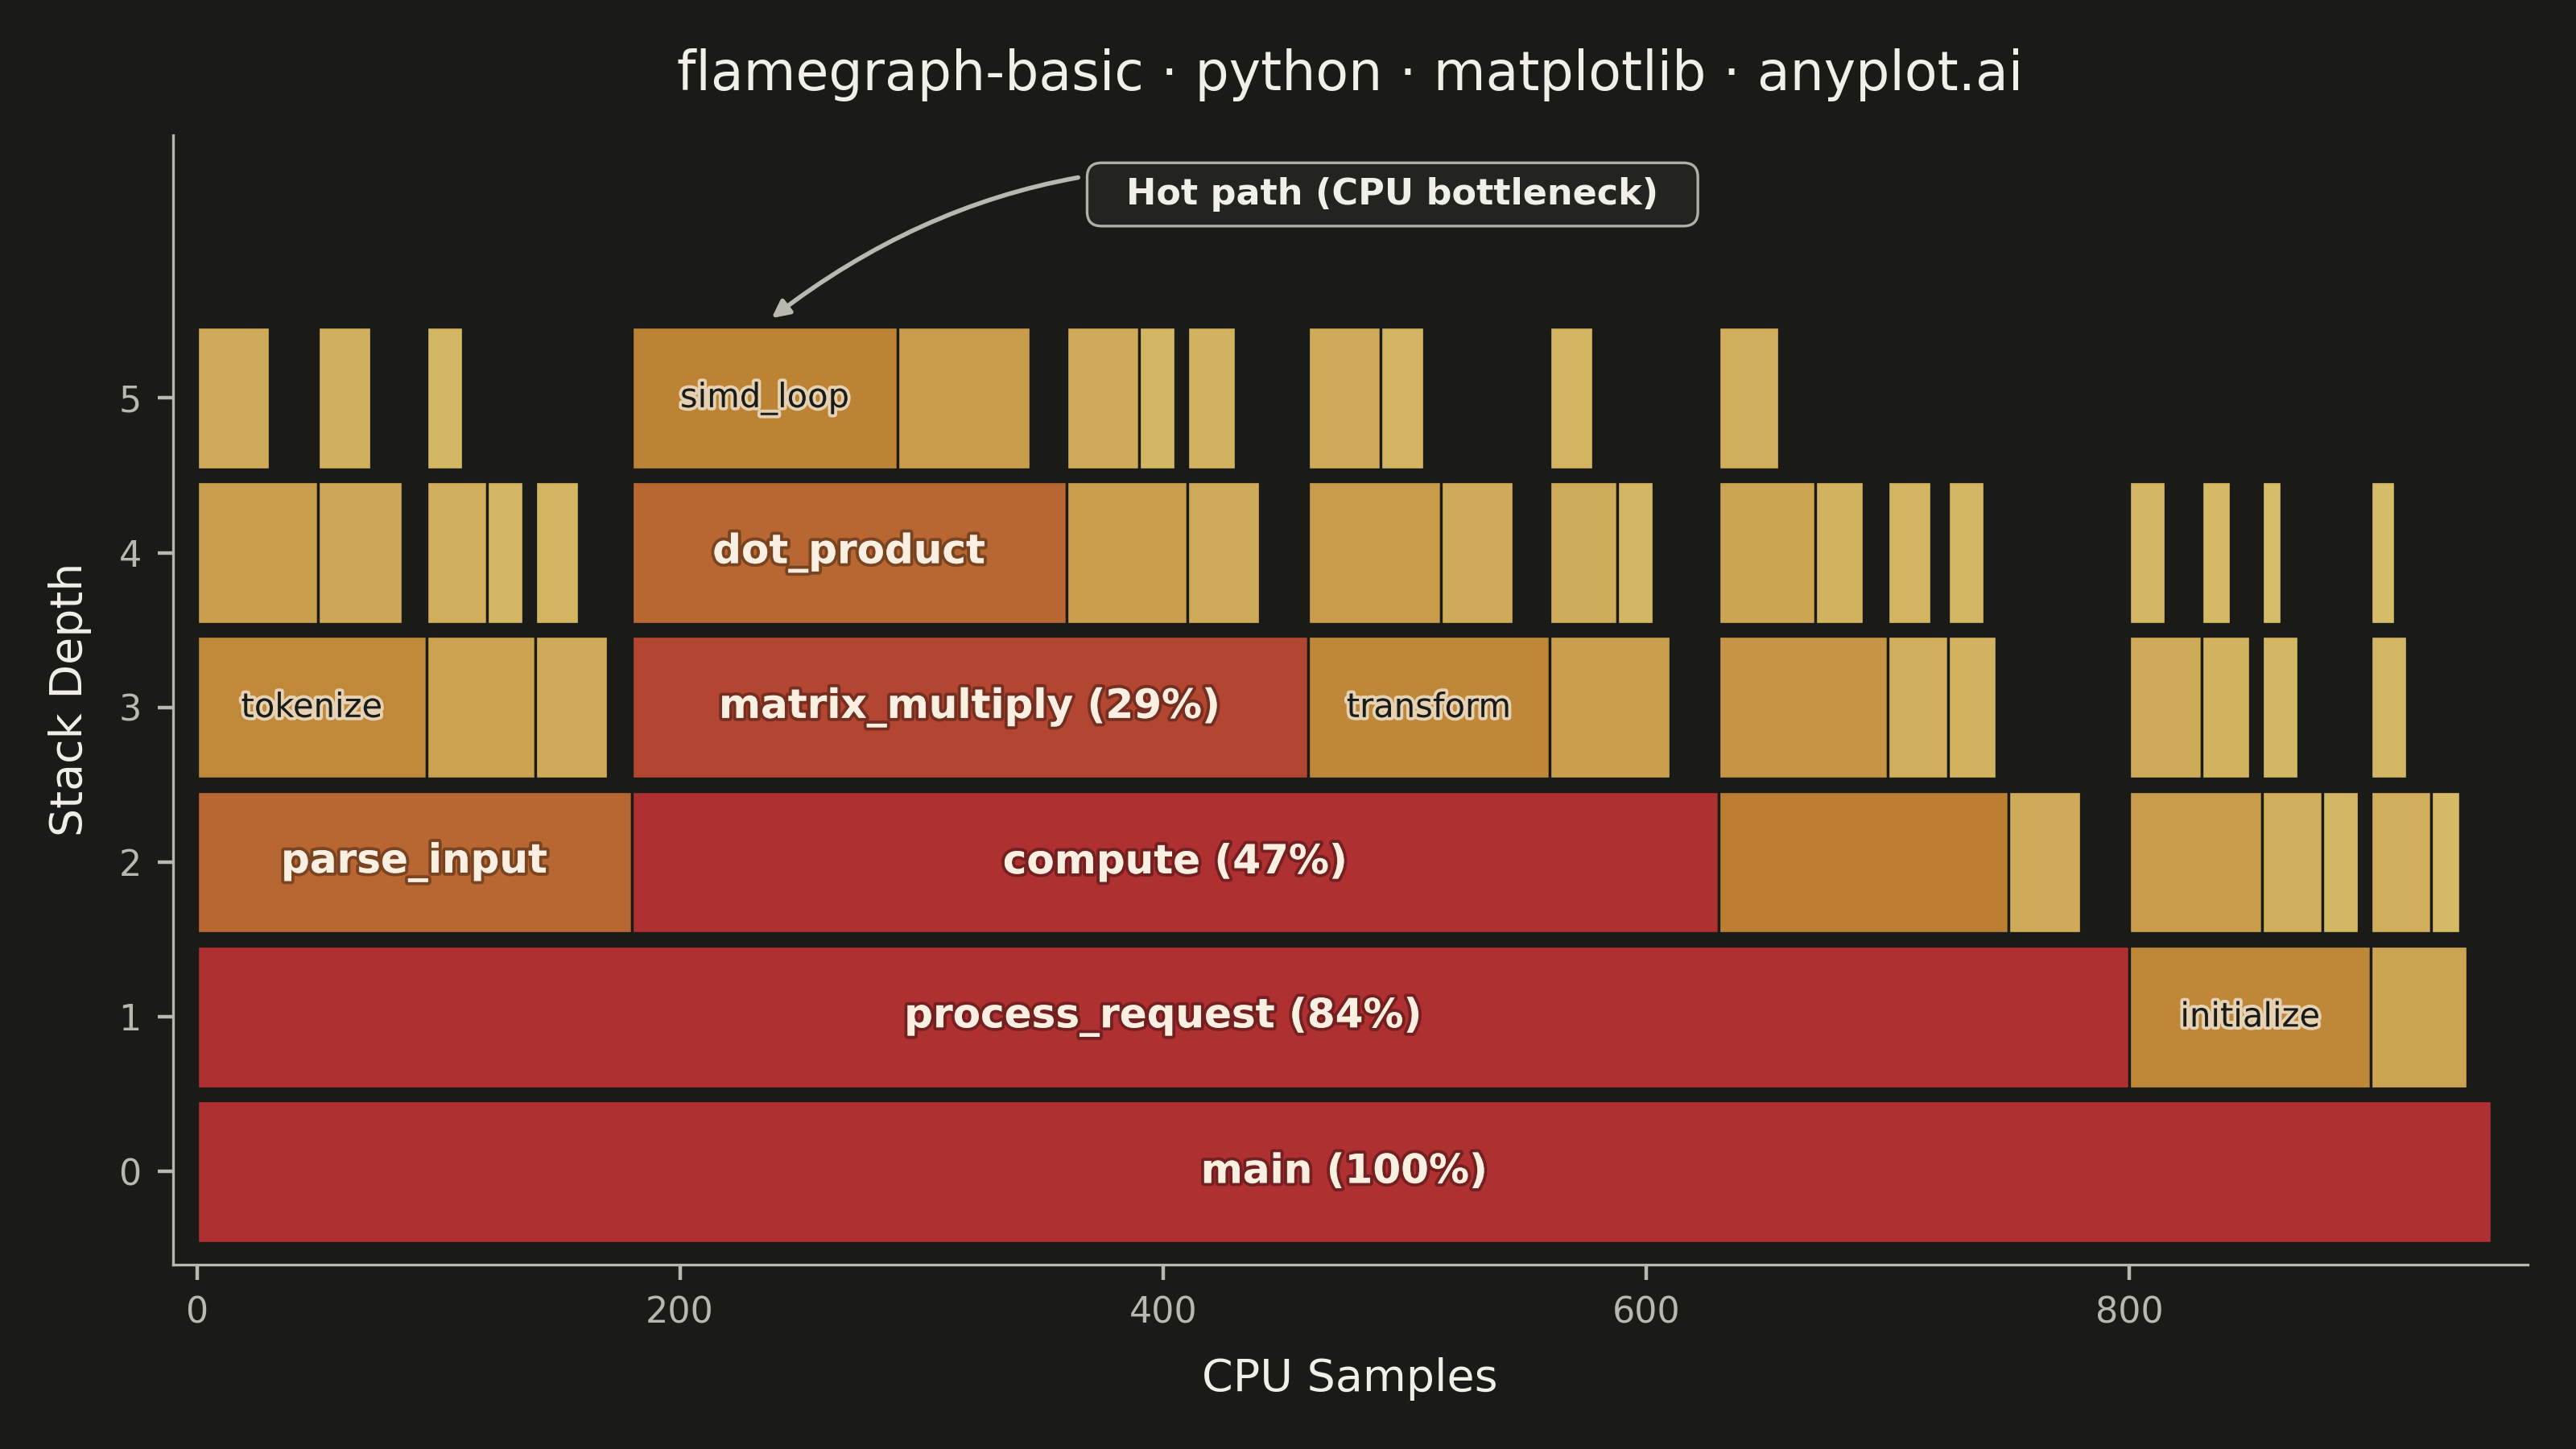
A flame graph visualizes hierarchical call stack data from performance profiling, where each horizontal bar represents a function in the call stack and its width is proportional to the time (or samples) spent in that function. Stacks are layered bottom-to-top showing caller-to-callee relationships. Invented by Brendan Gregg, flame graphs are the standard visualization for identifying CPU bottlenecks and hot code paths across all major programming languages and profiling tools.
""" anyplot.ai
flamegraph-basic: Flame Graph for Performance Profiling
Library: matplotlib 3.10.9 | Python 3.13.13
Quality: 90/100 | Updated: 2026-06-08
"""

import os

import matplotlib.colors as mcolors
import matplotlib.patches as mpatches
import matplotlib.patheffects as pe
import matplotlib.pyplot as plt
import numpy as np


# Theme tokens
THEME = os.getenv("ANYPLOT_THEME", "light")
PAGE_BG = "#FAF8F1" if THEME == "light" else "#1A1A17"
ELEVATED_BG = "#FFFDF6" if THEME == "light" else "#242420"
INK = "#1A1A17" if THEME == "light" else "#F0EFE8"
INK_SOFT = "#4A4A44" if THEME == "light" else "#B8B7B0"
INK_MUTED = "#6B6A63" if THEME == "light" else "#A8A79F"

# Warm flame palette built from Imprint anchors (amber → ochre → matte red).
# Spec calls for the conventional warm flame-graph aesthetic; these three
# stops are the Imprint palette members that map onto that convention.
WARM_AMBER = "#DDCC77"  # Imprint amber anchor (cool / low-sample)
WARM_OCHRE = "#BD8233"  # Imprint position 4 (warm midtone)
WARM_RED = "#AE3030"  # Imprint position 5 (hot / high-sample)

# Data — simulated CPU profiling stacks with sample counts.
# Depth-first ordering so each parent is inserted before its children
# (the layout loop below relies on dict insertion order).
stacks = {
    "main": 950,
    "main;process_request": 800,
    "main;process_request;parse_input": 180,
    "main;process_request;parse_input;tokenize": 95,
    "main;process_request;parse_input;tokenize;split_lines": 50,
    "main;process_request;parse_input;tokenize;split_lines;find_newline": 30,
    "main;process_request;parse_input;tokenize;regex_match": 35,
    "main;process_request;parse_input;tokenize;regex_match;nfa_run": 22,
    "main;process_request;parse_input;validate": 45,
    "main;process_request;parse_input;validate;check_schema": 25,
    "main;process_request;parse_input;validate;check_schema;lookup_field": 15,
    "main;process_request;parse_input;validate;check_types": 15,
    "main;process_request;parse_input;normalize_keys": 30,
    "main;process_request;parse_input;normalize_keys;lowercase": 18,
    "main;process_request;compute": 450,
    "main;process_request;compute;matrix_multiply": 280,
    "main;process_request;compute;matrix_multiply;dot_product": 180,
    "main;process_request;compute;matrix_multiply;dot_product;simd_loop": 110,
    "main;process_request;compute;matrix_multiply;dot_product;accumulate": 55,
    "main;process_request;compute;matrix_multiply;allocate_buffer": 50,
    "main;process_request;compute;matrix_multiply;allocate_buffer;malloc": 30,
    "main;process_request;compute;matrix_multiply;allocate_buffer;zero_memory": 15,
    "main;process_request;compute;matrix_multiply;prefetch_data": 30,
    "main;process_request;compute;matrix_multiply;prefetch_data;cache_warm": 20,
    "main;process_request;compute;transform": 100,
    "main;process_request;compute;transform;normalize": 55,
    "main;process_request;compute;transform;normalize;compute_mean": 30,
    "main;process_request;compute;transform;normalize;subtract_mean": 18,
    "main;process_request;compute;transform;scale": 30,
    "main;process_request;compute;aggregate": 50,
    "main;process_request;compute;aggregate;group_by": 28,
    "main;process_request;compute;aggregate;group_by;hash_keys": 18,
    "main;process_request;compute;aggregate;reduce": 15,
    "main;process_request;send_response": 120,
    "main;process_request;send_response;serialize": 70,
    "main;process_request;send_response;serialize;to_json": 40,
    "main;process_request;send_response;serialize;to_json;format_value": 25,
    "main;process_request;send_response;serialize;escape_strings": 20,
    "main;process_request;send_response;compress": 25,
    "main;process_request;send_response;compress;gzip_encode": 18,
    "main;process_request;send_response;write_socket": 20,
    "main;process_request;send_response;write_socket;syscall_write": 15,
    "main;process_request;log_request": 30,
    "main;initialize": 100,
    "main;initialize;load_config": 55,
    "main;initialize;load_config;read_file": 30,
    "main;initialize;load_config;read_file;open_fd": 15,
    "main;initialize;load_config;parse_yaml": 20,
    "main;initialize;load_config;parse_yaml;tokenize_yaml": 12,
    "main;initialize;setup_logging": 25,
    "main;initialize;setup_logging;open_handlers": 15,
    "main;initialize;setup_logging;open_handlers;create_socket": 8,
    "main;initialize;register_handlers": 15,
    "main;gc_collect": 40,
    "main;gc_collect;mark_phase": 25,
    "main;gc_collect;mark_phase;scan_roots": 15,
    "main;gc_collect;mark_phase;scan_roots;walk_stack": 10,
    "main;gc_collect;sweep_phase": 12,
}

total_samples = stacks["main"]

# Identify the hot path (widest child at each depth)
hot_path_stacks = {"main"}
current = "main"
while True:
    children = {
        k: v for k, v in stacks.items() if k.startswith(current + ";") and k.count(";") == current.count(";") + 1
    }
    if not children:
        break
    hottest = max(children, key=children.get)
    hot_path_stacks.add(hottest)
    current = hottest

# Build flame graph rectangles with parent offset tracking
positions = {"main": (0.0, total_samples)}
rects = []
parent_offsets = {}

for stack_path, samples in stacks.items():
    parts = stack_path.split(";")
    depth = len(parts) - 1
    func_name = parts[-1]
    is_hot = stack_path in hot_path_stacks

    if depth == 0:
        rects.append((depth, func_name, 0.0, samples, is_hot))
        continue

    parent = ";".join(parts[:-1])
    if parent not in positions:
        continue

    parent_x, _ = positions[parent]
    x_start = parent_offsets.get(parent, parent_x)
    positions[stack_path] = (x_start, samples)
    parent_offsets[parent] = x_start + samples
    rects.append((depth, func_name, x_start, samples, is_hot))

# Warm sequential cmap built from Imprint palette members
flame_cmap = mcolors.LinearSegmentedColormap.from_list("flame_imprint", [WARM_AMBER, WARM_OCHRE, WARM_RED], N=256)

# Plot — canvas 3200x1800 (figsize 8x4.5 @ dpi 400)
fig, ax = plt.subplots(figsize=(8, 4.5), dpi=400, facecolor=PAGE_BG)
ax.set_facecolor(PAGE_BG)

bar_height = 0.92
max_depth = max(r[0] for r in rects)

# Heuristic for whether a label fits inside its bar width (in data units).
# Axes width ≈ 82% of figsize width; x-axis spans `total_samples + 25`.
# A character at fontsize N occupies ~N * 0.55 / 72 inches horizontally.
samples_per_inch = (total_samples + 25) / (8 * 0.82)

for depth, func_name, x_start, width, _is_hot in rects:
    proportion = width / total_samples
    color_val = np.clip(proportion**0.6 * 1.8, 0.05, 1.0)
    color = flame_cmap(color_val)

    rect = mpatches.Rectangle(
        (x_start, depth - bar_height / 2),
        width,
        bar_height,
        facecolor=color,
        edgecolor=PAGE_BG,
        linewidth=0.6,
        zorder=2,
    )
    ax.add_patch(rect)

    bar_fraction = width / total_samples
    if bar_fraction < 0.04:
        continue

    fontsize = 9 if bar_fraction > 0.18 else 7.5
    fontweight = "bold" if bar_fraction > 0.18 else "medium"
    char_w_samples = fontsize * 0.55 / 72 * samples_per_inch

    # Try name + percentage first; fall back to name only; skip if neither fits.
    candidate = f"{func_name} ({bar_fraction:.0%})"
    if len(candidate) * char_w_samples > width * 0.92:
        candidate = func_name
    if len(candidate) * char_w_samples > width * 0.92:
        continue
    label = candidate

    # Light text on the darker (red) end of the cmap, dark text on the
    # lighter (amber/ochre) end — data colors are theme-independent so
    # this decision uses color_val, not THEME.
    light_bar = color_val < 0.6
    text_color = "#1A1A17" if light_bar else "#FBEFE2"
    stroke_color = "#FAF8F1AA" if light_bar else "#00000055"
    path_effects = [pe.withStroke(linewidth=1.4, foreground=stroke_color)]

    ax.text(
        x_start + width / 2,
        depth,
        label,
        ha="center",
        va="center",
        fontsize=fontsize,
        fontweight=fontweight,
        color=text_color,
        clip_on=True,
        path_effects=path_effects,
        zorder=5,
    )

# Hot path annotation pointing to the deepest hot path bar
hot_leaf = max((r for r in rects if r[4]), key=lambda r: r[0])
leaf_cx = hot_leaf[2] + hot_leaf[3] / 2
ax.annotate(
    "  Hot path (CPU bottleneck)  ",
    xy=(leaf_cx, hot_leaf[0] + bar_height / 2 + 0.02),
    xytext=(leaf_cx + 260, hot_leaf[0] + 1.25),
    fontsize=8,
    fontweight="semibold",
    color=INK,
    ha="center",
    arrowprops={"arrowstyle": "-|>", "color": INK_SOFT, "lw": 1.0, "connectionstyle": "arc3,rad=0.25"},
    bbox={
        "boxstyle": "round,pad=0.4",
        "facecolor": ELEVATED_BG,
        "edgecolor": INK_SOFT,
        "alpha": 0.95,
        "linewidth": 0.6,
    },
    zorder=10,
)

# Style
ax.set_xlim(-10, total_samples + 15)
ax.set_ylim(-0.6, max_depth + 1.7)
ax.set_xlabel("CPU Samples", fontsize=10, color=INK, labelpad=6)
ax.set_ylabel("Stack Depth", fontsize=10, color=INK, labelpad=6)
ax.set_title("flamegraph-basic · python · matplotlib · anyplot.ai", fontsize=12, fontweight="medium", pad=10, color=INK)
ax.tick_params(axis="both", labelsize=8, colors=INK_SOFT)
ax.set_yticks(range(max_depth + 1))
ax.spines["top"].set_visible(False)
ax.spines["right"].set_visible(False)
for s in ("left", "bottom"):
    ax.spines[s].set_linewidth(0.6)
    ax.spines[s].set_color(INK_SOFT)

plt.tight_layout()
# Do NOT use bbox_inches="tight" — it would shave the canvas off-target.
plt.savefig(f"plot-{THEME}.png", dpi=400, facecolor=PAGE_BG)
Runnable source as JSON, for any HTTP client: https://api.anyplot.ai/specs/flamegraph-basic/matplotlib/code. Any spec id and library id listed in llms-full.txt fit the same URL shape; every URL below is complete and callable.
{
  "spec_id": "flamegraph-basic",
  "language": "python",
  "library": "matplotlib",
  "page": "https://anyplot.ai/flamegraph-basic/python/matplotlib",
  "hub": "https://anyplot.ai/flamegraph-basic",
  "code_json": "https://api.anyplot.ai/specs/flamegraph-basic/matplotlib/code",
  "spec_json": "https://api.anyplot.ai/specs/flamegraph-basic",
  "render_light_png": "https://storage.googleapis.com/anyplot-images/plots/flamegraph-basic/python/matplotlib/plot-light.png",
  "render_dark_png": "https://storage.googleapis.com/anyplot-images/plots/flamegraph-basic/python/matplotlib/plot-dark.png",
  "quality_score": 90.0,
  "license": "MIT",
  "guide": "https://anyplot.ai/llms.txt"
}
Part of Flame Graph for Performance Profiling on anyplot.ai.