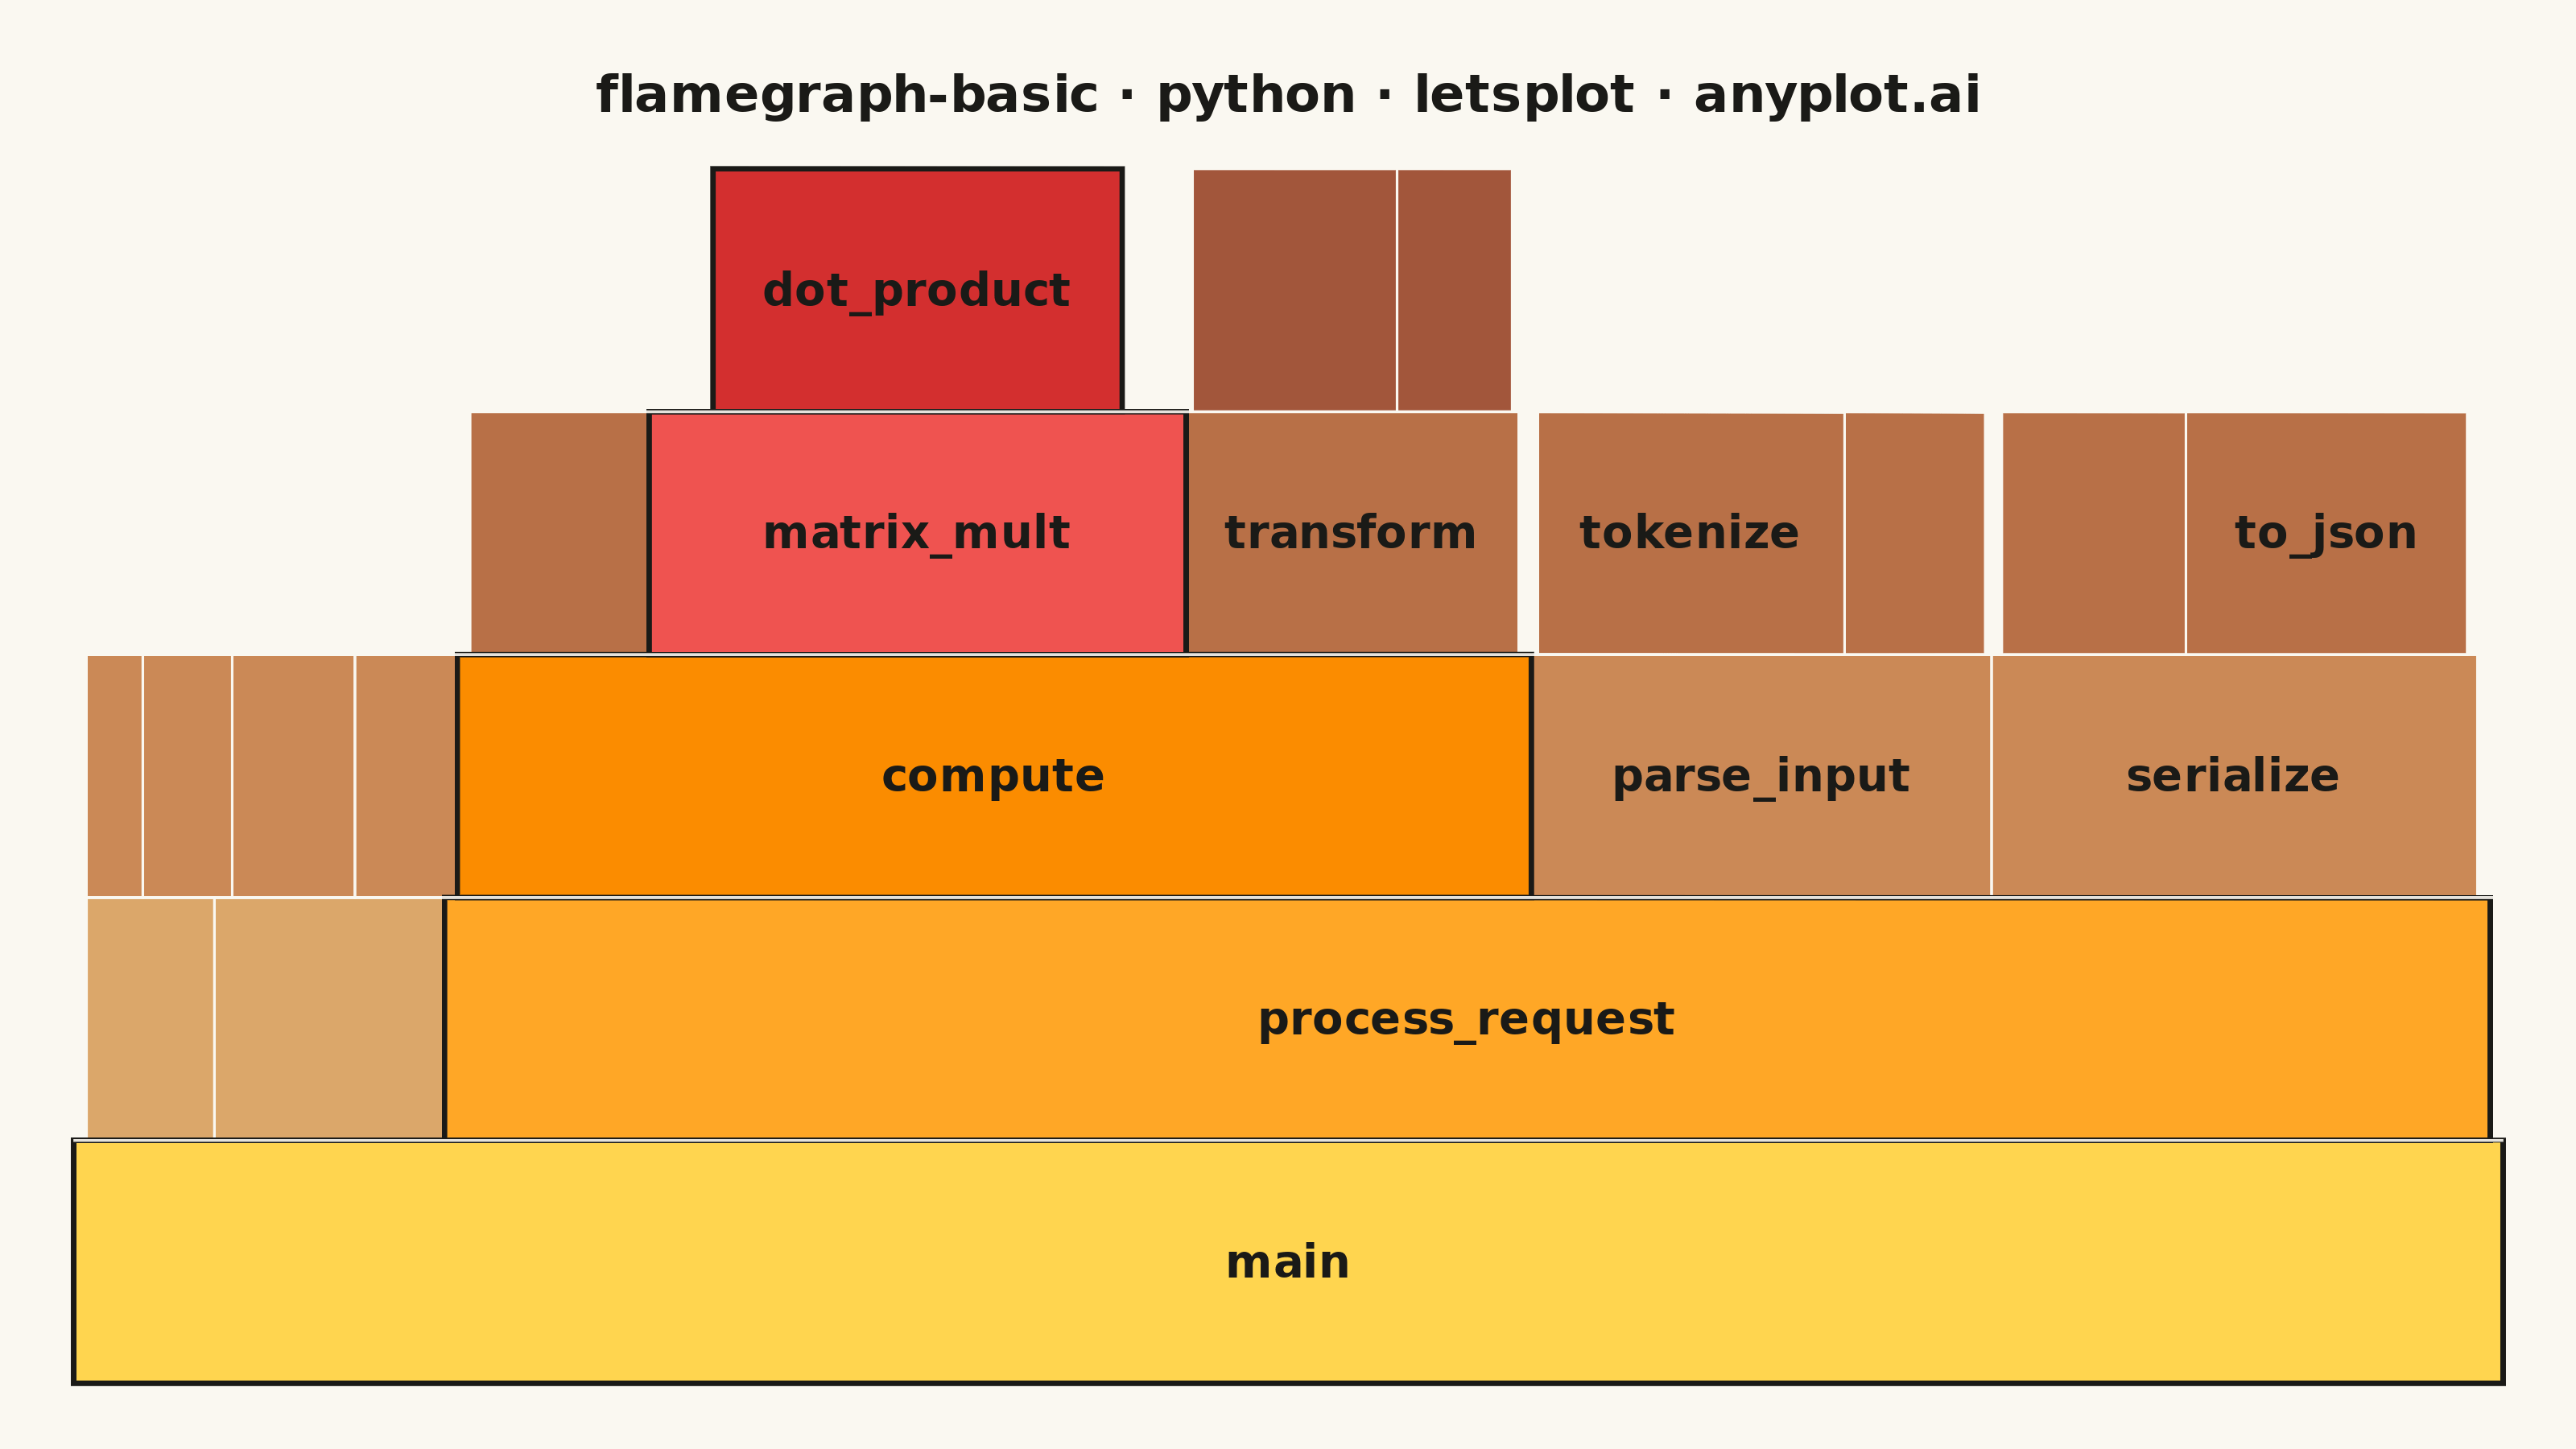
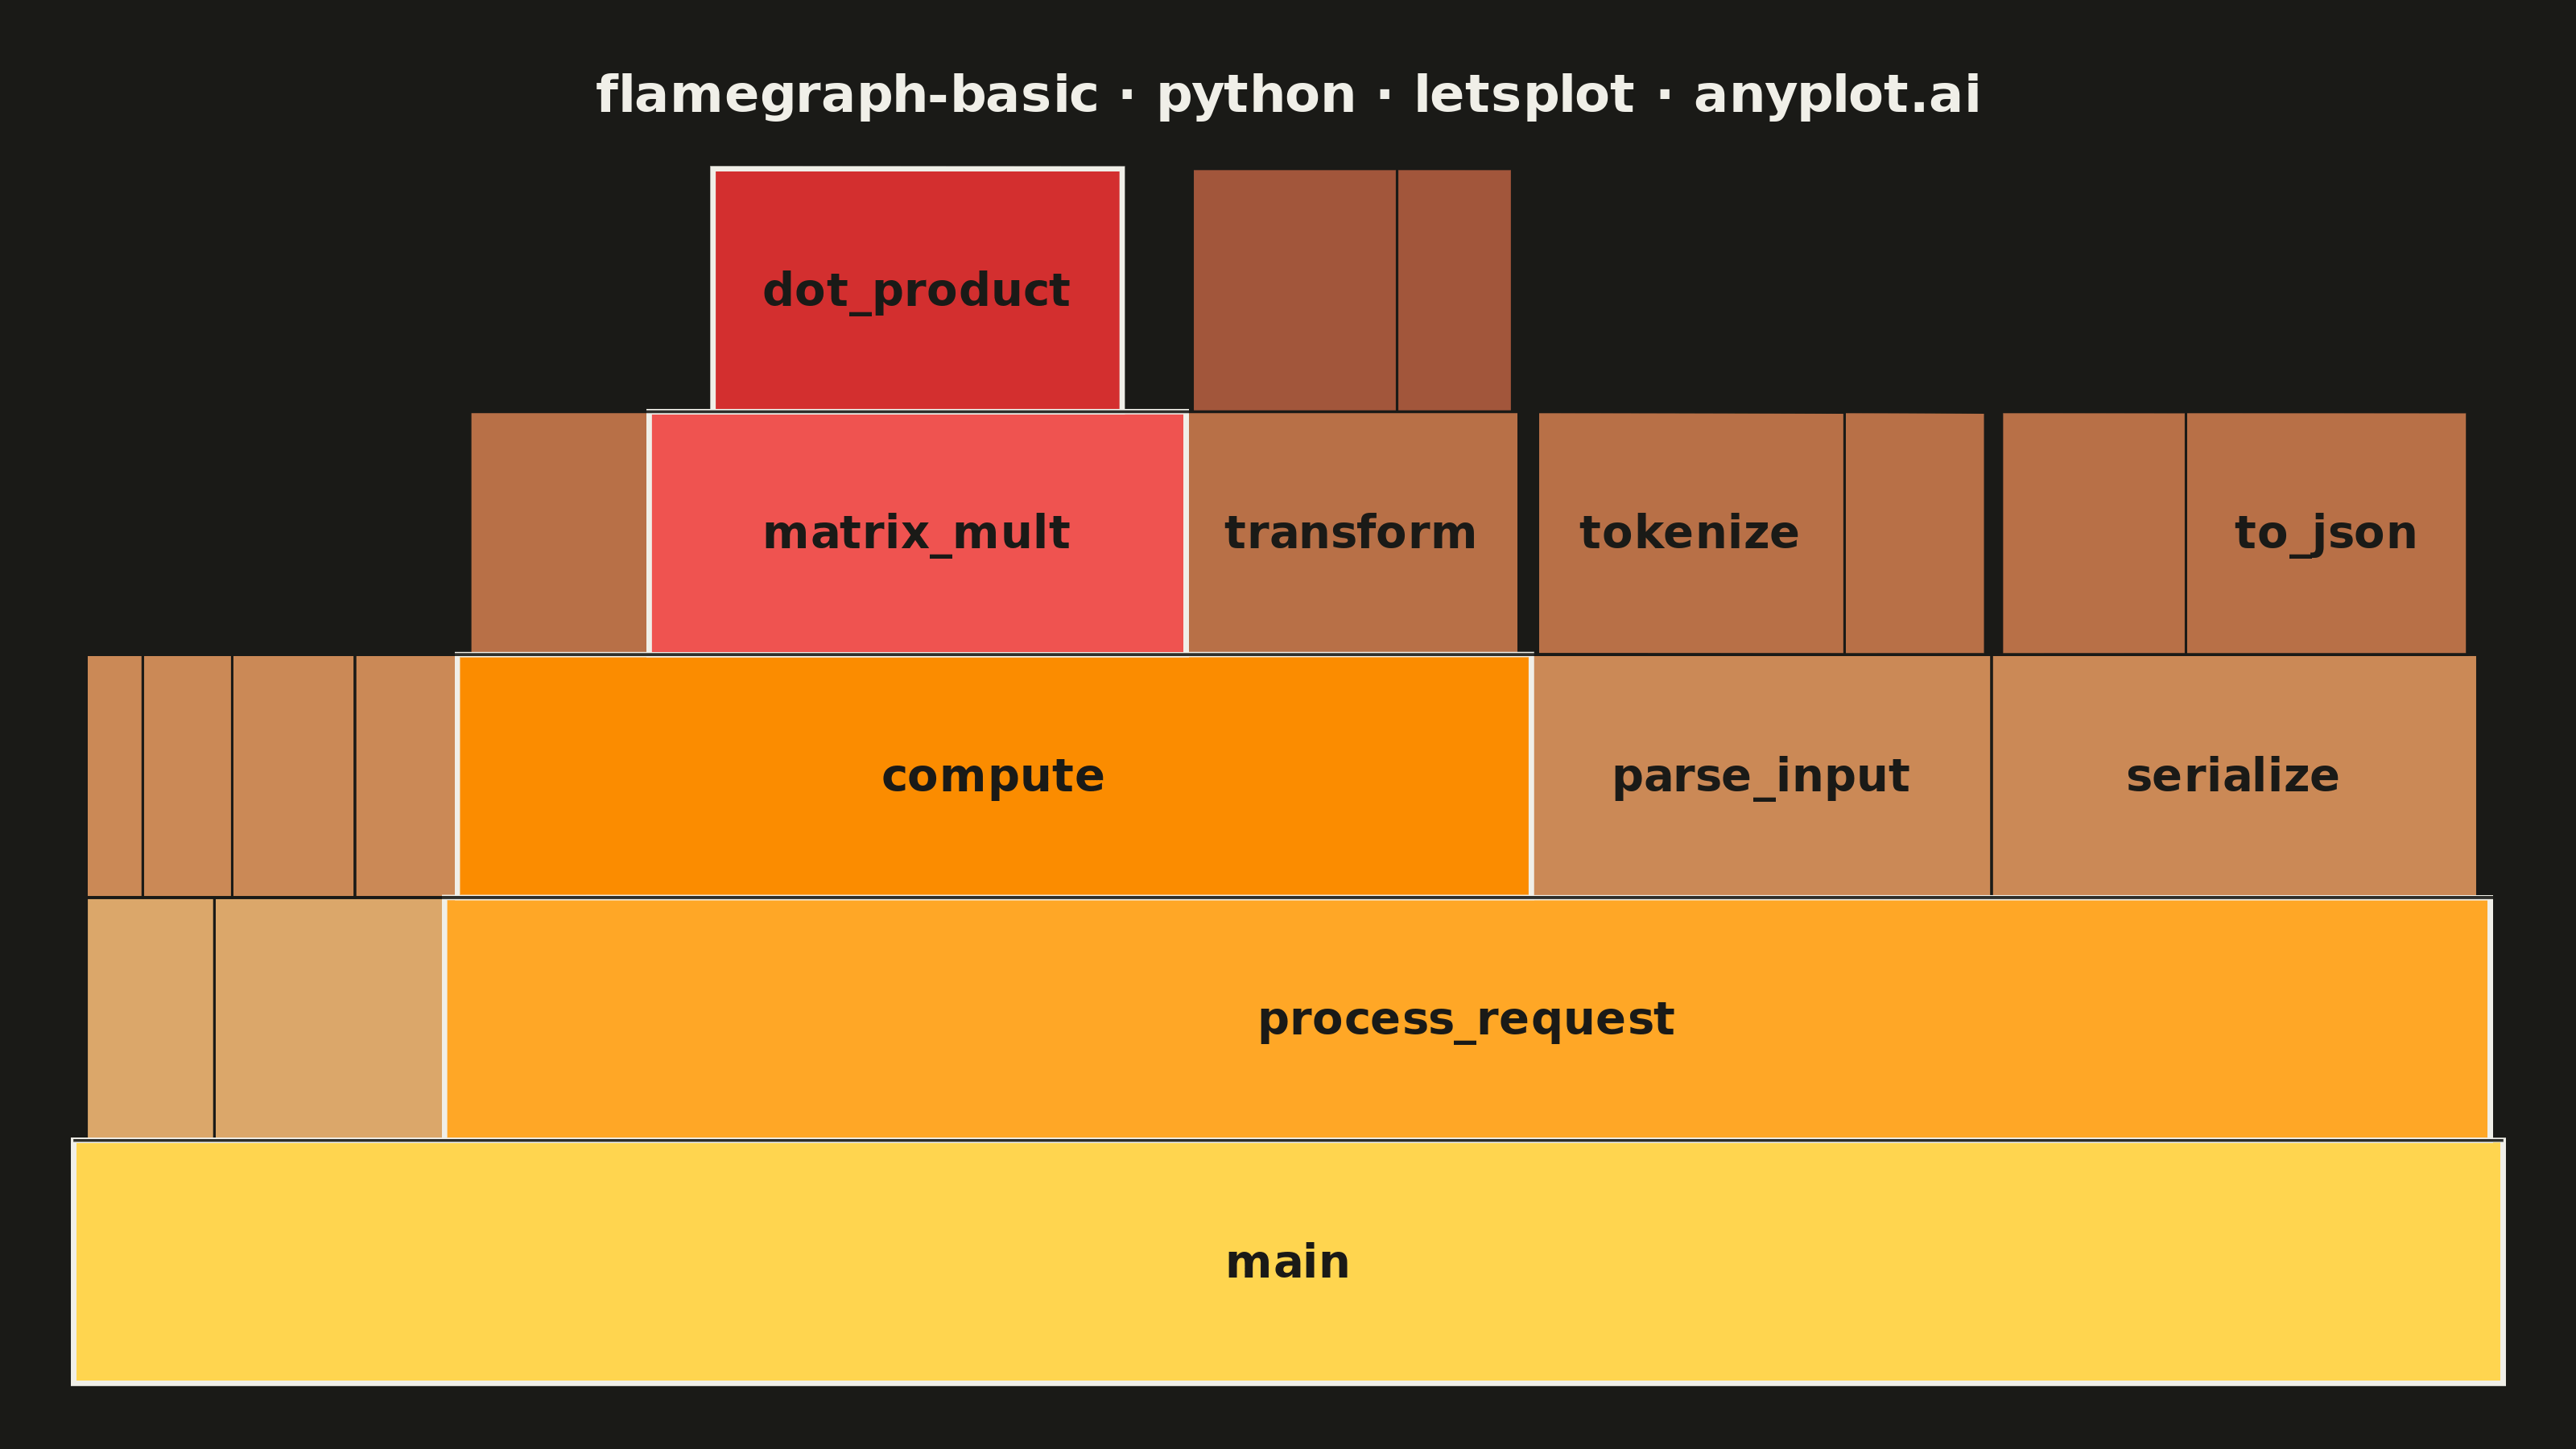
A flame graph visualizes hierarchical call stack data from performance profiling, where each horizontal bar represents a function in the call stack and its width is proportional to the time (or samples) spent in that function. Stacks are layered bottom-to-top showing caller-to-callee relationships. Invented by Brendan Gregg, flame graphs are the standard visualization for identifying CPU bottlenecks and hot code paths across all major programming languages and profiling tools.
""" anyplot.ai
flamegraph-basic: Flame Graph for Performance Profiling
Library: letsplot 4.10.1 | Python 3.13.13
Quality: 90/100 | Updated: 2026-06-08
"""

import os

import numpy as np
import pandas as pd
from lets_plot import (
    LetsPlot,
    aes,
    coord_cartesian,
    element_blank,
    element_rect,
    element_text,
    geom_rect,
    geom_segment,
    geom_text,
    ggplot,
    ggsize,
    labs,
    layer_tooltips,
    scale_fill_identity,
    scale_x_continuous,
    scale_y_continuous,
    theme,
    theme_void,
)
from lets_plot.export import ggsave


LetsPlot.setup_html()

# Theme tokens (see prompts/default-style-guide.md "Theme-adaptive Chrome")
THEME = os.getenv("ANYPLOT_THEME", "light")
PAGE_BG = "#FAF8F1" if THEME == "light" else "#1A1A17"
INK = "#1A1A17" if THEME == "light" else "#F0EFE8"

# Data - simulated CPU profiling stacks with sample counts
np.random.seed(42)

stacks = {
    "main": 950,
    "main;process_request": 800,
    "main;process_request;parse_input": 180,
    "main;process_request;parse_input;tokenize": 120,
    "main;process_request;parse_input;validate": 55,
    "main;process_request;compute": 420,
    "main;process_request;compute;matrix_mult": 210,
    "main;process_request;compute;matrix_mult;dot_product": 160,
    "main;process_request;compute;transform": 130,
    "main;process_request;compute;transform;normalize": 80,
    "main;process_request;compute;transform;scale": 45,
    "main;process_request;compute;aggregate": 70,
    "main;process_request;serialize": 190,
    "main;process_request;serialize;to_json": 110,
    "main;process_request;serialize;compress": 72,
    "main;init_config": 90,
    "main;init_config;load_file": 55,
    "main;init_config;parse_yaml": 40,
    "main;cleanup": 50,
    "main;cleanup;flush_cache": 35,
    "main;cleanup;close_conn": 22,
}

# Build child map and stack positions
total_samples = stacks["main"]

children_map = {}
for stack_path in stacks:
    parts = stack_path.split(";")
    if len(parts) > 1:
        parent = ";".join(parts[:-1])
        children_map.setdefault(parent, []).append((stack_path, stacks[stack_path]))

positions = {"main": (0.0, float(total_samples))}
queue = ["main"]
while queue:
    current = queue.pop(0)
    parent_xmin, parent_xmax = positions[current]
    if current in children_map:
        kids = sorted(children_map[current], key=lambda x: x[0])
        child_total = sum(s for _, s in kids)
        parent_samples = stacks[current]
        self_time = parent_samples - child_total
        parent_width = parent_xmax - parent_xmin
        bar_scale = parent_width / parent_samples
        x_cursor = parent_xmin + (self_time * bar_scale * 0.5 if self_time > 0 else 0)
        for child_path, child_samples in kids:
            child_width = child_samples * bar_scale
            positions[child_path] = (x_cursor, x_cursor + child_width)
            x_cursor += child_width
            queue.append(child_path)

# Identify the hottest code path (widest bar at each depth from root)
hot_path = {"main"}
current_path = "main"
while current_path in children_map:
    hottest = max(children_map[current_path], key=lambda x: x[1])
    hot_path.add(hottest[0])
    current_path = hottest[0]

# Build rectangles
records = []
max_depth = 0
for stack_path, samples in stacks.items():
    parts = stack_path.split(";")
    depth = len(parts) - 1
    max_depth = max(max_depth, depth)
    xmin, xmax = positions[stack_path]
    records.append(
        {
            "xmin": xmin,
            "xmax": xmax,
            "ymin": depth,
            "ymax": depth + 1.0,
            "func": parts[-1],
            "depth": depth,
            "samples": samples,
            "pct": round(samples / total_samples * 100, 1),
            "stack": stack_path,
            "is_hot": stack_path in hot_path,
        }
    )

df = pd.DataFrame(records)

# Warm flame palette (spec calls for warm yellows/oranges/reds — semantic exception).
# Hot path uses saturated steps; non-hot path uses mid-luminance dusty warms that
# stay readable on both #FAF8F1 and #1A1A17 surfaces. Data colors are identical
# across themes — only chrome (text/borders/background) flips.
flame_hot = ["#FFD54F", "#FFA726", "#FB8C00", "#EF5350", "#D32F2F"]
flame_cool = ["#E8C580", "#DBA76A", "#CB8956", "#B87047", "#A2563B"]
df["color"] = df.apply(
    lambda r: (
        flame_hot[min(r["depth"], len(flame_hot) - 1)]
        if r["is_hot"]
        else flame_cool[min(r["depth"], len(flame_cool) - 1)]
    ),
    axis=1,
)

# Label: only render when the bar is wide enough to fully contain the function name
# (per spec: "Include function name labels inside bars when the bar is wide enough
# to fit the text"). Calibrated for geom_text size=7 in this coord system — each
# character occupies ~13 sample-units of width when rendered.
char_width_units = total_samples * 0.013
df["label"] = df.apply(
    lambda r: r["func"] if (r["xmax"] - r["xmin"]) >= len(r["func"]) * char_width_units else "", axis=1
)

df["label_x"] = (df["xmin"] + df["xmax"]) / 2
df["label_y"] = (df["ymin"] + df["ymax"]) / 2

# Layered rendering: cool bars first, hot bars on top
df_cool = df[~df["is_hot"]].copy()
df_hot = df[df["is_hot"]].copy()

# Depth separator lines (drawn in PAGE_BG so they read as subtle gaps on either theme)
depth_lines = pd.DataFrame(
    {
        "y": [float(d) for d in range(1, max_depth + 1)],
        "xstart": [0.0] * max_depth,
        "xend": [float(total_samples)] * max_depth,
    }
)

# Plot
plot = (
    ggplot()
    + geom_rect(
        aes(xmin="xmin", xmax="xmax", ymin="ymin", ymax="ymax", fill="color"),
        data=df_cool,
        color=PAGE_BG,
        size=0.3,
        tooltips=layer_tooltips()
        .title("@func")
        .line("Samples: @samples")
        .line("Percentage: @pct%")
        .line("Stack: @stack"),
    )
    + geom_rect(
        aes(xmin="xmin", xmax="xmax", ymin="ymin", ymax="ymax", fill="color"),
        data=df_hot,
        color=INK,
        size=0.7,
        tooltips=layer_tooltips()
        .title("@func")
        .line("Samples: @samples")
        .line("Percentage: @pct%")
        .line("Stack: @stack"),
    )
    + geom_segment(aes(x="xstart", xend="xend", y="y", yend="y"), data=depth_lines, color=PAGE_BG, size=0.35, alpha=0.9)
    + geom_text(
        aes(x="label_x", y="label_y", label="label"),
        data=df,
        size=7,
        color="#1A1A17",
        fontface="bold",
        label_padding=0.15,
    )
    + scale_fill_identity()
    + scale_x_continuous(expand=[0.005, 0])
    + scale_y_continuous(expand=[0.02, 0])
    + coord_cartesian(ylim=[-0.1, max_depth + 1.15])
    + labs(title="flamegraph-basic · python · letsplot · anyplot.ai")
    + theme_void()
    + theme(
        plot_title=element_text(size=16, face="bold", color=INK, hjust=0.5),
        plot_background=element_rect(fill=PAGE_BG, color=PAGE_BG),
        axis_text=element_blank(),
        axis_ticks=element_blank(),
        axis_line=element_blank(),
        plot_margin=[22, 16, 10, 16],
    )
    + ggsize(800, 450)
)

# Save - canvas: ggsize(800, 450) * scale=4 -> 3200x1800 px
ggsave(plot, f"plot-{THEME}.png", path=".", scale=4)
ggsave(plot, f"plot-{THEME}.html", path=".")
Runnable source as JSON, for any HTTP client: https://api.anyplot.ai/specs/flamegraph-basic/letsplot/code. Any spec id and library id listed in llms-full.txt fit the same URL shape; every URL below is complete and callable.
{
  "spec_id": "flamegraph-basic",
  "language": "python",
  "library": "letsplot",
  "page": "https://anyplot.ai/flamegraph-basic/python/letsplot",
  "hub": "https://anyplot.ai/flamegraph-basic",
  "code_json": "https://api.anyplot.ai/specs/flamegraph-basic/letsplot/code",
  "spec_json": "https://api.anyplot.ai/specs/flamegraph-basic",
  "render_light_png": "https://storage.googleapis.com/anyplot-images/plots/flamegraph-basic/python/letsplot/plot-light.png",
  "render_dark_png": "https://storage.googleapis.com/anyplot-images/plots/flamegraph-basic/python/letsplot/plot-dark.png",
  "interactive_light_html": "https://storage.googleapis.com/anyplot-images/plots/flamegraph-basic/python/letsplot/plot-light.html",
  "interactive_dark_html": "https://storage.googleapis.com/anyplot-images/plots/flamegraph-basic/python/letsplot/plot-dark.html",
  "quality_score": 90.0,
  "license": "MIT",
  "guide": "https://anyplot.ai/llms.txt"
}
Part of Flame Graph for Performance Profiling on anyplot.ai.