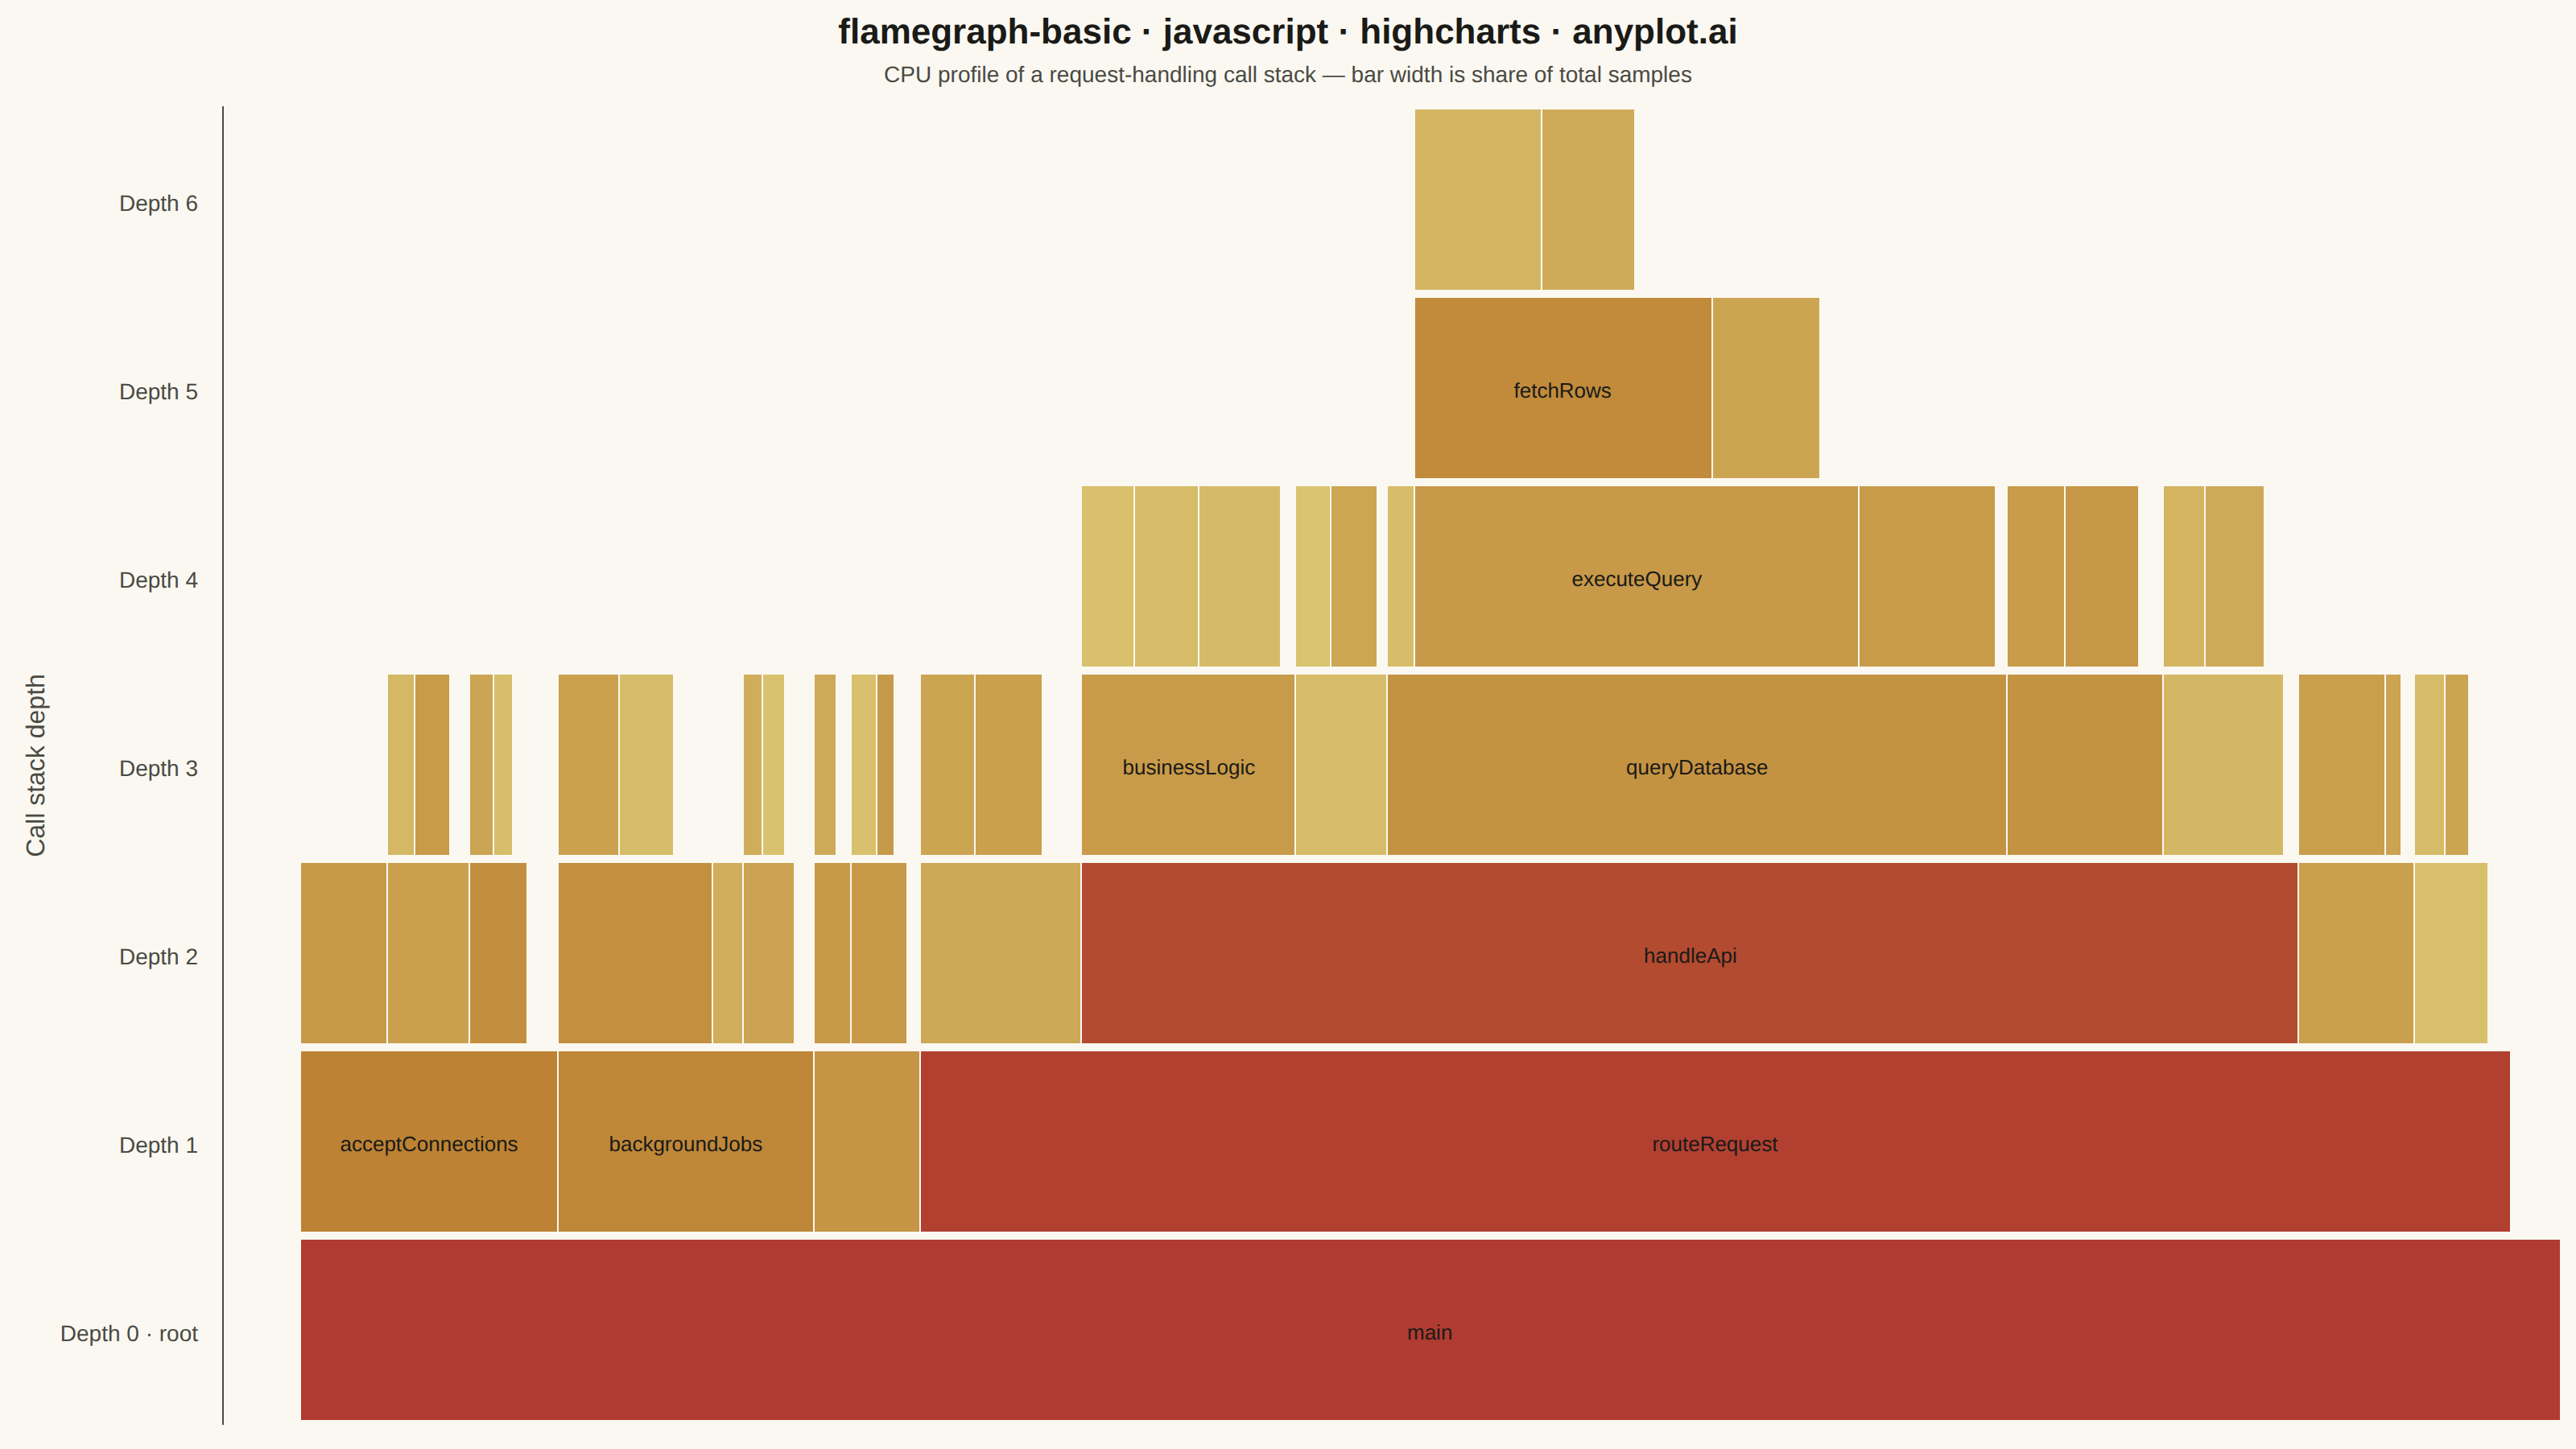
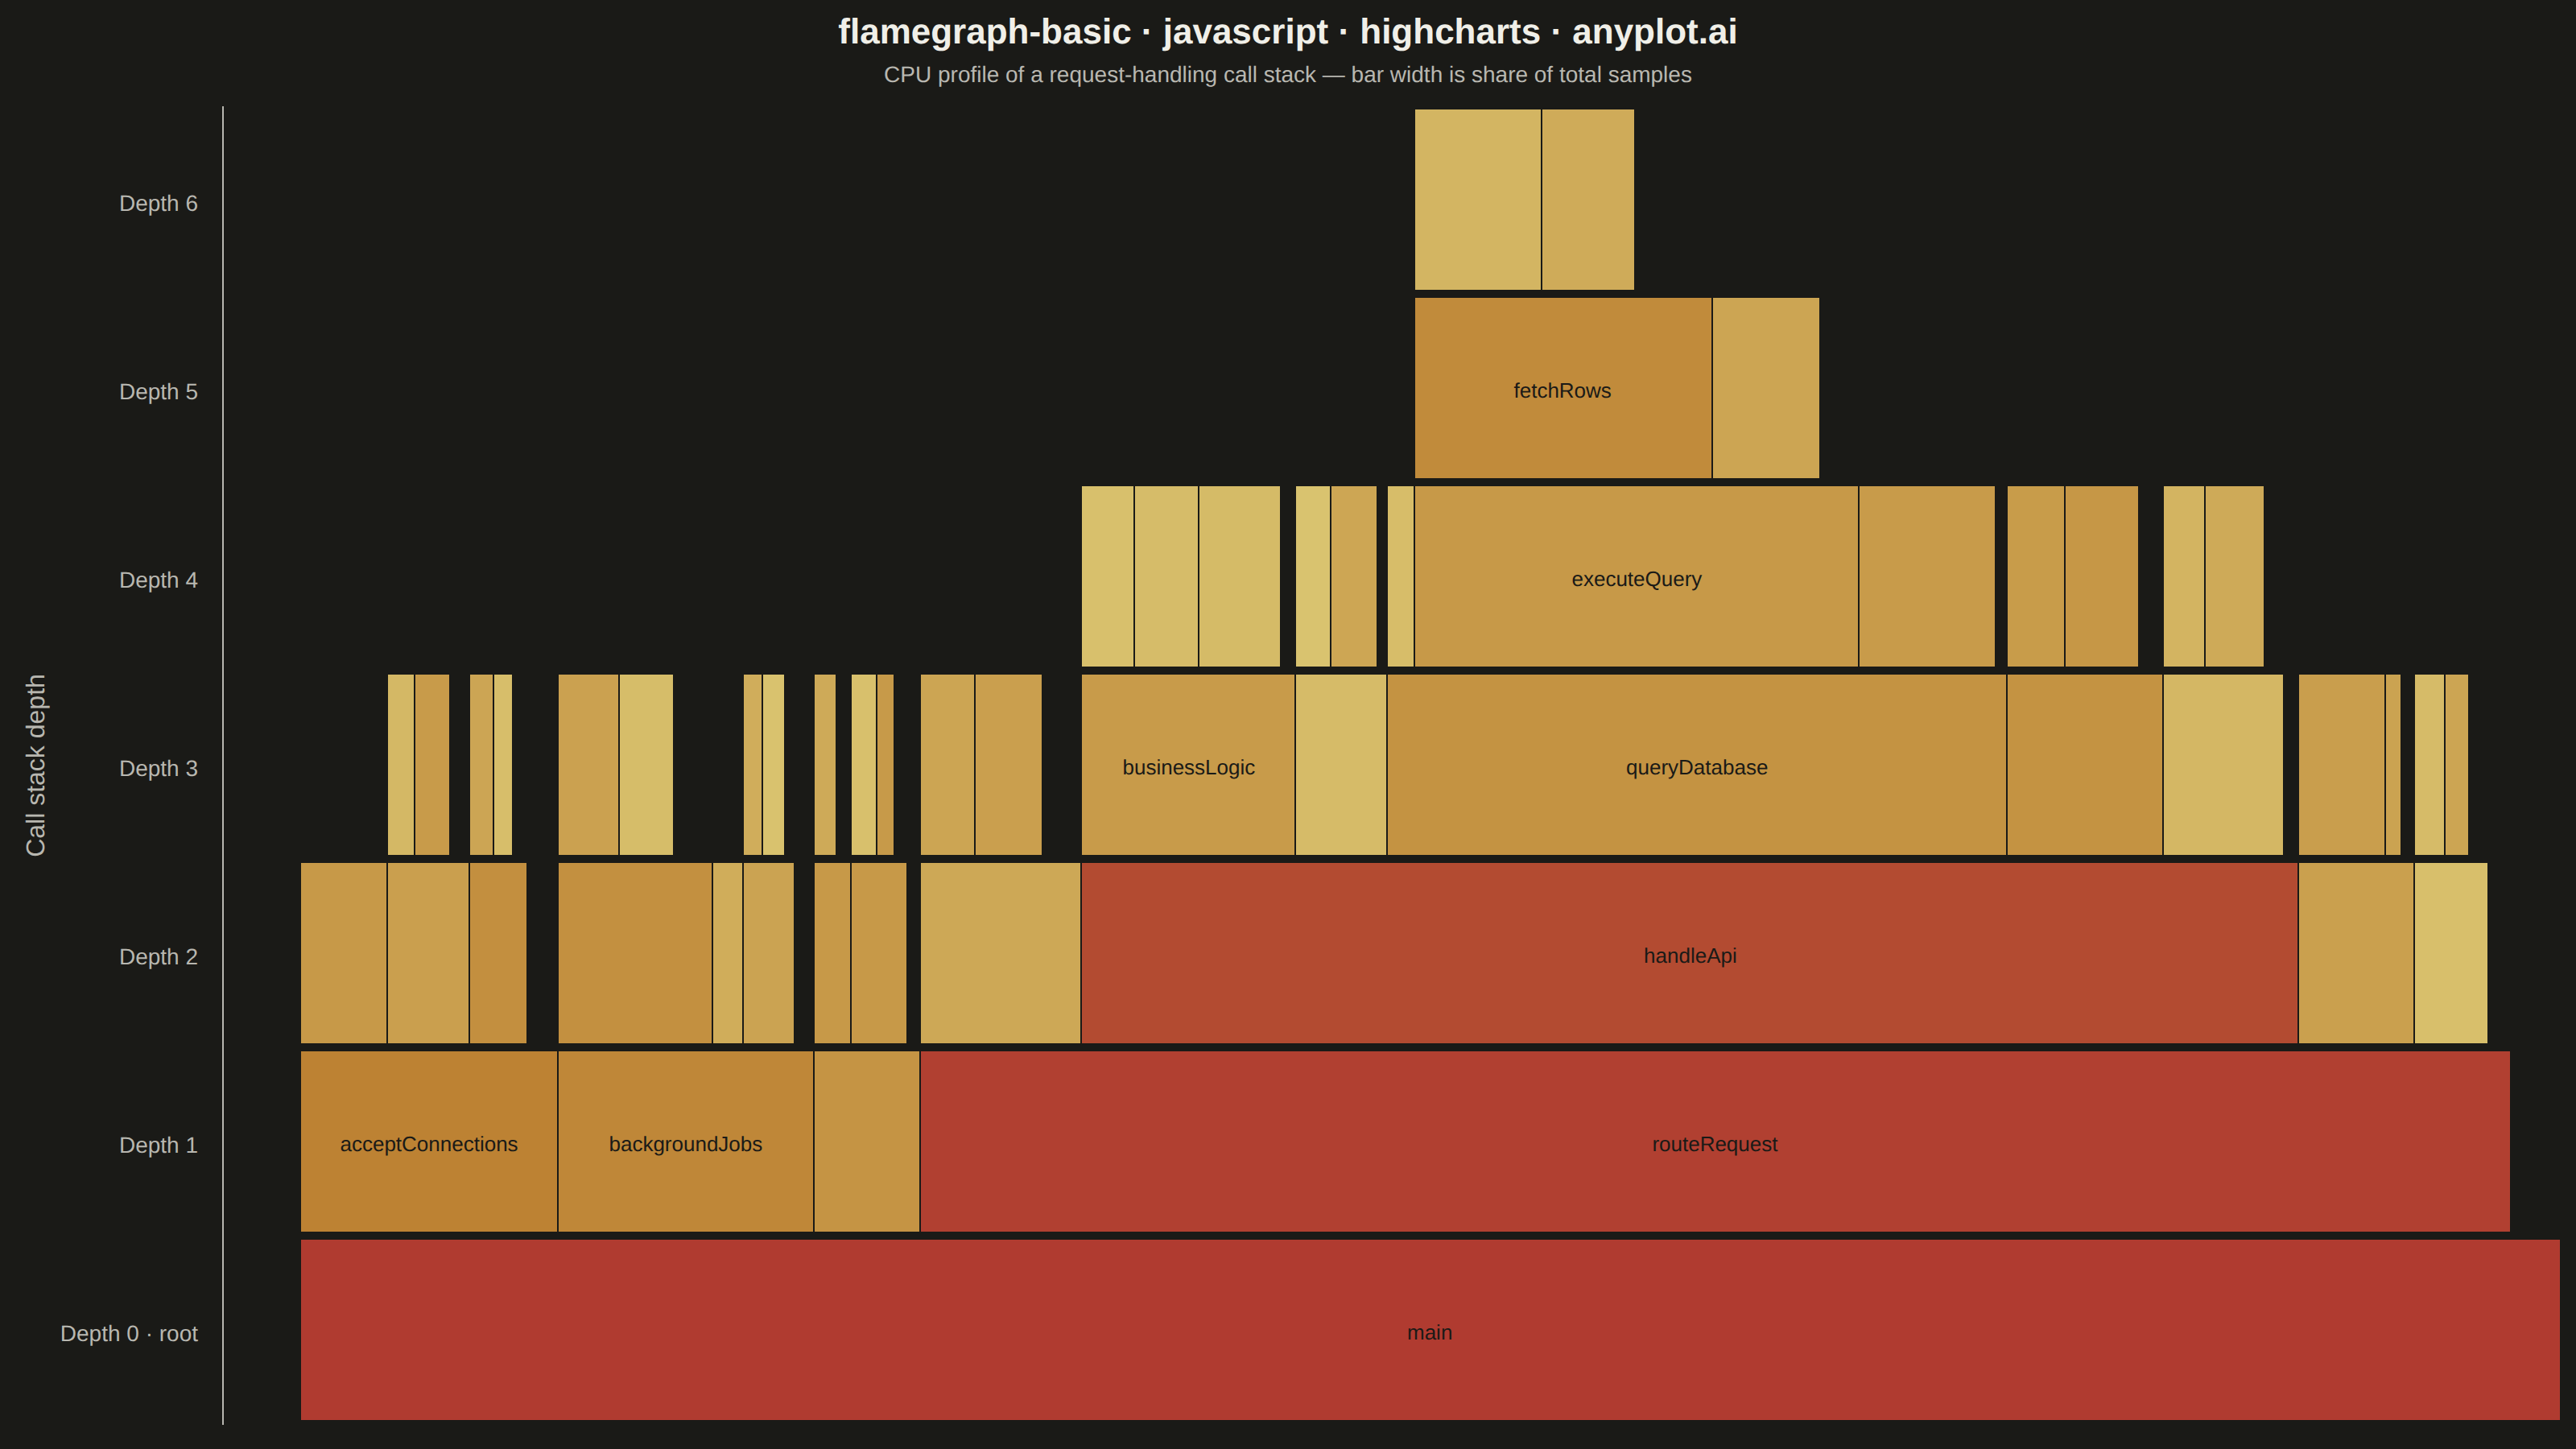
The same plot in 14 other libraries — JavaScript: Chart.js, D3.js, Apache ECharts, MUI X Charts; Python: Altair, Bokeh, lets-plot, Matplotlib, Plotly, plotnine, Pygal, Seaborn; R: ggplot2; Julia: Makie.jl. Compare all 15 side by side: Flame Graph for Performance Profiling in Python, R, Julia and JavaScript.
A flame graph visualizes hierarchical call stack data from performance profiling, where each horizontal bar represents a function in the call stack and its width is proportional to the time (or samples) spent in that function. Stacks are layered bottom-to-top showing caller-to-callee relationships. Invented by Brendan Gregg, flame graphs are the standard visualization for identifying CPU bottlenecks and hot code paths across all major programming languages and profiling tools.
// anyplot.ai
// flamegraph-basic: Flame Graph for Performance Profiling
// Library: highcharts 12.6.0 | JavaScript 22.23.2
// Quality: 94/100 | Created: 2026-08-20

const t = window.ANYPLOT_TOKENS;

// --- Data: folded call-stack samples (self-time per stack frame) -----------
// Each row is the *own* (exclusive) sample count captured for that exact
// stack path — the standard "folded stack" input format flame graphs use.
const samples = [
  { stack: "main", value: 25 },
  { stack: "main;acceptConnections", value: 15 },
  { stack: "main;acceptConnections;tlsHandshake", value: 8 },
  { stack: "main;acceptConnections;tlsHandshake;certValidation", value: 12 },
  { stack: "main;acceptConnections;tlsHandshake;cipherNegotiation", value: 10 },
  { stack: "main;acceptConnections;parseHeaders", value: 45 },
  { stack: "main;acceptConnections;readSocketBuffer", value: 10 },
  { stack: "main;acceptConnections;readSocketBuffer;parseFrameHeader", value: 18 },
  { stack: "main;acceptConnections;readSocketBuffer;bufferAlloc", value: 14 },
  { stack: "main;routeRequest", value: 12 },
  { stack: "main;routeRequest;authMiddleware", value: 20 },
  { stack: "main;routeRequest;authMiddleware;verifyToken", value: 35 },
  { stack: "main;routeRequest;authMiddleware;loadUserSession", value: 28 },
  { stack: "main;routeRequest;rateLimitCheck", value: 10 },
  { stack: "main;routeRequest;rateLimitCheck;checkBucket", value: 16 },
  { stack: "main;routeRequest;rateLimitCheck;updateBucket", value: 12 },
  { stack: "main;routeRequest;handleApi", value: 8 },
  { stack: "main;routeRequest;handleApi;validateInput", value: 10 },
  { stack: "main;routeRequest;handleApi;validateInput;schemaCheck", value: 30 },
  { stack: "main;routeRequest;handleApi;validateInput;sanitizeFields", value: 22 },
  { stack: "main;routeRequest;handleApi;queryDatabase", value: 6 },
  { stack: "main;routeRequest;handleApi;queryDatabase;acquireConnection", value: 14 },
  { stack: "main;routeRequest;handleApi;queryDatabase;executeQuery", value: 20 },
  { stack: "main;routeRequest;handleApi;queryDatabase;executeQuery;planQuery", value: 55 },
  { stack: "main;routeRequest;handleApi;queryDatabase;executeQuery;fetchRows", value: 40 },
  {
    stack: "main;routeRequest;handleApi;queryDatabase;executeQuery;fetchRows;deserializeRow",
    value: 65,
  },
  {
    stack: "main;routeRequest;handleApi;queryDatabase;executeQuery;fetchRows;rowToObject",
    value: 48,
  },
  { stack: "main;routeRequest;handleApi;queryDatabase;parseResults", value: 70 },
  { stack: "main;routeRequest;handleApi;cacheLookup", value: 5 },
  { stack: "main;routeRequest;handleApi;cacheLookup;cacheHit", value: 18 },
  { stack: "main;routeRequest;handleApi;cacheLookup;cacheMiss", value: 24 },
  { stack: "main;routeRequest;handleApi;businessLogic", value: 8 },
  { stack: "main;routeRequest;handleApi;businessLogic;computeDiscounts", value: 42 },
  { stack: "main;routeRequest;handleApi;businessLogic;applyTaxRules", value: 33 },
  { stack: "main;routeRequest;handleApi;businessLogic;aggregateTotals", value: 27 },
  { stack: "main;routeRequest;handleApi;serializeResponse", value: 12 },
  { stack: "main;routeRequest;handleApi;serializeResponse;jsonEncode", value: 38 },
  { stack: "main;routeRequest;handleApi;serializeResponse;compressGzip", value: 30 },
  { stack: "main;routeRequest;handleStatic", value: 6 },
  { stack: "main;routeRequest;handleStatic;readFile", value: 44 },
  { stack: "main;routeRequest;handleStatic;setCacheHeaders", value: 9 },
  { stack: "main;backgroundJobs", value: 10 },
  { stack: "main;backgroundJobs;garbageCollect", value: 20 },
  { stack: "main;backgroundJobs;garbageCollect;markPhase", value: 32 },
  { stack: "main;backgroundJobs;garbageCollect;sweepPhase", value: 28 },
  { stack: "main;backgroundJobs;logFlush", value: 15 },
  { stack: "main;backgroundJobs;metricsExport", value: 5 },
  { stack: "main;backgroundJobs;metricsExport;pushToStatsd", value: 12 },
  { stack: "main;backgroundJobs;metricsExport;formatMetrics", value: 10 },
  { stack: "main;logRequest", value: 6 },
  { stack: "main;logRequest;formatLogLine", value: 8 },
  { stack: "main;logRequest;formatLogLine;escapeChars", value: 11 },
  { stack: "main;logRequest;writeToDisk", value: 7 },
  { stack: "main;logRequest;writeToDisk;flushDisk", value: 13 },
  { stack: "main;logRequest;writeToDisk;fsync", value: 9 },
];

// --- Build the call tree: own time per node, then roll up totals -----------
const root = { name: "main", children: {}, own: 0 };
for (const { stack, value } of samples) {
  const parts = stack.split(";");
  let node = root;
  for (let i = 1; i < parts.length; i++) {
    const name = parts[i];
    if (!node.children[name]) node.children[name] = { name, children: {}, own: 0 };
    node = node.children[name];
  }
  node.own += value;
}

let maxDepth = 0;
const rollUp = (node, depth) => {
  maxDepth = Math.max(maxDepth, depth);
  const kids = Object.values(node.children);
  node.total = node.own + kids.reduce((sum, kid) => sum + rollUp(kid, depth + 1), 0);
  return node.total;
};
rollUp(root, 0);
const rootTotal = root.total;

// --- Flatten the tree into left-to-right stacked bars, one series per frame
// A stacked bar chart tiles series strictly by declaration order per row, so
// a depth-first walk reproduces the classic flame-graph layout. Any node that
// doesn't fully cover its own width in the row below it (self time, or a
// leaf ending before the deepest row) needs an invisible spacer series to
// keep every deeper row aligned under the correct parent.
const frames = [];

const padDown = (value, depth) => {
  if (depth > maxDepth) return;
  frames.push({ depth, value, name: null, real: false });
  padDown(value, depth + 1);
};

const walk = (node, depth) => {
  frames.push({ depth, value: node.total, name: node.name, real: true });
  const kids = Object.values(node.children).sort((a, b) => a.name.localeCompare(b.name));
  if (kids.length) {
    for (const kid of kids) walk(kid, depth + 1);
    if (node.own > 0) padDown(node.own, depth + 1);
  } else if (node.total > 0) {
    padDown(node.total, depth + 1);
  }
};
walk(root, 0);

// --- Color: conventional warm flame-graph palette, built from Imprint's ----
// warm-family anchors only (amber -> ochre -> matte-red). The spec calls for
// yellows/oranges/reds by domain convention (Brendan Gregg's original flame
// graph aesthetic), which is the semantic-exception case in the style guide
// — so frames don't follow the usual "first series is brand green" rule.
const warmStops = [t.amber, t.palette[3], t.palette[4]];
const lerp = (hexA, hexB, f) => {
  const a = Highcharts.color(hexA).rgba;
  const b = Highcharts.color(hexB).rgba;
  const mix = [0, 1, 2].map((i) => Math.round(a[i] + (b[i] - a[i]) * f));
  return `rgb(${mix[0]}, ${mix[1]}, ${mix[2]})`;
};
const hash = (str) => {
  let h = 0;
  for (let i = 0; i < str.length; i++) h = (h * 31 + str.charCodeAt(i)) >>> 0;
  return (h % 1000) / 1000;
};
// Blend two signals into the ramp position: `heat` (log-scaled share of total
// samples) pulls hot frames toward the matte-red end, adding a second layer of
// storytelling beyond bar width; `hash(name)` keeps same-share siblings visually
// distinct instead of collapsing them onto one shade.
const warmColor = (name, share) => {
  const heat = Math.min(1, Math.log1p(share * 12) / Math.log1p(12));
  const f = heat * 0.65 + hash(name) * 0.35;
  return f < 0.5 ? lerp(warmStops[0], warmStops[1], f * 2) : lerp(warmStops[1], warmStops[2], (f - 0.5) * 2);
};

const categories = Array.from({ length: maxDepth + 1 }, (_, i) => (i === 0 ? "Depth 0 · root" : `Depth ${i}`));

const series = frames.map((frame) => {
  const data = new Array(categories.length).fill(null);
  data[frame.depth] = frame.value;
  const widthFraction = frame.value / rootTotal;
  return {
    type: "bar",
    name: frame.real ? frame.name : undefined,
    data,
    stack: "flame",
    color: frame.real ? warmColor(frame.name, frame.value / rootTotal) : "transparent",
    borderWidth: frame.real ? 1 : 0,
    borderColor: t.pageBg,
    enableMouseTracking: frame.real,
    showInLegend: false,
    // Fixed dark ink, not theme-adaptive: the label is only ever shown once
    // the post-render fit check below (chart.events.render) confirms it sits
    // fully inside the warm data fill, which is constant across themes — it
    // never sits on the theme-flipped page background/spacer border.
    dataLabels: {
      enabled: frame.real && widthFraction > 0.02,
      inside: true,
      align: "center",
      verticalAlign: "middle",
      format: frame.name,
      style: { color: "#1A1A17", fontSize: "13px", fontWeight: "500", textOutline: "none" },
    },
  };
});

// Highcharts doesn't hide inside bar/column labels that are wider than their
// own point box — it just lets them overflow into whatever sits next door
// (here, the transparent spacer/border, which renders as the theme's page
// background). A width-fraction heuristic can't predict that reliably because
// label pixel width depends on the actual rendered glyphs. Instead, measure
// each label against its bar's real rendered box after every render and hide
// any label that doesn't fit — the only way to guarantee it never bleeds past
// the warm fill it depends on for contrast.
// `type: "bar"` charts render inverted: each point's SVG rect keeps its
// pre-rotation local coordinates, so `getBBox().width` is the constant row
// thickness and the bar's actual on-screen length is `getBBox().height`.
const FIT_PADDING = 12;
function hideOverflowingLabels() {
  for (const s of this.series) {
    for (const point of s.points) {
      if (!point.dataLabel || !point.graphic) continue;
      const fits = point.dataLabel.getBBox().width + FIT_PADDING <= point.graphic.getBBox().height;
      point.dataLabel.attr({ visibility: fits ? "inherit" : "hidden" });
    }
  }
}

// --- Chart -------------------------------------------------------------
Highcharts.chart("container", {
  chart: {
    type: "bar",
    backgroundColor: "transparent",
    animation: false,
    style: { fontFamily: "inherit" },
    events: { render: hideOverflowingLabels },
  },
  credits: { enabled: false },
  title: {
    text: "flamegraph-basic · javascript · highcharts · anyplot.ai",
    style: { color: t.ink, fontSize: "22px", fontWeight: "600" },
  },
  subtitle: {
    text: "CPU profile of a request-handling call stack — bar width is share of total samples",
    style: { color: t.inkSoft, fontSize: "14px" },
  },
  xAxis: {
    categories,
    reversed: false,
    lineColor: t.inkSoft,
    tickColor: t.inkSoft,
    labels: { style: { color: t.inkSoft, fontSize: "14px" } },
    title: { text: "Call stack depth", style: { color: t.inkSoft, fontSize: "16px" } },
  },
  yAxis: { visible: false, min: 0, max: rootTotal, reversed: true },
  legend: { enabled: false },
  plotOptions: {
    series: { animation: false, stacking: "normal", pointPadding: 0.02, groupPadding: 0, borderRadius: 0 },
  },
  tooltip: {
    backgroundColor: t.elevatedBg,
    borderColor: t.grid,
    style: { color: t.ink, fontSize: "14px" },
    formatter() {
      const pct = ((this.y / rootTotal) * 100).toFixed(1);
      return `<b>${this.series.name}</b><br/>${this.y.toLocaleString()} samples (${pct}%)`;
    },
  },
  series,
});
Runnable source as JSON, for any HTTP client: https://api.anyplot.ai/specs/flamegraph-basic/highcharts/code. Any spec id and library id listed in llms-full.txt fit the same URL shape; every URL below is complete and callable.
{
  "spec_id": "flamegraph-basic",
  "language": "javascript",
  "library": "highcharts",
  "page": "https://anyplot.ai/flamegraph-basic/javascript/highcharts",
  "hub": "https://anyplot.ai/flamegraph-basic",
  "code_json": "https://api.anyplot.ai/specs/flamegraph-basic/highcharts/code",
  "spec_json": "https://api.anyplot.ai/specs/flamegraph-basic",
  "render_light_png": "https://storage.googleapis.com/anyplot-images/plots/flamegraph-basic/javascript/highcharts/plot-light.png",
  "render_dark_png": "https://storage.googleapis.com/anyplot-images/plots/flamegraph-basic/javascript/highcharts/plot-dark.png",
  "interactive_light_html": "https://storage.googleapis.com/anyplot-images/plots/flamegraph-basic/javascript/highcharts/plot-light.html",
  "interactive_dark_html": "https://storage.googleapis.com/anyplot-images/plots/flamegraph-basic/javascript/highcharts/plot-dark.html",
  "quality_score": 94.0,
  "license": "MIT",
  "guide": "https://anyplot.ai/llms.txt"
}
Part of Flame Graph for Performance Profiling on anyplot.ai.