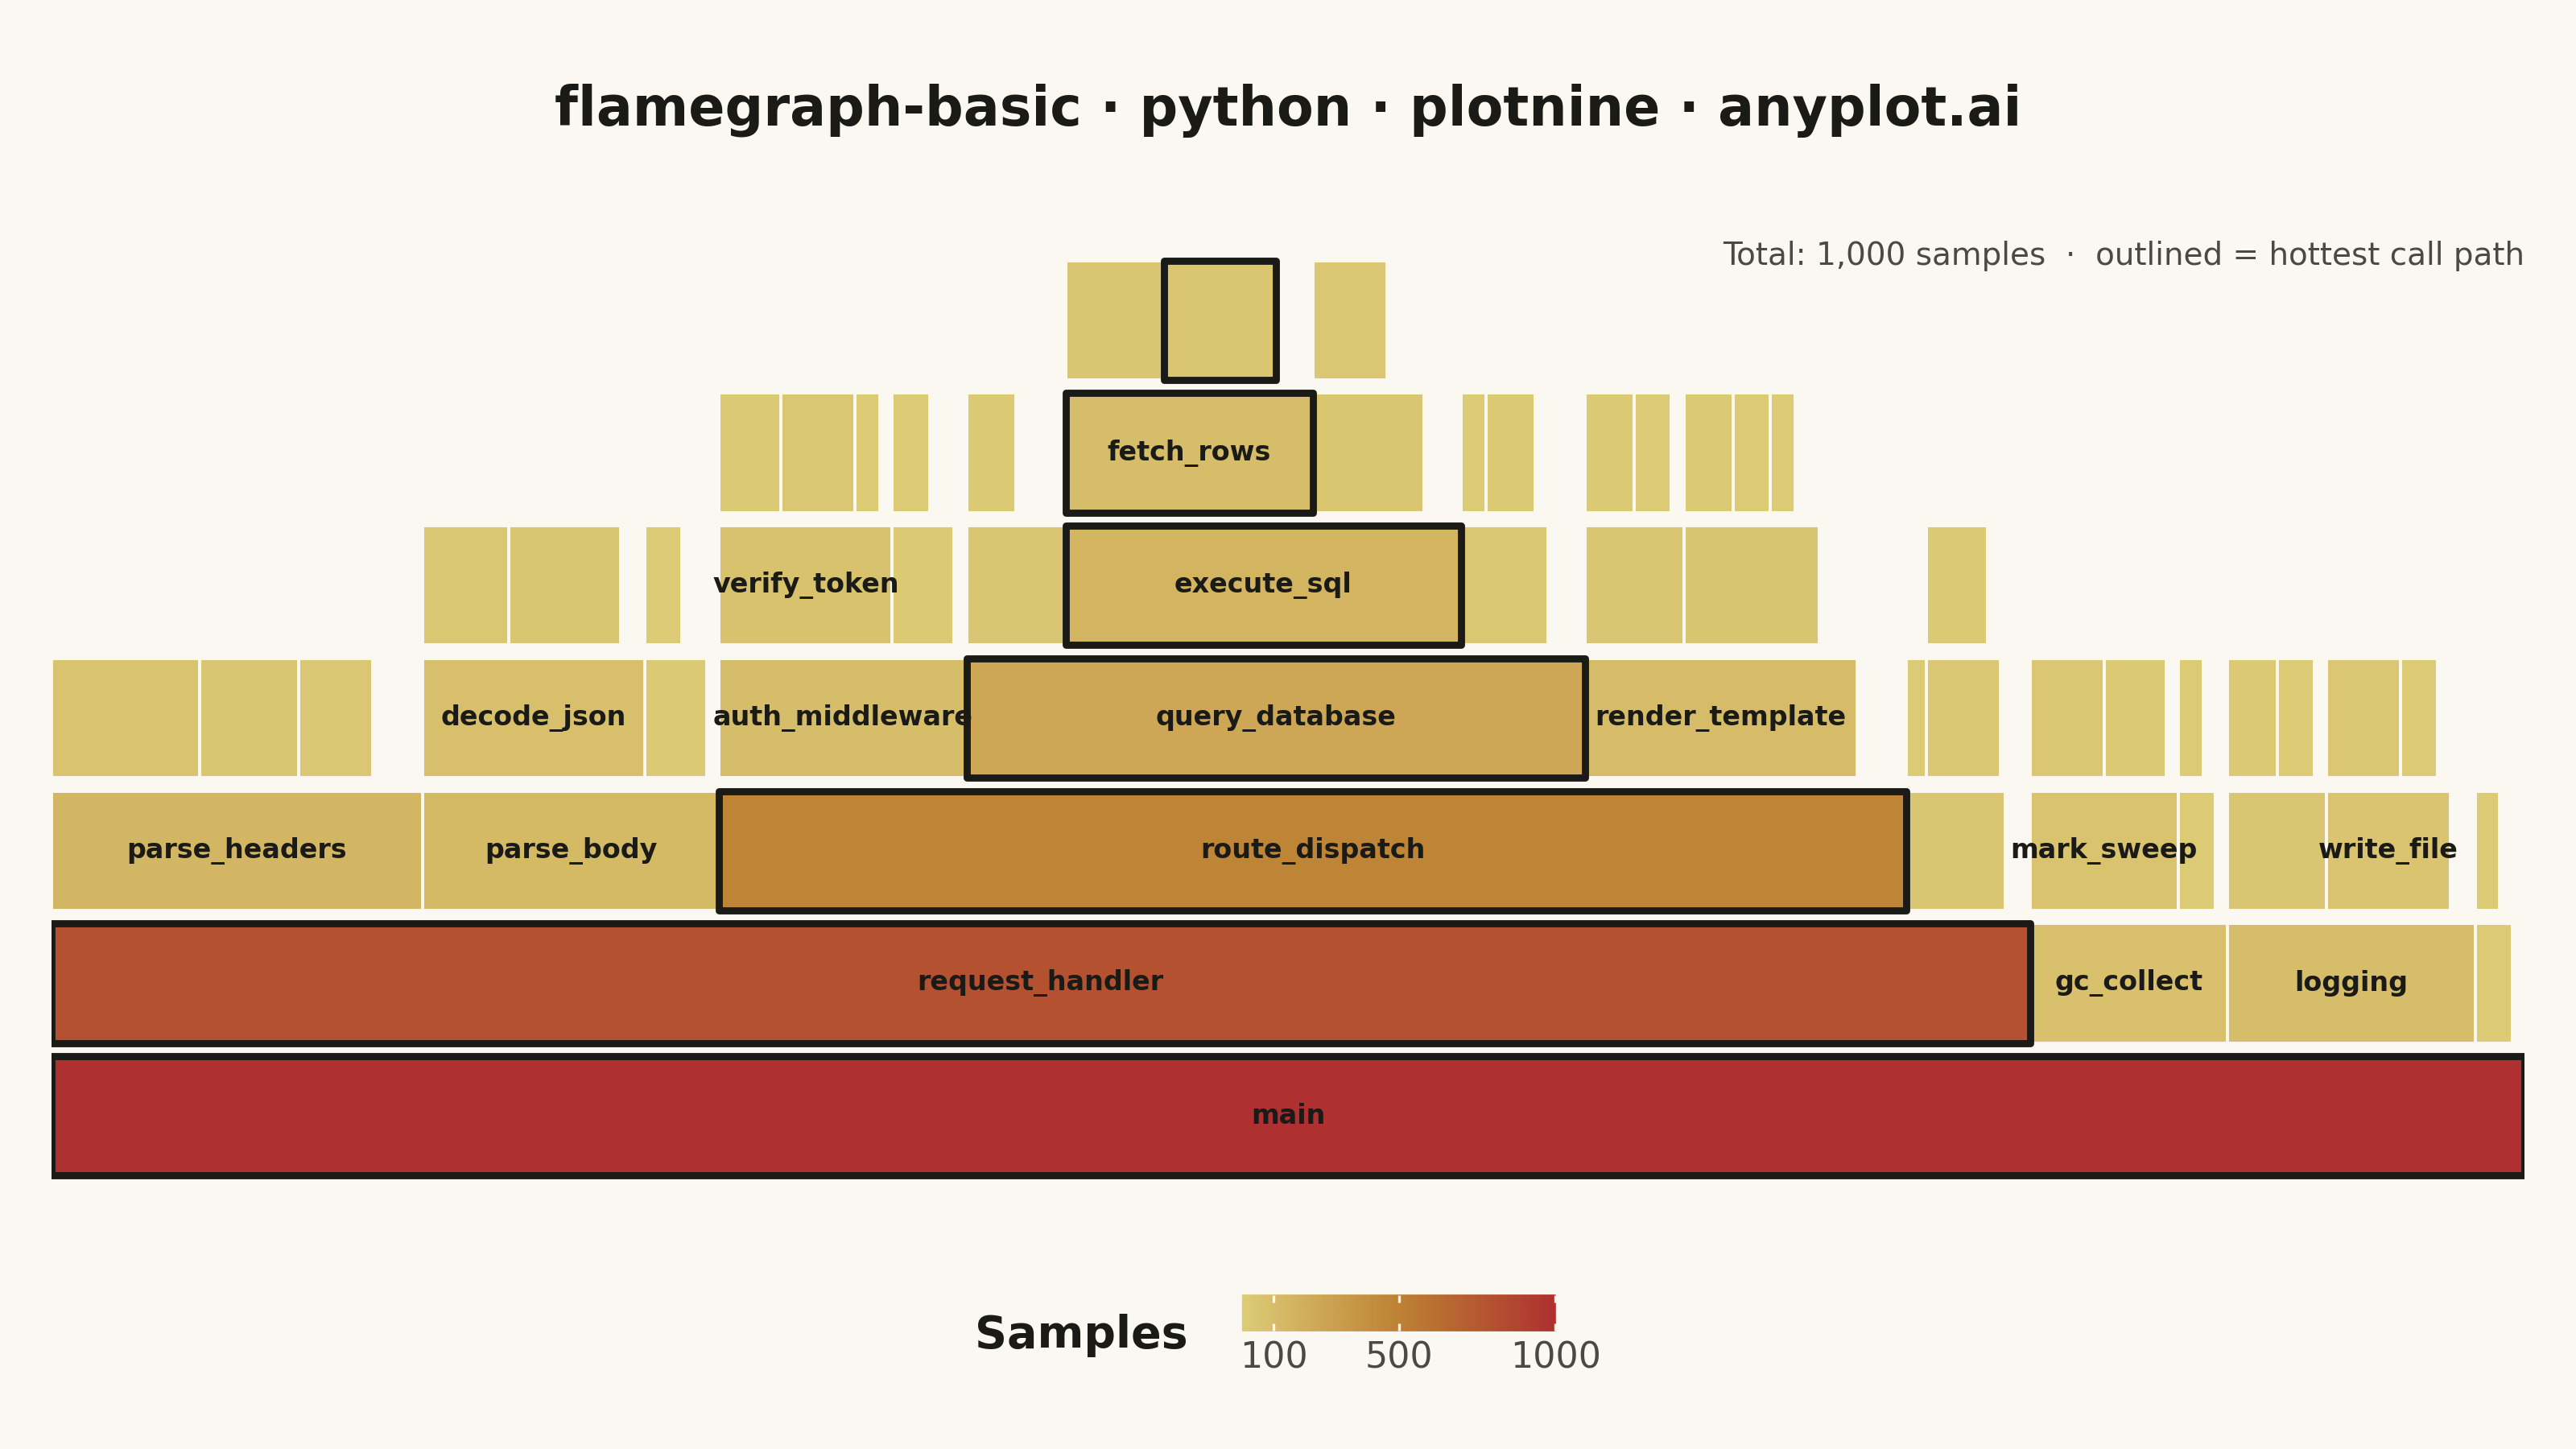
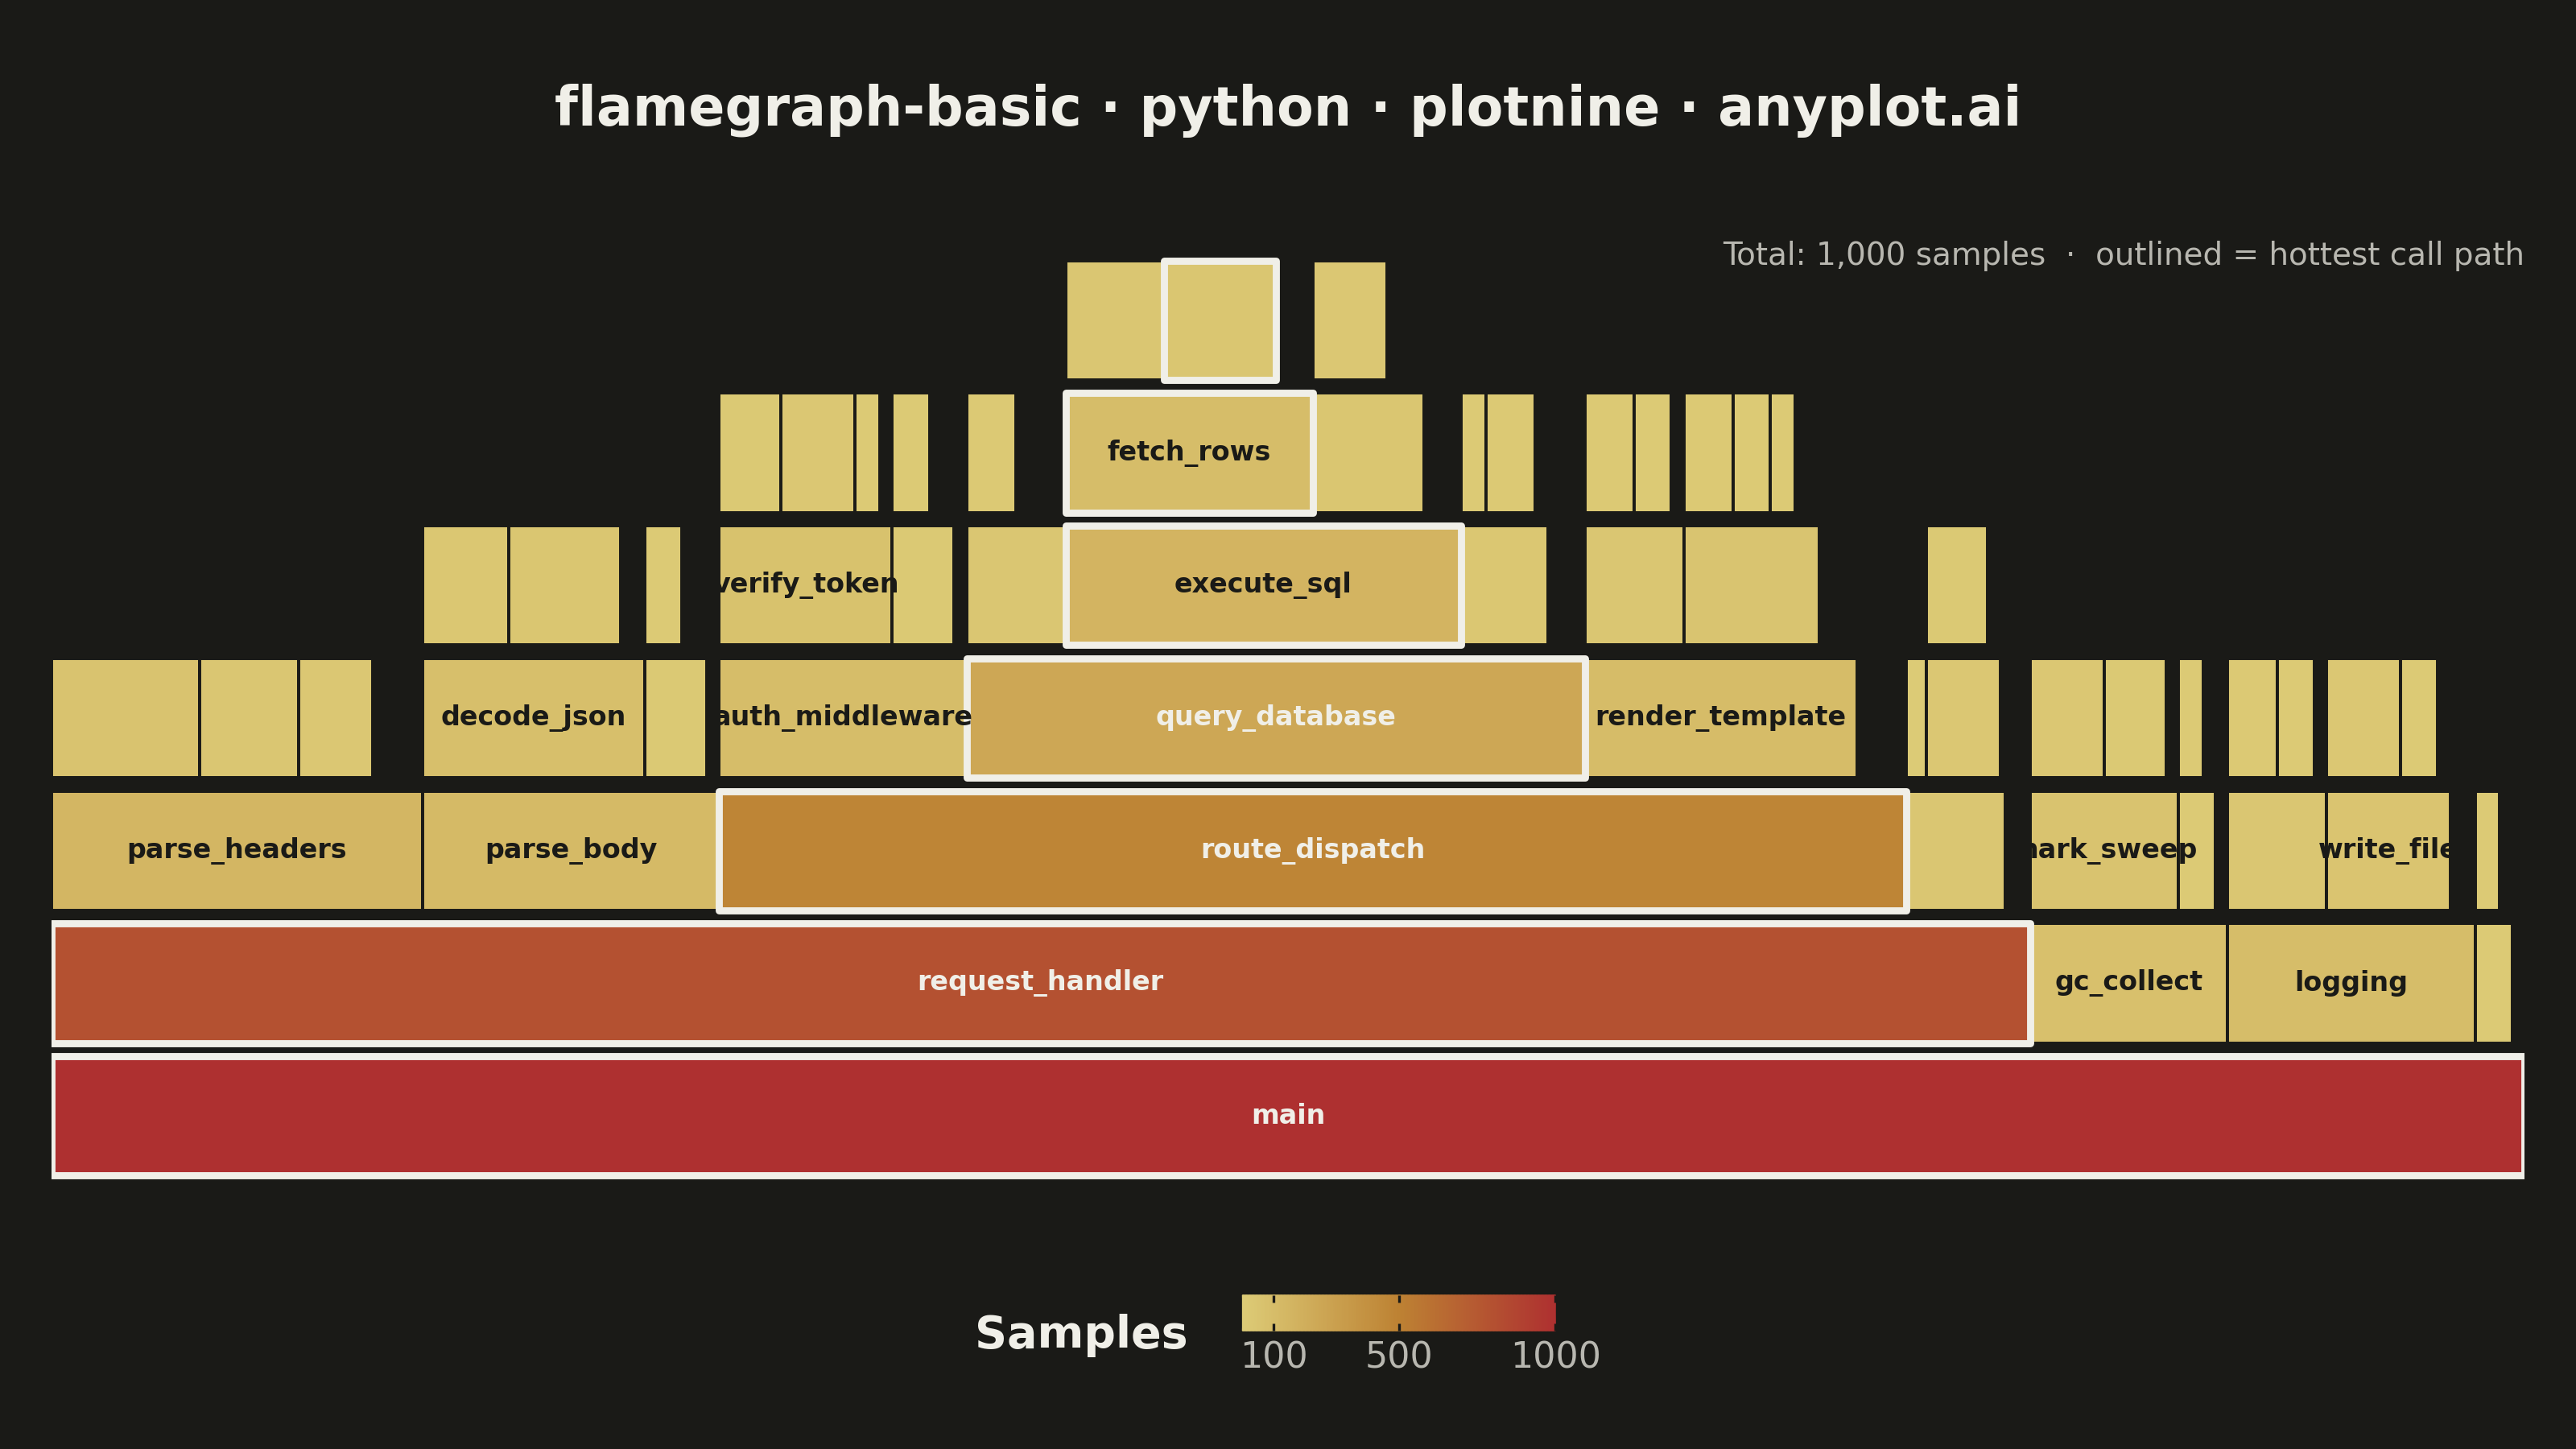
A flame graph visualizes hierarchical call stack data from performance profiling, where each horizontal bar represents a function in the call stack and its width is proportional to the time (or samples) spent in that function. Stacks are layered bottom-to-top showing caller-to-callee relationships. Invented by Brendan Gregg, flame graphs are the standard visualization for identifying CPU bottlenecks and hot code paths across all major programming languages and profiling tools.
""" anyplot.ai
flamegraph-basic: Flame Graph for Performance Profiling
Library: plotnine 0.15.5 | Python 3.13.13
Quality: 92/100 | Updated: 2026-06-08
"""

import os
import sys

import pandas as pd


# Work around the naming conflict between this script (plotnine.py) and the plotnine package
script_dir = os.path.dirname(os.path.abspath(__file__))
for entry in (script_dir, "", "."):
    if entry in sys.path:
        sys.path.remove(entry)

from plotnine import (
    aes,
    annotate,
    coord_cartesian,
    element_blank,
    element_line,
    element_rect,
    element_text,
    geom_rect,
    geom_text,
    ggplot,
    labs,
    scale_color_identity,
    scale_fill_gradientn,
    scale_x_continuous,
    scale_y_continuous,
    theme,
    theme_void,
)


# Theme tokens (see prompts/default-style-guide.md "Theme-adaptive Chrome")
THEME = os.getenv("ANYPLOT_THEME", "light")
PAGE_BG = "#FAF8F1" if THEME == "light" else "#1A1A17"
INK = "#1A1A17" if THEME == "light" else "#F0EFE8"
INK_SOFT = "#4A4A44" if THEME == "light" else "#B8B7B0"

# Warm flame gradient from the Imprint palette (semantic association: flame → fire).
# amber → ochre → matte red — single-polarity continuous, no external cmap.
FLAME_LOW = "#DDCC77"  # Imprint amber (cool flame, low samples)
FLAME_MID = "#BD8233"  # Imprint ochre (medium heat)
FLAME_HIGH = "#AE3030"  # Imprint matte red (hottest path)
BAR_EDGE = PAGE_BG  # subtle gap between siblings, theme-aware
# Dark-mode amber bars are too light for cream INK text — fall back to dark INK
# on those leaves so the function name stays high-contrast.
AMBER_LABEL_INK = "#1A1A17"

# Data — simulated CPU profiling stacks (web request handling, 59 unique stacks)
stacks = {
    "main": 1000,
    "main;request_handler": 800,
    "main;request_handler;parse_headers": 150,
    "main;request_handler;parse_headers;parse_cookies": 60,
    "main;request_handler;parse_headers;read_content_type": 40,
    "main;request_handler;parse_headers;read_user_agent": 30,
    "main;request_handler;parse_body": 120,
    "main;request_handler;parse_body;decode_json": 90,
    "main;request_handler;parse_body;decode_json;tokenize": 35,
    "main;request_handler;parse_body;decode_json;parse_tree": 45,
    "main;request_handler;parse_body;validate_schema": 25,
    "main;request_handler;parse_body;validate_schema;check_required": 15,
    "main;request_handler;route_dispatch": 480,
    "main;request_handler;route_dispatch;auth_middleware": 100,
    "main;request_handler;route_dispatch;auth_middleware;verify_token": 70,
    "main;request_handler;route_dispatch;auth_middleware;verify_token;decode_jwt": 25,
    "main;request_handler;route_dispatch;auth_middleware;verify_token;check_signature": 30,
    "main;request_handler;route_dispatch;auth_middleware;verify_token;check_expiry": 10,
    "main;request_handler;route_dispatch;auth_middleware;check_permissions": 25,
    "main;request_handler;route_dispatch;auth_middleware;check_permissions;load_roles": 15,
    "main;request_handler;route_dispatch;query_database": 250,
    "main;request_handler;route_dispatch;query_database;build_query": 40,
    "main;request_handler;route_dispatch;query_database;build_query;bind_params": 20,
    "main;request_handler;route_dispatch;query_database;execute_sql": 160,
    "main;request_handler;route_dispatch;query_database;execute_sql;fetch_rows": 100,
    "main;request_handler;route_dispatch;query_database;execute_sql;fetch_rows;read_socket": 40,
    "main;request_handler;route_dispatch;query_database;execute_sql;fetch_rows;parse_rows": 45,
    "main;request_handler;route_dispatch;query_database;execute_sql;deserialize": 45,
    "main;request_handler;route_dispatch;query_database;execute_sql;deserialize;parse_json_blob": 30,
    "main;request_handler;route_dispatch;query_database;cache_result": 35,
    "main;request_handler;route_dispatch;query_database;cache_result;key_hash": 10,
    "main;request_handler;route_dispatch;query_database;cache_result;serialize_value": 20,
    "main;request_handler;route_dispatch;render_template": 110,
    "main;request_handler;route_dispatch;render_template;compile_template": 40,
    "main;request_handler;route_dispatch;render_template;compile_template;parse_ast": 20,
    "main;request_handler;route_dispatch;render_template;compile_template;bytecode_gen": 15,
    "main;request_handler;route_dispatch;render_template;apply_filters": 55,
    "main;request_handler;route_dispatch;render_template;apply_filters;escape_html": 20,
    "main;request_handler;route_dispatch;render_template;apply_filters;format_date": 15,
    "main;request_handler;route_dispatch;render_template;apply_filters;truncate_text": 10,
    "main;request_handler;send_response": 40,
    "main;request_handler;send_response;serialize_body": 8,
    "main;request_handler;send_response;compress_gzip": 30,
    "main;request_handler;send_response;compress_gzip;deflate": 25,
    "main;gc_collect": 80,
    "main;gc_collect;mark_sweep": 60,
    "main;gc_collect;mark_sweep;traverse_refs": 30,
    "main;gc_collect;mark_sweep;mark_objects": 25,
    "main;gc_collect;compact_heap": 15,
    "main;gc_collect;compact_heap;move_objects": 10,
    "main;logging": 100,
    "main;logging;format_message": 40,
    "main;logging;format_message;render_format_str": 20,
    "main;logging;format_message;serialize_args": 15,
    "main;logging;write_file": 50,
    "main;logging;write_file;buffer_write": 30,
    "main;logging;write_file;fsync": 15,
    "main;heartbeat": 15,
    "main;heartbeat;ping_monitoring": 10,
}

# Compute x positions level by level, children laid out within their parent's extent
total_samples = stacks["main"]
depth_children: dict[tuple[int, str | None], list[tuple[str, str, int]]] = {}
for stack_path, samples in stacks.items():
    parts = stack_path.split(";")
    depth = len(parts) - 1
    parent = ";".join(parts[:-1]) if depth > 0 else None
    depth_children.setdefault((depth, parent), []).append((parts[-1], stack_path, samples))

positions: dict[str, tuple[int, int]] = {"main": (0, total_samples)}
max_stack_depth = max(len(p.split(";")) - 1 for p in stacks)
for current_depth in range(1, max_stack_depth + 1):
    for (d, parent), children in sorted(depth_children.items()):
        if d != current_depth or parent not in positions:
            continue
        x_cursor = positions[parent][0]
        for _func_name, stack_path, samples in children:
            positions[stack_path] = (x_cursor, x_cursor + samples)
            x_cursor += samples

# Identify the hottest call path (greedy descend by max-sample child) for emphasis
hottest_path: set[str] = set()
cursor_stack = "main"
while True:
    hottest_path.add(cursor_stack)
    cursor_depth = cursor_stack.count(";")
    kids = depth_children.get((cursor_depth + 1, cursor_stack), [])
    if not kids:
        break
    cursor_stack = max(kids, key=lambda c: c[2])[1]

# Build dataframe. Label color flips to dark INK on amber bars in dark mode so
# the function name stays readable on the lightest fills (~samples < 200 sit in
# the amber stop of the warm gradient).
records = []
for stack_path, (xmin, xmax) in positions.items():
    parts = stack_path.split(";")
    depth = len(parts) - 1
    func_name = parts[-1]
    samples = xmax - xmin
    width_frac = samples / total_samples
    is_amber = samples < 200
    label_color = AMBER_LABEL_INK if (THEME == "dark" and is_amber) else INK
    # Suppress labels that won't fit within the bar (~0.5% canvas per glyph at size 6 mm)
    fits = width_frac >= max(0.04, 0.005 * len(func_name))
    records.append(
        {
            "xmin": xmin,
            "xmax": xmax,
            "ymin": depth + 0.05,
            "ymax": depth + 0.95,
            "depth": depth,
            "func": func_name,
            "samples": samples,
            "label": func_name if fits else "",
            "label_x": (xmin + xmax) / 2,
            "label_y": depth + 0.5,
            "label_color": label_color,
            "on_hot_path": stack_path in hottest_path,
        }
    )

df = pd.DataFrame(records)
hot_df = df[df["on_hot_path"]].copy()
max_depth = int(df["depth"].max())

# Plot — geom_rect grammar with sample-count fill mapping (data storytelling: hotspots glow)
plot = (
    ggplot(df)
    + geom_rect(aes(xmin="xmin", xmax="xmax", ymin="ymin", ymax="ymax", fill="samples"), color=BAR_EDGE, size=0.4)
    # Outline the hottest call path so the eye lands on the bottleneck immediately
    + geom_rect(hot_df, aes(xmin="xmin", xmax="xmax", ymin="ymin", ymax="ymax"), fill=None, color=INK, size=0.9)
    + geom_text(
        aes(x="label_x", y="label_y", label="label", color="label_color"),
        size=6,
        fontweight="bold",
        family="DejaVu Sans",
        show_legend=False,
    )
    + scale_color_identity()
    + scale_fill_gradientn(
        colors=[FLAME_LOW, FLAME_MID, FLAME_HIGH], name="Samples", breaks=[100, 500, 1000], limits=(0, total_samples)
    )
    + scale_x_continuous(expand=(0, 0))
    + scale_y_continuous(expand=(0, 0.1))
    + coord_cartesian(ylim=(0, max_depth + 1.3))
    + labs(title="flamegraph-basic · python · plotnine · anyplot.ai")
    + annotate(
        "text",
        x=total_samples,
        y=max_depth + 1.1,
        label=f"Total: {total_samples:,} samples  ·  outlined = hottest call path",
        ha="right",
        va="top",
        size=7,
        color=INK_SOFT,
        family="DejaVu Sans",
    )
    + theme_void()
    + theme(
        figure_size=(8, 4.5),
        plot_background=element_rect(fill=PAGE_BG, color=PAGE_BG),
        panel_background=element_rect(fill=PAGE_BG, color=PAGE_BG),
        panel_grid=element_blank(),
        plot_title=element_text(size=12, color=INK, weight="bold", ha="center", margin={"b": 8, "t": 4}),
        plot_margin=0.02,
        legend_position="bottom",
        legend_direction="horizontal",
        legend_background=element_rect(fill=PAGE_BG, color=PAGE_BG),
        legend_title=element_text(size=10, color=INK, weight="bold"),
        legend_text=element_text(size=8, color=INK_SOFT),
        legend_key_width=70,
        legend_key_height=8,
        legend_box_margin=4,
        legend_ticks=element_line(color=PAGE_BG, size=0.6),
    )
)

# Save — figsize=(8, 4.5) @ dpi=400 → 3200×1800
plot.save(f"plot-{THEME}.png", dpi=400, width=8, height=4.5, units="in", verbose=False)
Runnable source as JSON, for any HTTP client: https://api.anyplot.ai/specs/flamegraph-basic/plotnine/code. Any spec id and library id listed in llms-full.txt fit the same URL shape; every URL below is complete and callable.
{
  "spec_id": "flamegraph-basic",
  "language": "python",
  "library": "plotnine",
  "page": "https://anyplot.ai/flamegraph-basic/python/plotnine",
  "hub": "https://anyplot.ai/flamegraph-basic",
  "code_json": "https://api.anyplot.ai/specs/flamegraph-basic/plotnine/code",
  "spec_json": "https://api.anyplot.ai/specs/flamegraph-basic",
  "render_light_png": "https://storage.googleapis.com/anyplot-images/plots/flamegraph-basic/python/plotnine/plot-light.png",
  "render_dark_png": "https://storage.googleapis.com/anyplot-images/plots/flamegraph-basic/python/plotnine/plot-dark.png",
  "quality_score": 92.0,
  "license": "MIT",
  "guide": "https://anyplot.ai/llms.txt"
}
Part of Flame Graph for Performance Profiling on anyplot.ai.