The same plot in 14 other libraries — JavaScript: Chart.js, Apache ECharts, Highcharts, MUI X Charts; Python: Altair, Bokeh, lets-plot, Matplotlib, Plotly, plotnine, Pygal, Seaborn; R: ggplot2; Julia: Makie.jl. Compare all 15 side by side: Flame Graph for Performance Profiling in Python, R, Julia and JavaScript.
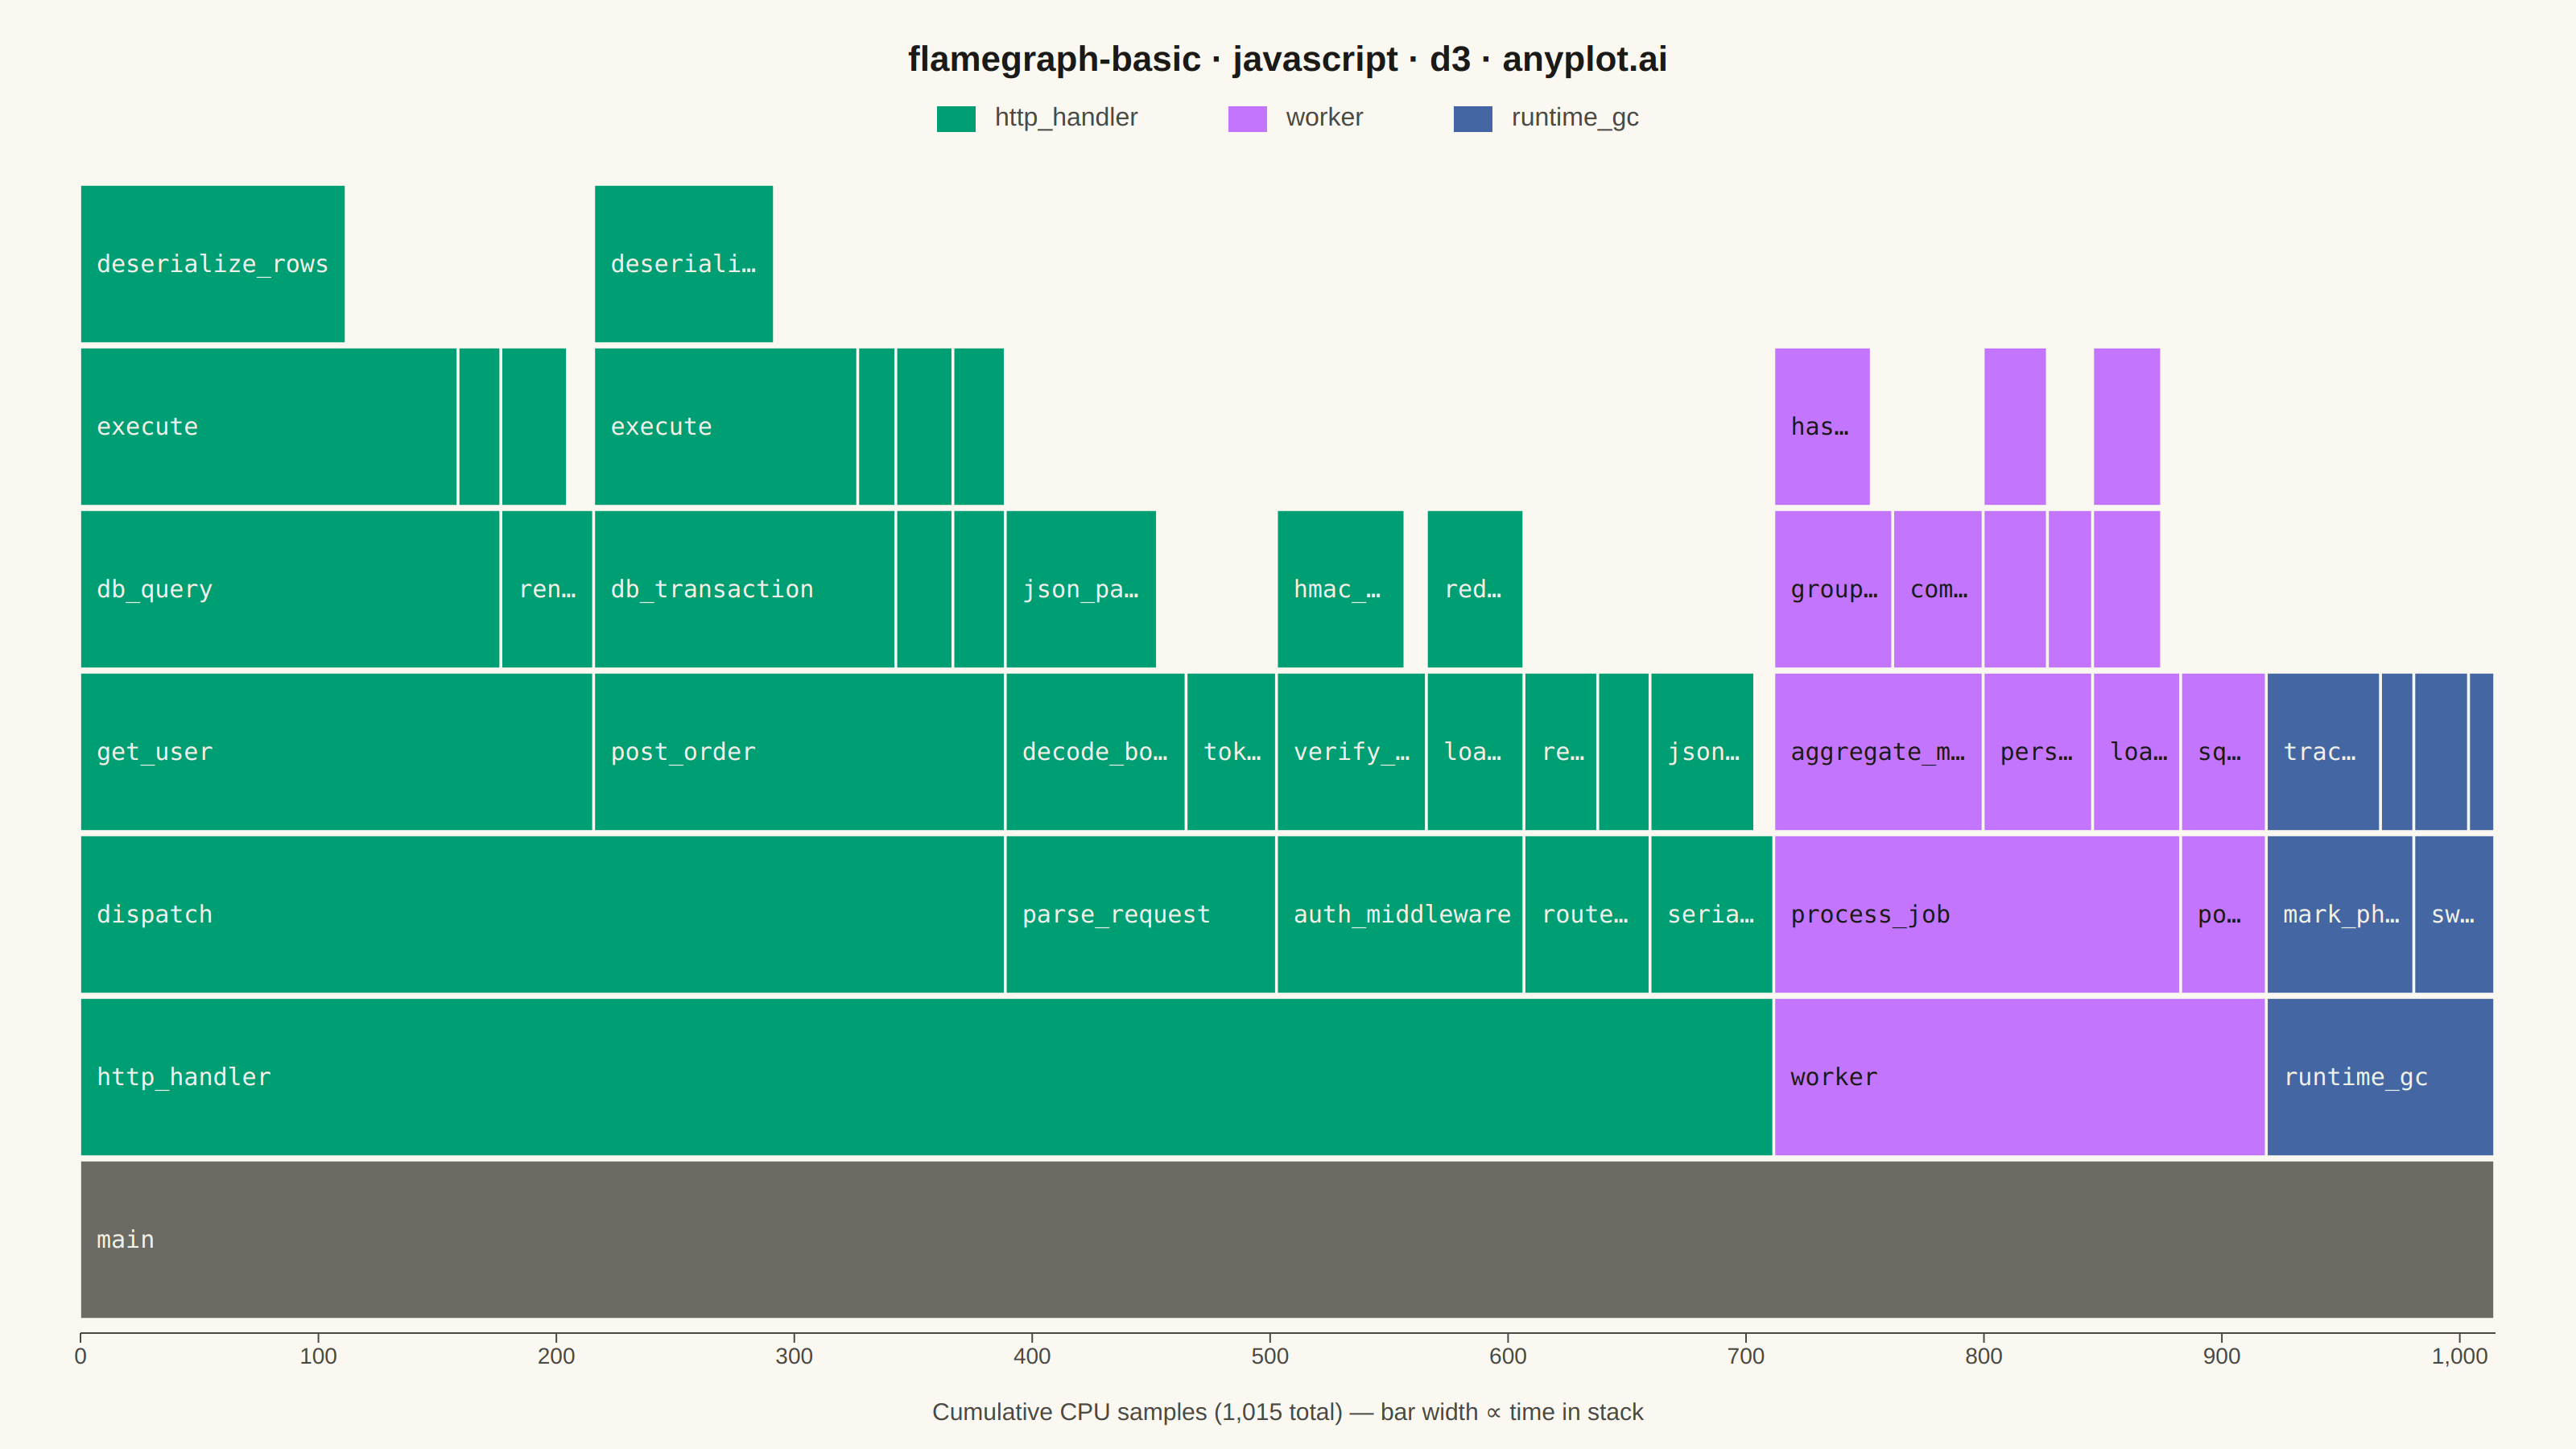
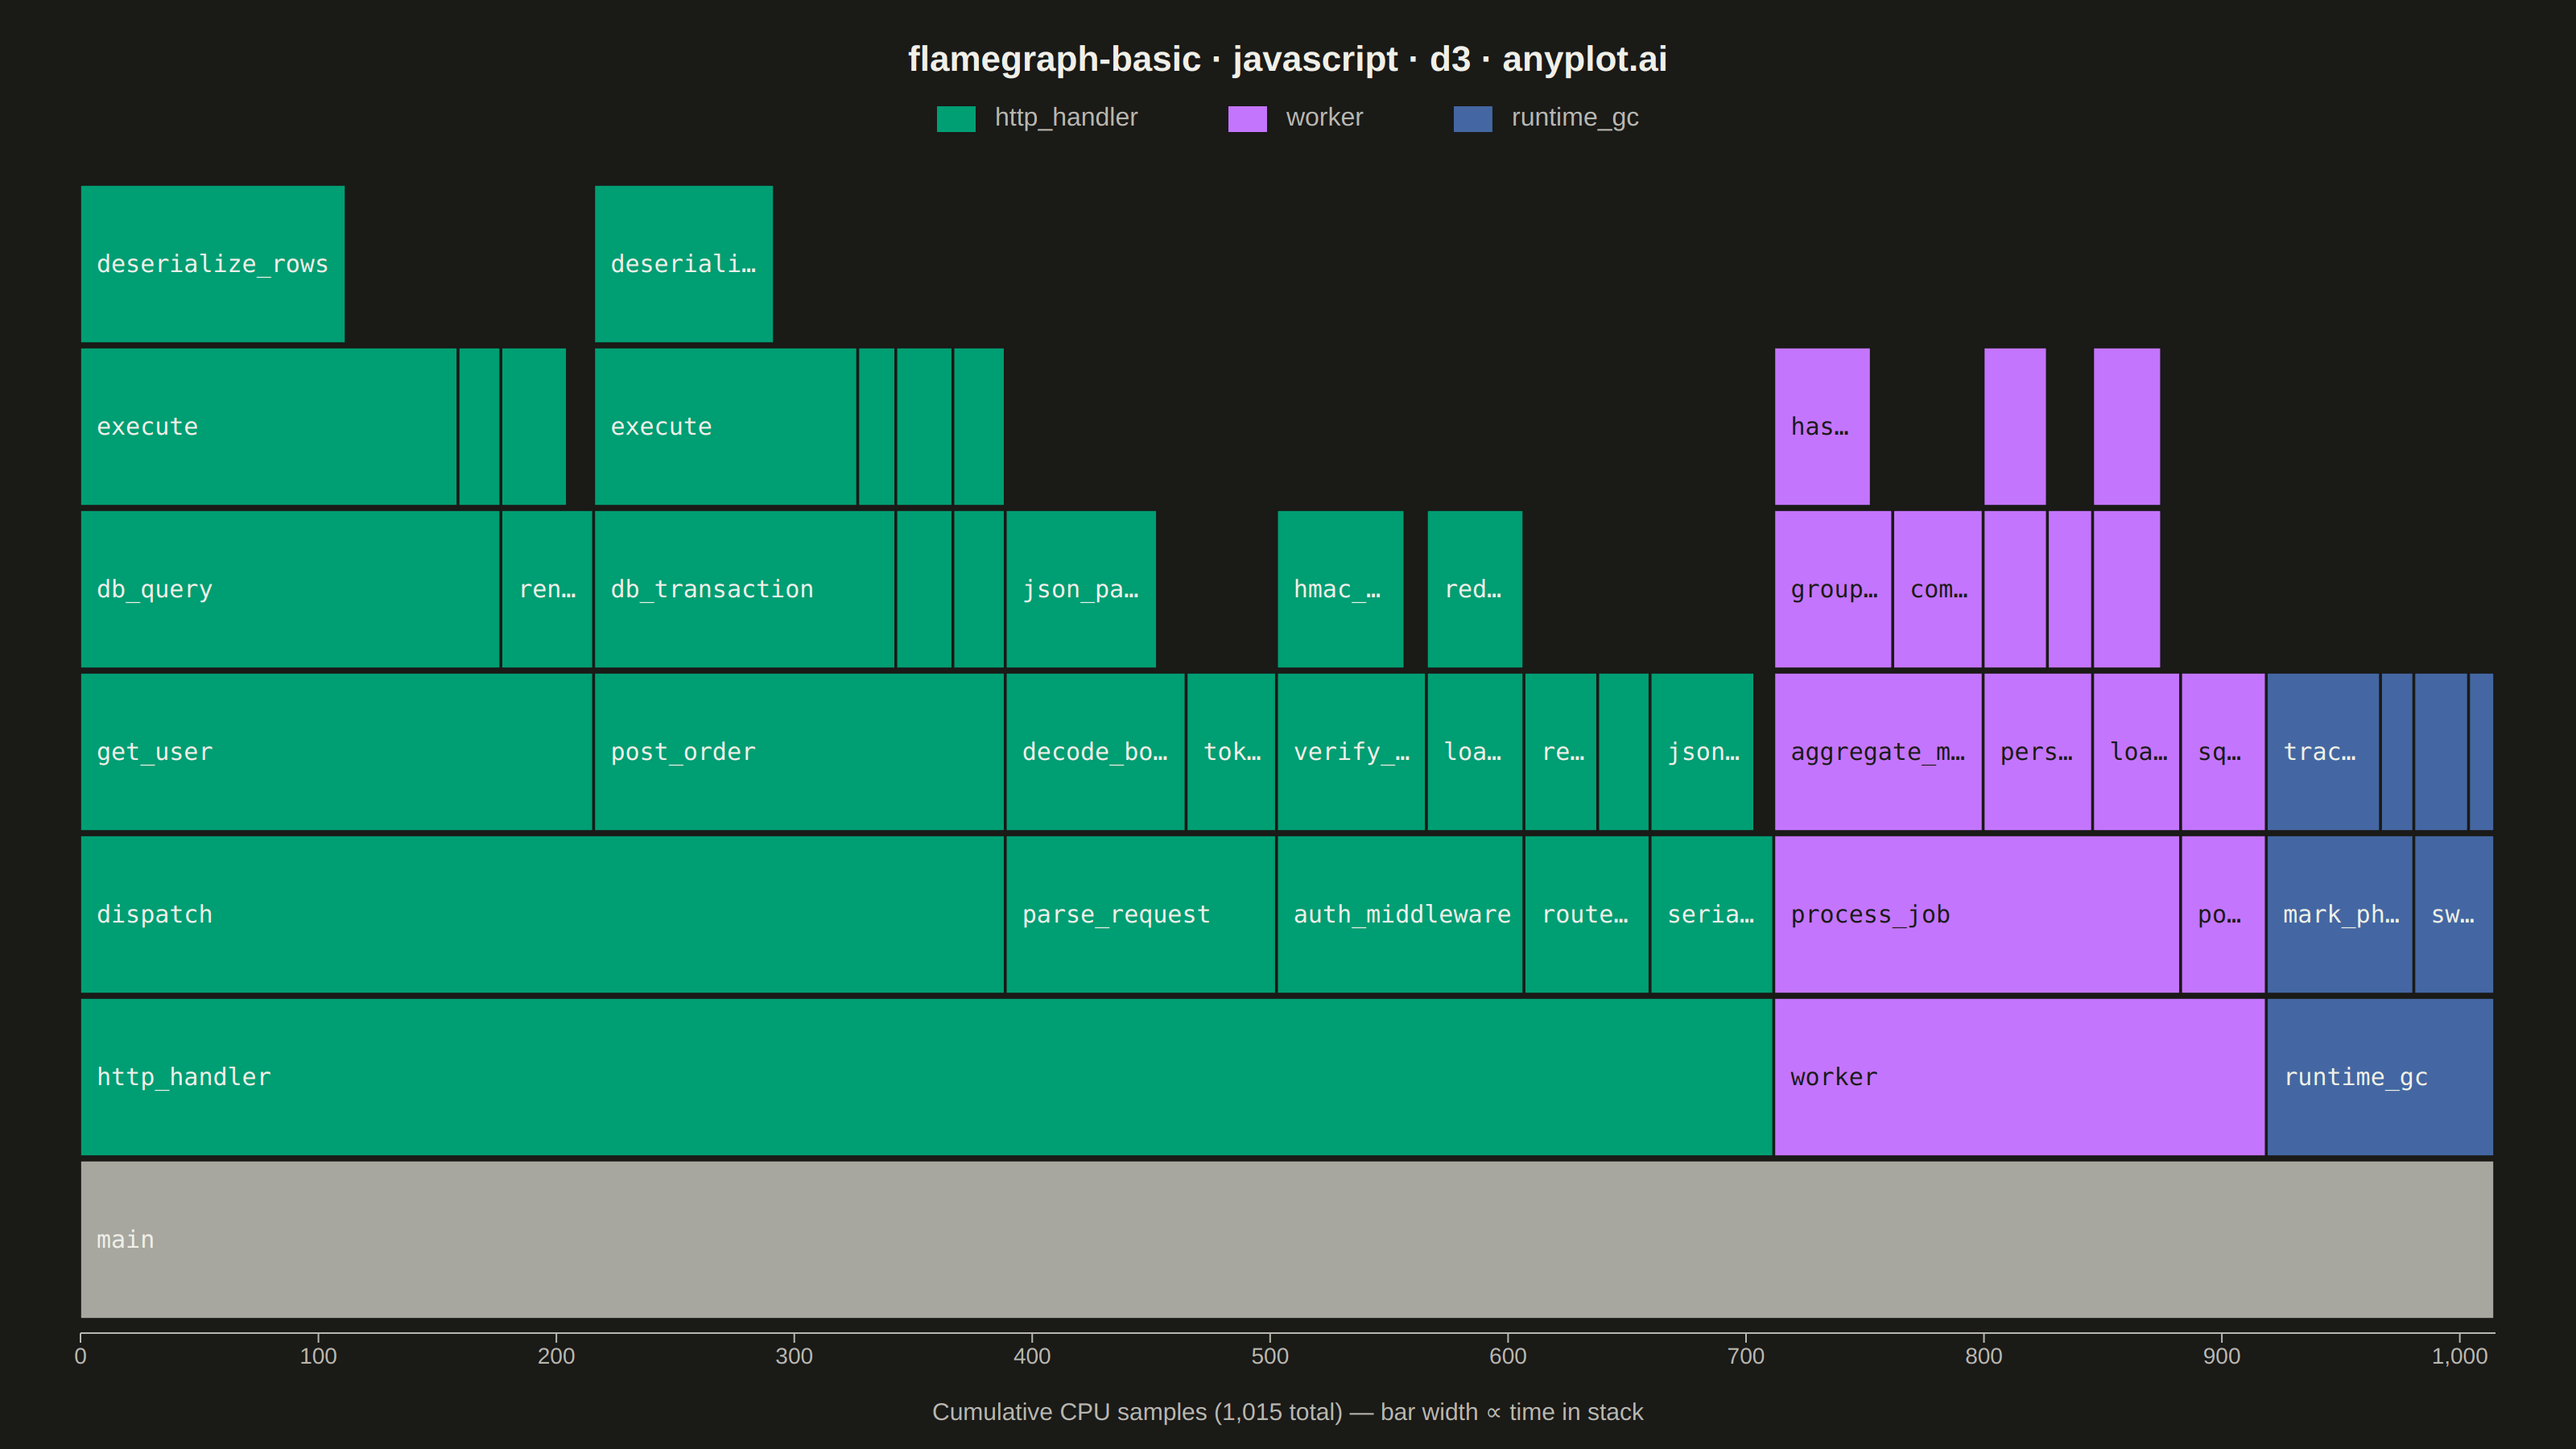
A flame graph visualizes hierarchical call stack data from performance profiling, where each horizontal bar represents a function in the call stack and its width is proportional to the time (or samples) spent in that function. Stacks are layered bottom-to-top showing caller-to-callee relationships. Invented by Brendan Gregg, flame graphs are the standard visualization for identifying CPU bottlenecks and hot code paths across all major programming languages and profiling tools.
// anyplot.ai
// flamegraph-basic: Flame Graph for Performance Profiling
// Library: d3 7.9.0 | JavaScript 22.22.3
// Quality: 90/100 | Created: 2026-06-08
//# anyplot-orientation: landscape

const t = window.ANYPLOT_TOKENS;
const theme = window.ANYPLOT_THEME;
const { width, height } = window.ANYPLOT_SIZE;

const margin = { top: 110, right: 50, bottom: 78, left: 50 };
const iw = width - margin.left - margin.right;
const ih = height - margin.top - margin.bottom;

// --- Data: synthetic CPU profile (semicolon stacks, sample counts) ---------
// Models a typical web-service profile: HTTP request handler, background job
// worker, and the runtime garbage collector. `stack` is the call path from
// `main` to the leaf frame; `value` is how many CPU samples were observed in
// that exact stack frame (i.e. self-time of the leaf).
const samples = [
  { stack: "main;http_handler;parse_request;tokenize_headers", value: 38 },
  { stack: "main;http_handler;parse_request;decode_body;json_parse", value: 64 },
  { stack: "main;http_handler;parse_request;decode_body", value: 12 },
  { stack: "main;http_handler;route_match;regex_compile", value: 22 },
  { stack: "main;http_handler;route_match;regex_exec", value: 31 },
  { stack: "main;http_handler;auth_middleware;verify_jwt;hmac_sha256", value: 54 },
  { stack: "main;http_handler;auth_middleware;verify_jwt", value: 9 },
  { stack: "main;http_handler;auth_middleware;load_session;redis_get", value: 41 },
  { stack: "main;http_handler;dispatch;get_user;db_query;pool_checkout", value: 18 },
  { stack: "main;http_handler;dispatch;get_user;db_query;execute;deserialize_rows", value: 112 },
  { stack: "main;http_handler;dispatch;get_user;db_query;execute", value: 47 },
  { stack: "main;http_handler;dispatch;get_user;render_template;escape_html", value: 28 },
  { stack: "main;http_handler;dispatch;get_user;render_template", value: 11 },
  { stack: "main;http_handler;dispatch;post_order;validate;schema_check", value: 24 },
  { stack: "main;http_handler;dispatch;post_order;db_transaction;pool_checkout", value: 16 },
  { stack: "main;http_handler;dispatch;post_order;db_transaction;execute;deserialize_rows", value: 76 },
  { stack: "main;http_handler;dispatch;post_order;db_transaction;execute", value: 35 },
  { stack: "main;http_handler;dispatch;post_order;publish_event;kafka_send", value: 22 },
  { stack: "main;http_handler;serialize_response;json_encode", value: 44 },
  { stack: "main;http_handler;serialize_response", value: 8 },
  { stack: "main;worker;poll_queue;sqs_receive", value: 36 },
  { stack: "main;worker;process_job;load_payload;decompress;zstd_decode", value: 29 },
  { stack: "main;worker;process_job;load_payload", value: 8 },
  { stack: "main;worker;process_job;aggregate_metrics;groupby;hash_combine", value: 41 },
  { stack: "main;worker;process_job;aggregate_metrics;groupby", value: 9 },
  { stack: "main;worker;process_job;aggregate_metrics;compute_stats", value: 38 },
  { stack: "main;worker;process_job;persist_result;db_query;execute", value: 27 },
  { stack: "main;worker;process_job;persist_result;s3_put", value: 19 },
  { stack: "main;runtime_gc;mark_phase;trace_objects", value: 48 },
  { stack: "main;runtime_gc;mark_phase;rescan_remembered_set", value: 14 },
  { stack: "main;runtime_gc;sweep_phase;free_unreachable", value: 23 },
  { stack: "main;runtime_gc;sweep_phase;compact_arena", value: 11 },
];

// --- Build nested tree from semicolon-delimited stack paths ----------------
function buildTree(rows) {
  const root = { name: "main", children: [], _idx: {}, value: 0 };
  for (const { stack, value } of rows) {
    const parts = stack.split(";");
    let node = root;
    for (let i = 1; i < parts.length; i++) {
      const part = parts[i];
      if (!node._idx[part]) {
        const child = { name: part, children: [], _idx: {}, value: 0 };
        node._idx[part] = child;
        node.children.push(child);
      }
      node = node._idx[part];
    }
    node.value += value;
  }
  (function strip(n) {
    delete n._idx;
    if (!n.children.length) delete n.children;
    else n.children.forEach(strip);
  })(root);
  return root;
}

const treeRoot = buildTree(samples);

// d3.hierarchy + .sum: each node's value = self_value + Σ children.value.
// d3.partition then lays children horizontally inside the parent's range. When
// children's sum < parent.value (parent has self-time), the parent's bar on
// the row above shows a "gap" — that gap is the parent's self-time.
const rootH = d3.hierarchy(treeRoot)
  .sum((d) => d.value || 0)
  .sort((a, b) => b.value - a.value);

d3.partition().size([iw, 1])(rootH);

const nodes = rootH.descendants();
const maxDepth = d3.max(nodes, (d) => d.depth);
const rowGap = 3;
const rowH = Math.floor(ih / (maxDepth + 1));

// --- Color by top-level module (depth-1 ancestor) --------------------------
function topModule(node) {
  let n = node;
  while (n.depth > 1) n = n.parent;
  return n.data.name;
}

// Modules sorted by total samples (desc) so the biggest gets palette[0].
const modules = (rootH.children || [])
  .slice()
  .sort((a, b) => b.value - a.value)
  .map((c) => c.data.name);
const colorScale = d3.scaleOrdinal().domain(modules).range(t.palette);

// "main" root bar — outside the categorical pool; use the muted anchor.
const mutedAnchor = theme === "dark" ? "#A8A79F" : "#6B6A63";

// Per-fill text-color choice tuned for the Imprint palette (luminance-based
// alone misclassifies ochre and cyan at the edges).
const TEXT_DARK = "#1A1A17";
const TEXT_LIGHT = "#F0EFE8";
const FILL_TO_TEXT = {
  "#009E73": TEXT_LIGHT, // brand green
  "#C475FD": TEXT_DARK,  // lavender
  "#4467A3": TEXT_LIGHT, // blue
  "#BD8233": TEXT_LIGHT, // ochre
  "#AE3030": TEXT_LIGHT, // matte red
  "#2ABCCD": TEXT_DARK,  // cyan
  "#954477": TEXT_LIGHT, // rose
  "#99B314": TEXT_DARK,  // lime
};
const pickTextColor = (fill) => FILL_TO_TEXT[fill] || TEXT_LIGHT;

// --- SVG mount -------------------------------------------------------------
const svg = d3.select("#container").append("svg")
  .attr("width", width).attr("height", height);
const g = svg.append("g").attr("transform", `translate(${margin.left},${margin.top})`);

// --- Bars ------------------------------------------------------------------
const cell = g.selectAll(".cell").data(nodes).join("g")
  .attr("class", "cell")
  .attr("transform", (d) => {
    const x = d.x0;
    const y = ih - (d.depth + 1) * rowH;
    return `translate(${x},${y})`;
  });

cell.append("rect")
  .attr("width", (d) => Math.max(0, d.x1 - d.x0 - 1))
  .attr("height", rowH - rowGap)
  .attr("fill", (d) => d.depth === 0 ? mutedAnchor : colorScale(topModule(d)))
  .attr("stroke", t.pageBg)
  .attr("stroke-width", 0.8);

// Function-name labels — only rendered when the bar is wide enough to fit at
// least 3 characters at the chosen monospace font; otherwise omitted entirely.
const charW = 8.6;
const padX = 10;
const fontPx = 15;
cell.append("text")
  .attr("x", padX)
  .attr("y", (rowH - rowGap) / 2 + 1)
  .attr("dominant-baseline", "middle")
  .style("font-size", `${fontPx}px`)
  .style("font-family", "ui-monospace, SFMono-Regular, Menlo, Consolas, monospace")
  .style("font-weight", "500")
  .attr("fill", (d) => pickTextColor(d.depth === 0 ? mutedAnchor : colorScale(topModule(d))))
  .text((d) => {
    const w = d.x1 - d.x0;
    const maxChars = Math.floor((w - 2 * padX) / charW);
    if (maxChars < 3) return "";
    const name = d.data.name;
    if (name.length <= maxChars) return name;
    return name.slice(0, maxChars - 1) + "…";
  });

// --- X axis (sample counts) ------------------------------------------------
const totalSamples = rootH.value;
const xScale = d3.scaleLinear().domain([0, totalSamples]).range([0, iw]);
const xAxisG = g.append("g")
  .attr("transform", `translate(0,${ih + 6})`)
  .call(d3.axisBottom(xScale).ticks(10).tickFormat(d3.format(",d")).tickSizeOuter(0));
xAxisG.selectAll("text").attr("fill", t.inkSoft).style("font-size", "14px");
xAxisG.selectAll("line").attr("stroke", t.inkSoft);
xAxisG.select(".domain").attr("stroke", t.inkSoft);

svg.append("text")
  .attr("x", margin.left + iw / 2)
  .attr("y", height - 18)
  .attr("text-anchor", "middle")
  .attr("fill", t.inkSoft).style("font-size", "15px")
  .text(`Cumulative CPU samples (${d3.format(",d")(totalSamples)} total) — bar width ∝ time in stack`);

// --- Module legend (centered, below title) ---------------------------------
const swatchW = 24, swatchH = 16, swatchGap = 12, itemGap = 56;
// Pre-measure each label so the legend can be centered tightly.
const tmpText = svg.append("text").style("font-size", "16px").style("visibility", "hidden");
const measure = (s) => { tmpText.text(s); return tmpText.node().getComputedTextLength(); };
const itemWidths = modules.map((m) => swatchW + swatchGap + measure(m));
tmpText.remove();
const legendTotalW = itemWidths.reduce((a, b) => a + b, 0) + itemGap * (modules.length - 1);
let cursor = Math.round((width - legendTotalW) / 2);
const legendY = 78;

modules.forEach((m, i) => {
  const grp = svg.append("g").attr("transform", `translate(${cursor},${legendY})`);
  grp.append("rect")
    .attr("x", 0).attr("y", -12)
    .attr("width", swatchW).attr("height", swatchH)
    .attr("fill", colorScale(m));
  grp.append("text")
    .attr("x", swatchW + swatchGap).attr("y", 0)
    .attr("fill", t.inkSoft).style("font-size", "16px")
    .text(m);
  cursor += itemWidths[i] + itemGap;
});

// --- Title -----------------------------------------------------------------
svg.append("text")
  .attr("x", width / 2).attr("y", 44)
  .attr("text-anchor", "middle")
  .attr("fill", t.ink).style("font-size", "22px").style("font-weight", "600")
  .text("flamegraph-basic · javascript · d3 · anyplot.ai");
Runnable source as JSON, for any HTTP client: https://api.anyplot.ai/specs/flamegraph-basic/d3/code. Any spec id and library id listed in llms-full.txt fit the same URL shape; every URL below is complete and callable.
{
  "spec_id": "flamegraph-basic",
  "language": "javascript",
  "library": "d3",
  "page": "https://anyplot.ai/flamegraph-basic/javascript/d3",
  "hub": "https://anyplot.ai/flamegraph-basic",
  "code_json": "https://api.anyplot.ai/specs/flamegraph-basic/d3/code",
  "spec_json": "https://api.anyplot.ai/specs/flamegraph-basic",
  "render_light_png": "https://storage.googleapis.com/anyplot-images/plots/flamegraph-basic/javascript/d3/plot-light.png",
  "render_dark_png": "https://storage.googleapis.com/anyplot-images/plots/flamegraph-basic/javascript/d3/plot-dark.png",
  "interactive_light_html": "https://storage.googleapis.com/anyplot-images/plots/flamegraph-basic/javascript/d3/plot-light.html",
  "interactive_dark_html": "https://storage.googleapis.com/anyplot-images/plots/flamegraph-basic/javascript/d3/plot-dark.html",
  "quality_score": 90.0,
  "license": "MIT",
  "guide": "https://anyplot.ai/llms.txt"
}
Part of Flame Graph for Performance Profiling on anyplot.ai.