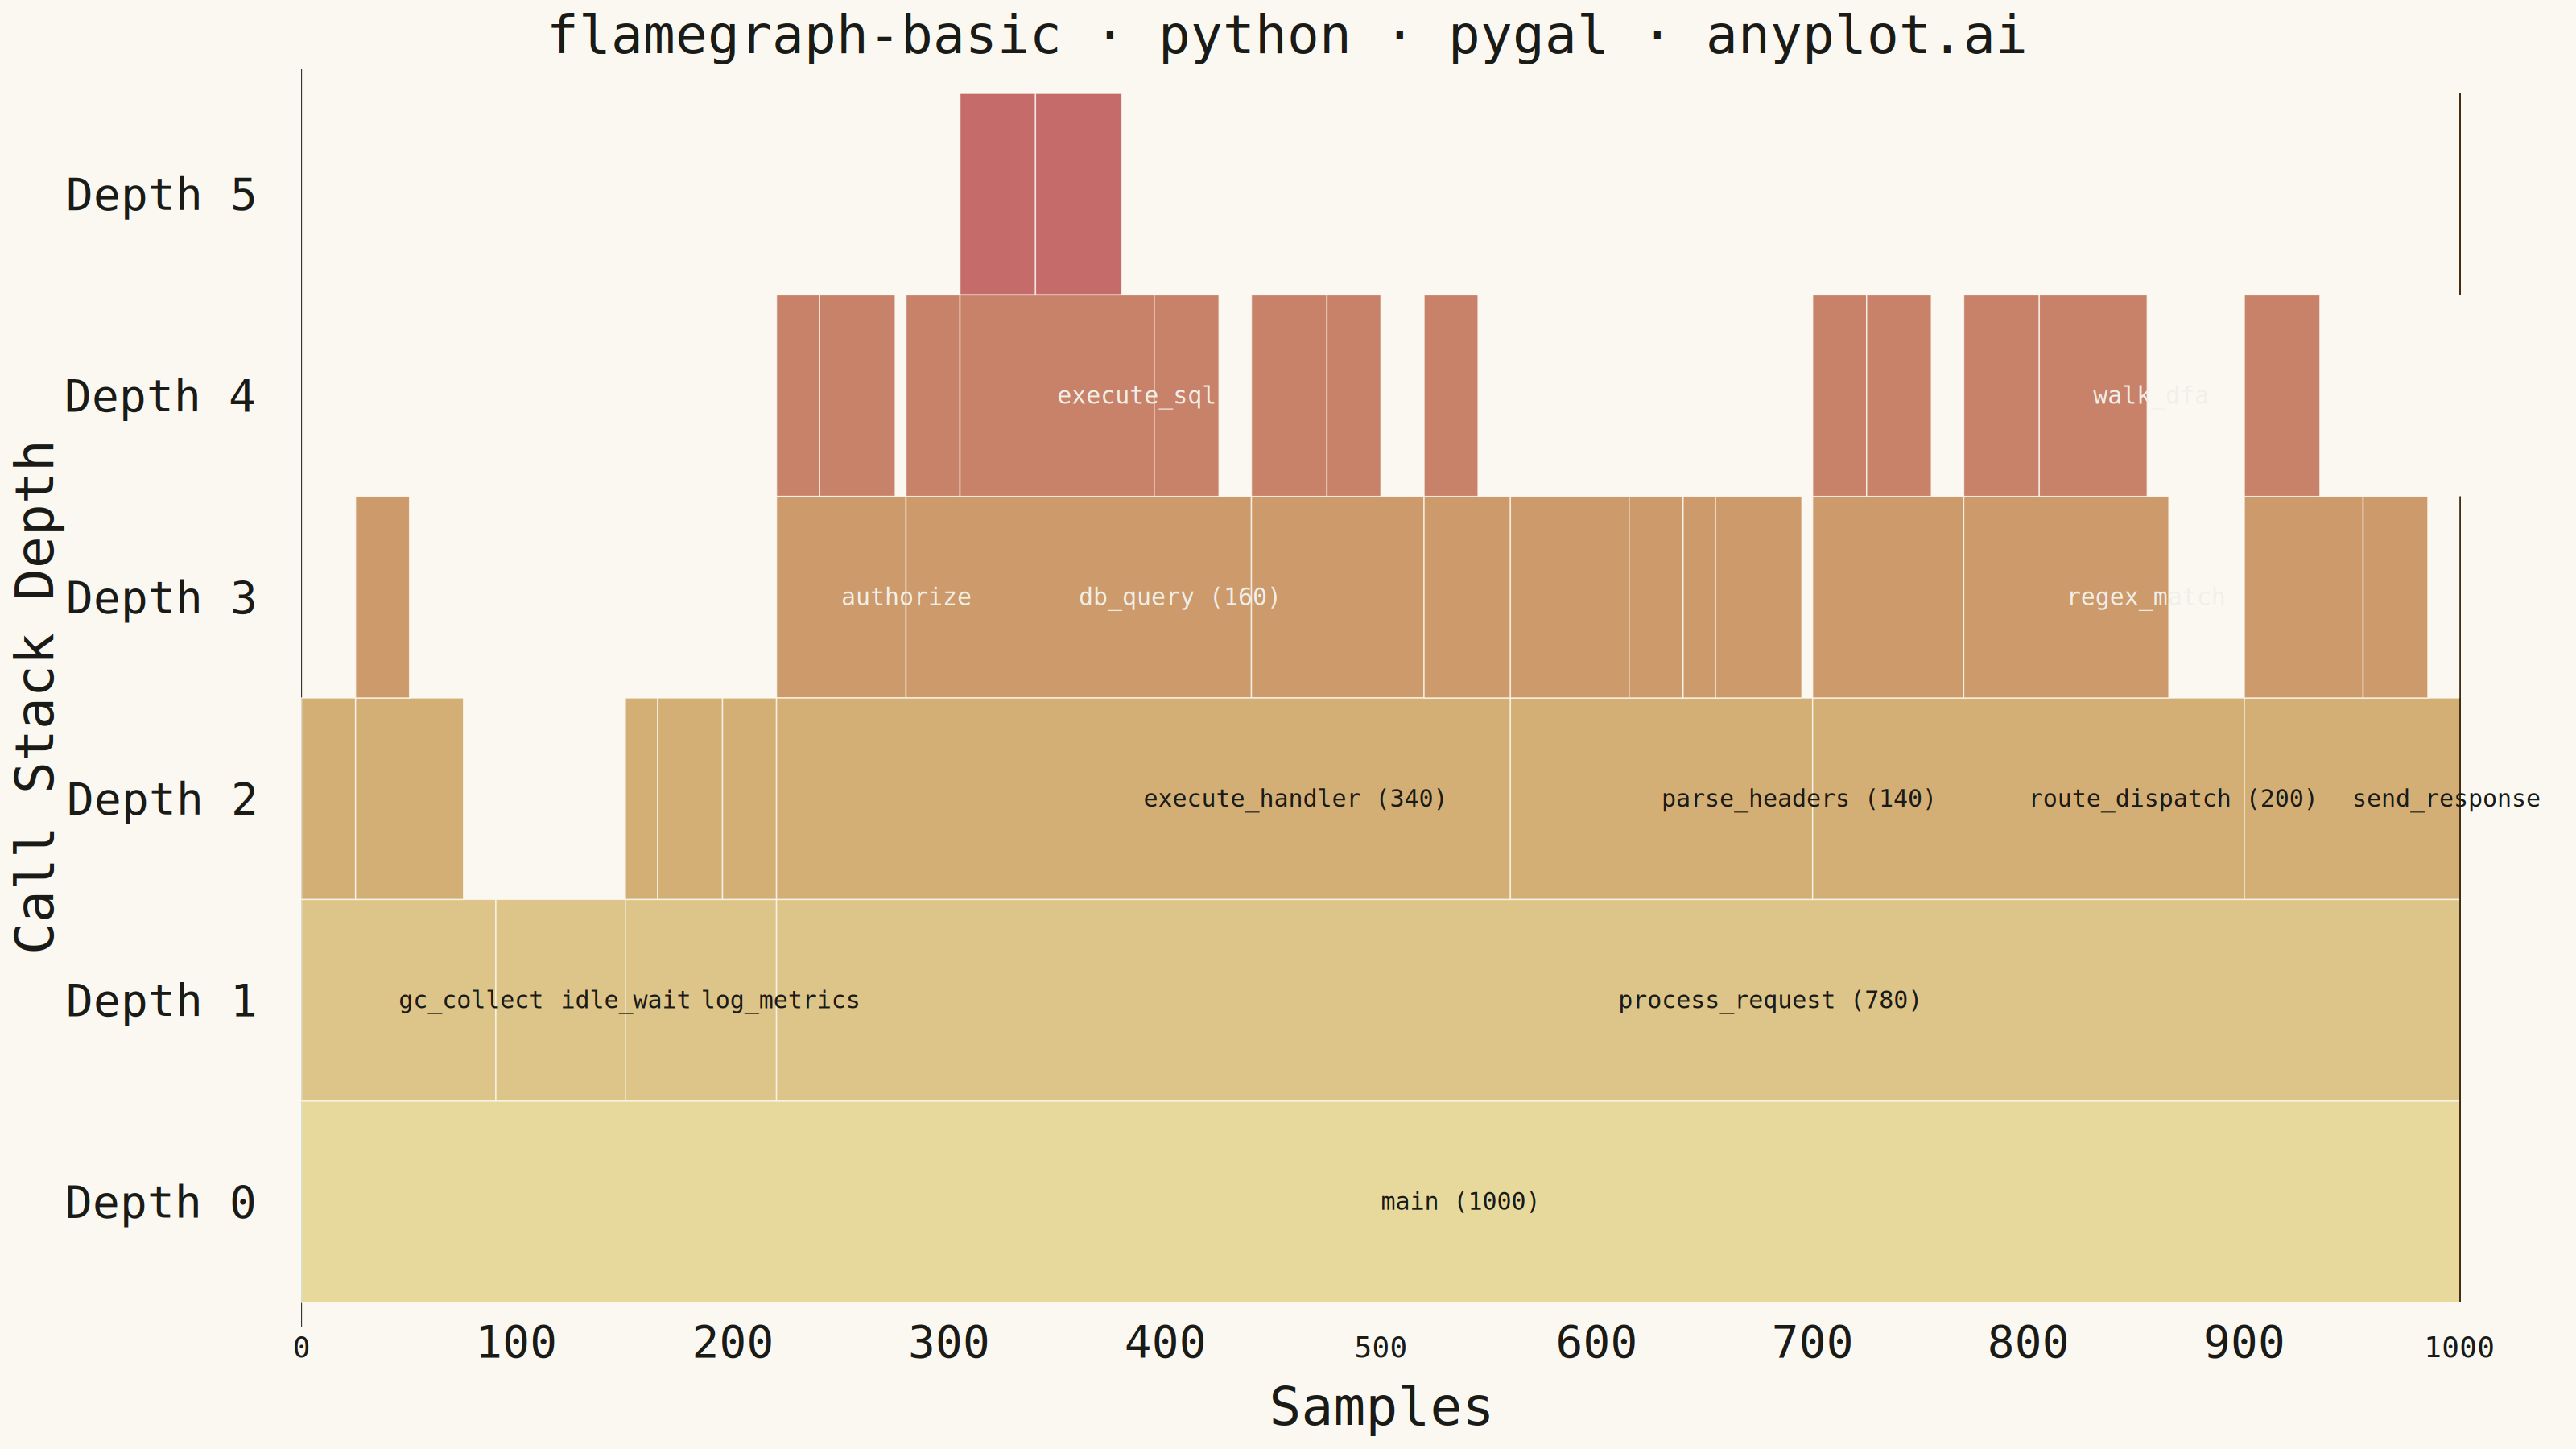
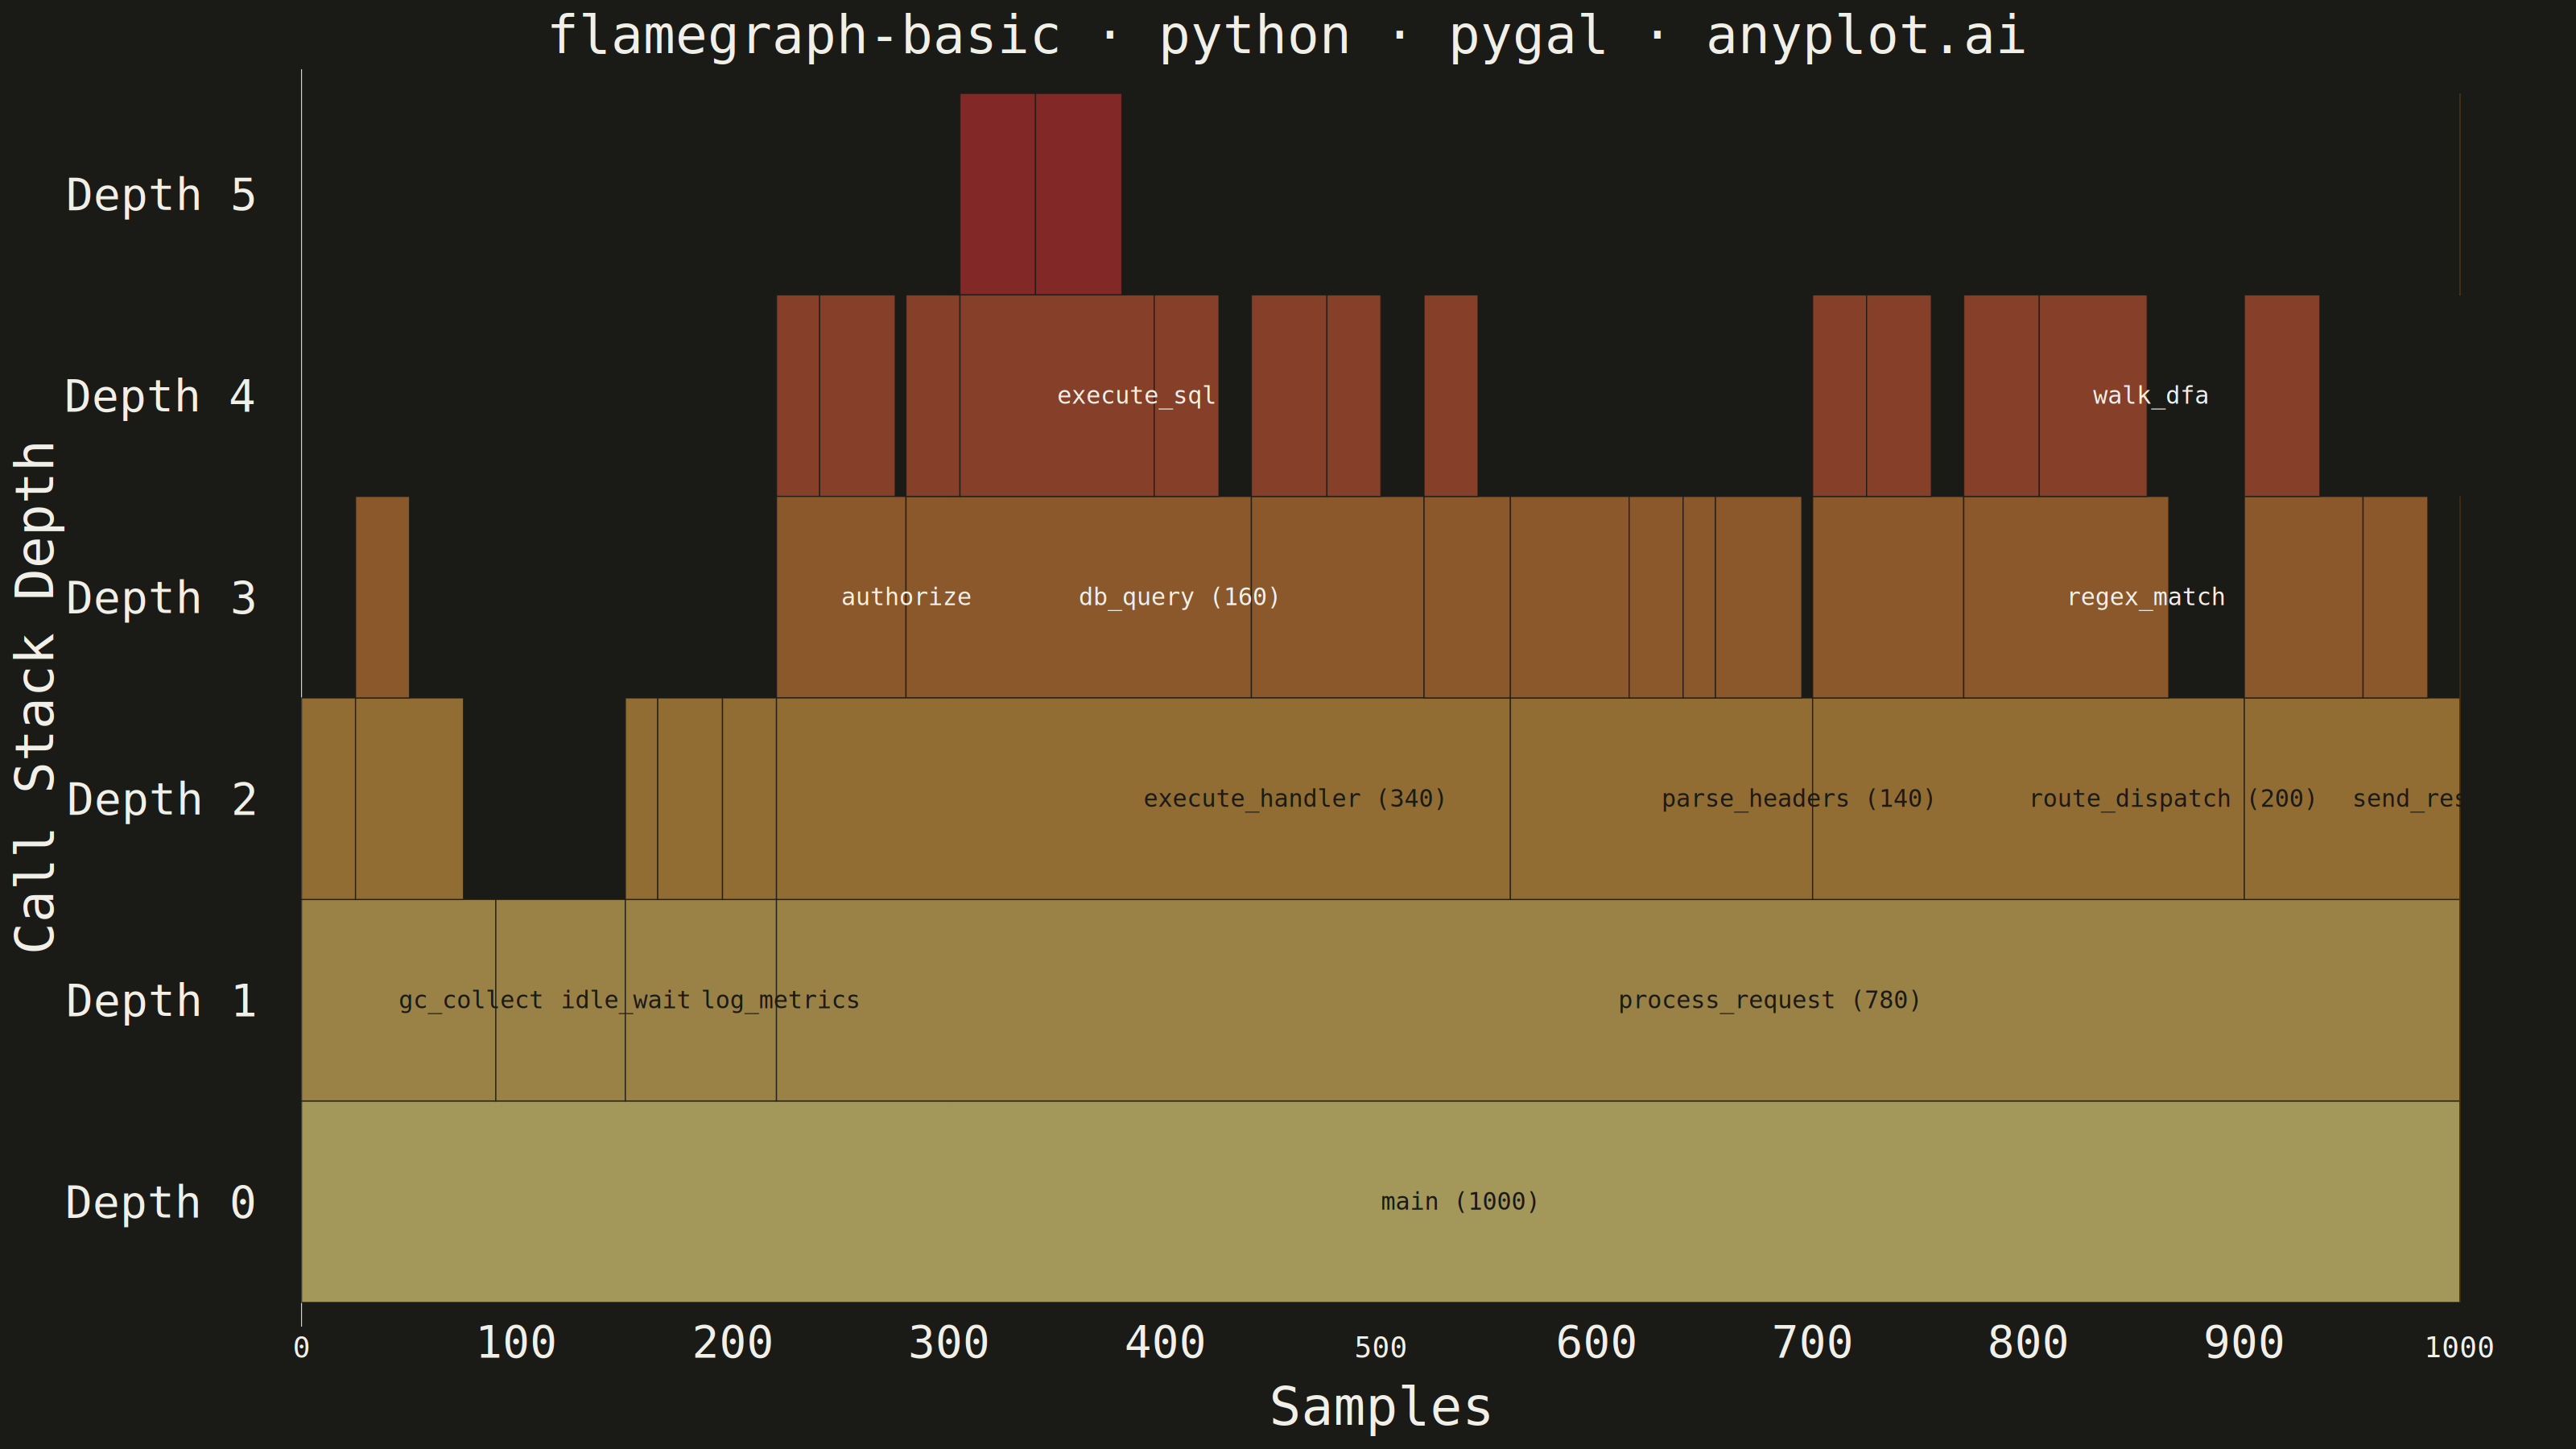
A flame graph visualizes hierarchical call stack data from performance profiling, where each horizontal bar represents a function in the call stack and its width is proportional to the time (or samples) spent in that function. Stacks are layered bottom-to-top showing caller-to-callee relationships. Invented by Brendan Gregg, flame graphs are the standard visualization for identifying CPU bottlenecks and hot code paths across all major programming languages and profiling tools.
""" anyplot.ai
flamegraph-basic: Flame Graph for Performance Profiling
Library: pygal 3.1.0 | Python 3.13.13
Quality: 91/100 | Updated: 2026-06-08
"""

import importlib
import os
import re
import sys
from collections import defaultdict

import cairosvg


# Import pygal package (avoid name collision with this filename)
_saved = sys.path.pop(0)
_pygal = importlib.import_module("pygal")
_Style = importlib.import_module("pygal.style").Style
sys.path.insert(0, _saved)

# Theme tokens
THEME = os.getenv("ANYPLOT_THEME", "light")
PAGE_BG = "#FAF8F1" if THEME == "light" else "#1A1A17"
INK = "#1A1A17" if THEME == "light" else "#F0EFE8"
INK_MUTED = "#6B6A63" if THEME == "light" else "#A8A79F"
INK_DARK = "#1A1A17"  # for bright bars
INK_LIGHT = "#F0EFE8"  # for dark bars (improves contrast on matte-red rows)

# Warm flame-graph gradient built from Imprint anchors: amber → ochre → matte red.
# Flame graphs carry a strong domain convention for warm yellow/orange/red coloring
# (Brendan Gregg), so the Semantic Exception in default-style-guide.md applies —
# we derive the gradient from Imprint members rather than substituting a foreign cmap.
IMPRINT_AMBER = (0xDD, 0xCC, 0x77)
IMPRINT_OCHRE = (0xBD, 0x82, 0x33)
IMPRINT_RED = (0xAE, 0x30, 0x30)

# Data — simulated CPU profile of a web service request handler (Brendan-Gregg
# style stack-trace + sample-count format). 42 unique stacks across 6 depth levels.
stacks = [
    ("main", 1000),
    ("main;process_request", 780),
    ("main;process_request;parse_headers", 140),
    ("main;process_request;parse_headers;decode_base64", 55),
    ("main;process_request;parse_headers;validate_utf8", 40),
    ("main;process_request;parse_headers;normalize_case", 25),
    ("main;process_request;parse_headers;strip_whitespace", 15),
    ("main;process_request;route_dispatch", 200),
    ("main;process_request;route_dispatch;regex_match", 95),
    ("main;process_request;route_dispatch;regex_match;compile_pattern", 35),
    ("main;process_request;route_dispatch;regex_match;walk_dfa", 50),
    ("main;process_request;route_dispatch;lookup_handler", 70),
    ("main;process_request;route_dispatch;lookup_handler;hash_path", 30),
    ("main;process_request;route_dispatch;lookup_handler;cache_get", 25),
    ("main;process_request;execute_handler", 340),
    ("main;process_request;execute_handler;authorize", 60),
    ("main;process_request;execute_handler;authorize;verify_token", 35),
    ("main;process_request;execute_handler;authorize;check_acl", 20),
    ("main;process_request;execute_handler;db_query", 160),
    ("main;process_request;execute_handler;db_query;connect_pool", 25),
    ("main;process_request;execute_handler;db_query;execute_sql", 90),
    ("main;process_request;execute_handler;db_query;execute_sql;send_buffer", 40),
    ("main;process_request;execute_handler;db_query;execute_sql;await_result", 35),
    ("main;process_request;execute_handler;db_query;fetch_rows", 30),
    ("main;process_request;execute_handler;serialize_json", 80),
    ("main;process_request;execute_handler;serialize_json;encode_utf8", 35),
    ("main;process_request;execute_handler;serialize_json;escape_strings", 25),
    ("main;process_request;execute_handler;template_render", 40),
    ("main;process_request;execute_handler;template_render;walk_ast", 25),
    ("main;process_request;send_response", 100),
    ("main;process_request;send_response;compress_gzip", 55),
    ("main;process_request;send_response;compress_gzip;deflate_block", 35),
    ("main;process_request;send_response;write_socket", 30),
    ("main;gc_collect", 90),
    ("main;gc_collect;mark_sweep", 50),
    ("main;gc_collect;mark_sweep;scan_roots", 25),
    ("main;gc_collect;compact_heap", 25),
    ("main;log_metrics", 70),
    ("main;log_metrics;format_json", 30),
    ("main;log_metrics;write_buffer", 25),
    ("main;log_metrics;flush_socket", 15),
    ("main;idle_wait", 60),
]

total_samples = 1000

# Build call-stack tree
tree = {}
for stack_path, samples in stacks:
    node = tree
    for part in stack_path.split(";"):
        if part not in node:
            node[part] = {"_samples": 0}
        node = node[part]
    node["_samples"] = samples

# BFS to compute rectangles per depth: (depth, x_start_frac, width_frac, label, samples)
rectangles = []
queue = [(tree, 0, 0.0)]
while queue:
    current_node, depth, x_offset = queue.pop(0)
    for name in sorted(current_node.keys()):
        if name.startswith("_"):
            continue
        child = current_node[name]
        samples = child.get("_samples", 0)
        if samples == 0:
            continue
        w = samples / total_samples
        rectangles.append((depth, x_offset, w, name, samples))
        child_x = x_offset
        for child_name in sorted(child.keys()):
            if child_name.startswith("_"):
                continue
            grandchild = child[child_name]
            gs = grandchild.get("_samples", 0)
            if gs > 0:
                queue.append(({child_name: grandchild}, depth + 1, child_x))
                child_x += gs / total_samples
        x_offset += w

depth_rects = defaultdict(list)
for depth, x_frac, w_frac, label, samples in rectangles:
    depth_rects[depth].append((x_frac, w_frac, label, samples))
for d in depth_rects:
    depth_rects[d].sort()

max_depth = max(depth_rects.keys())
num_levels = max_depth + 1

# Build ordered segments per depth with transparent spacers for alignment
all_segments = []
for d in range(num_levels):
    segments = []
    current_x = 0.0
    for x_frac, w_frac, label, samples in depth_rects.get(d, []):
        gap = x_frac - current_x
        if gap > 1e-4:
            segments.append((gap * total_samples, "", True))
        segments.append((samples, label, False))
        current_x = x_frac + w_frac
    trailing = 1.0 - current_x
    if trailing > 1e-4:
        segments.append((trailing * total_samples, "", True))
    all_segments.append(segments)

max_segs = max(len(s) for s in all_segments)

# Pre-compute one warm color per depth: amber → ochre → matte red
# Also pick a per-depth label ink: light text on low-luminance bars stays punchy
# on the matte-red rows in both themes (the dark-theme weakness flagged in review).
depth_colors = []
depth_label_inks = []
for d in range(num_levels):
    t = d / max_depth if max_depth else 0.0
    if t < 0.5:
        c0, c1, u = IMPRINT_AMBER, IMPRINT_OCHRE, t / 0.5
    else:
        c0, c1, u = IMPRINT_OCHRE, IMPRINT_RED, (t - 0.5) / 0.5
    r = round(c0[0] + (c1[0] - c0[0]) * u)
    g = round(c0[1] + (c1[1] - c0[1]) * u)
    b = round(c0[2] + (c1[2] - c0[2]) * u)
    depth_colors.append(f"#{r:02X}{g:02X}{b:02X}")
    perceived_lum = 0.299 * r + 0.587 * g + 0.114 * b
    depth_label_inks.append(INK_DARK if perceived_lum >= 130 else INK_LIGHT)

# Style
custom_style = _Style(
    background=PAGE_BG,
    plot_background=PAGE_BG,
    foreground=INK,
    foreground_strong=INK,
    foreground_subtle=INK_MUTED,
    guide_stroke_color=PAGE_BG,
    guide_stroke_dasharray="0,0",
    major_guide_stroke_color=PAGE_BG,
    major_guide_stroke_dasharray="0,0",
    colors=("#BD8233",),
    title_font_size=66,
    label_font_size=56,
    major_label_font_size=36,
    legend_font_size=44,
    value_font_size=30,
    value_label_font_size=30,
    tooltip_font_size=28,
    font_family="DejaVu Sans Mono, Menlo, Consolas, monospace",
    stroke_width=1.5,
)

# Chart — flame graph as a HorizontalStackedBar, one row per stack depth
chart = _pygal.HorizontalStackedBar(
    width=3200,
    height=1800,
    style=custom_style,
    title="flamegraph-basic · python · pygal · anyplot.ai",
    x_title="Samples",
    y_title="Call Stack Depth",
    show_legend=False,
    show_y_guides=False,
    show_x_guides=False,
    print_values=False,
    print_labels=True,
    spacing=0,
    rounded_bars=0,
    margin_top=20,
    margin_bottom=30,
    margin_right=90,
    margin_left=20,
    truncate_label=-1,
    truncate_legend=-1,
)

# Collapse the 6% inter-row gap pygal inserts by default — flame-graph rows must touch
chart._series_margin = 0.0

# Row labels: depth 0 at bottom, leaves on top (matches Brendan Gregg convention)
chart.x_labels = [f"Depth {d}" for d in range(num_levels)]

# In-bar label gating: render label only if it fits inside its bar
# (value_font_size=30 source-px in a monospace font ≈ 18 px-per-char at this canvas)
chart_usable_width_px = 3200 - 220 - 60
px_per_char = 18

# Add one series per stack-column position; each value carries its own bar color + label
for col in range(max_segs):
    values = []
    for d in range(num_levels):
        segs = all_segments[d]
        if col >= len(segs):
            values.append(None)
            continue
        value, label, is_spacer = segs[col]
        if is_spacer:
            values.append(
                {"value": value, "color": "transparent", "style": "stroke: none; fill: transparent; opacity: 0"}
            )
            continue
        color = depth_colors[d]
        with_value = f"{label} ({int(value)})"
        bar_px = (value / total_samples) * chart_usable_width_px
        if len(with_value) * px_per_char <= bar_px:
            display = with_value
        elif len(label) * px_per_char <= bar_px:
            display = label
        else:
            display = ""
        values.append(
            {
                "value": value,
                "color": color,
                "label": display,
                "style": f"stroke: {PAGE_BG}; stroke-width: 1.2; fill: {color}",
            }
        )
    chart.add("", values)

# Output — render SVG, recolor in-bar labels per bar luminance, then write PNG + HTML.
# pygal's CSS sets `.label { fill: ... }` globally. We inject an inline style on each
# in-bar `<text class="label">` based on its y-position → depth → light/dark ink, so
# the matte-red deepest bars get a light ink (the dark-theme weakness flagged in review).
svg_content = chart.render(is_unicode=True)

# Collect unique y-positions from in-bar label text elements (pygal emits x,y,class order)
label_y_pattern = re.compile(r'<text\b[^>]*\by="([0-9.]+)"[^>]*\bclass="label"')
unique_y_values = sorted({float(y) for y in label_y_pattern.findall(svg_content)})
# Row centers from bottom (depth 0) up to deepest leaf (depth num_levels-1)
row_centers_bottom_up = list(reversed(unique_y_values))


def _y_to_depth(y_val):
    return min(range(len(row_centers_bottom_up)), key=lambda d: abs(row_centers_bottom_up[d] - y_val))


def _recolor_label(match):
    attrs, body = match.group(1), match.group(2)
    y_match = re.search(r'\by="([0-9.]+)"', attrs)
    if not y_match:
        return match.group(0)
    depth = _y_to_depth(float(y_match.group(1)))
    return f'<text{attrs} style="fill:{depth_label_inks[depth]}">{body}'


label_pattern = re.compile(r'<text\b([^>]*\bclass="label"[^>]*)>([^<]*)')
svg_content = label_pattern.sub(_recolor_label, svg_content)

cairosvg.svg2png(bytestring=svg_content.encode("utf-8"), write_to=f"plot-{THEME}.png")
html_content = f"""<!DOCTYPE html>
<html>
<head>
    <meta charset="utf-8">
    <title>flamegraph-basic · pygal · anyplot.ai</title>
    <style>
        body {{ margin: 0; display: flex; justify-content: center;
               align-items: center; min-height: 100vh; background: {PAGE_BG}; }}
        .chart {{ max-width: 100%; height: auto; margin: 0; }}
    </style>
</head>
<body>
    <figure class="chart">
        {svg_content}
    </figure>
</body>
</html>
"""

with open(f"plot-{THEME}.html", "w", encoding="utf-8") as fout:
    fout.write(html_content)
Runnable source as JSON, for any HTTP client: https://api.anyplot.ai/specs/flamegraph-basic/pygal/code. Any spec id and library id listed in llms-full.txt fit the same URL shape; every URL below is complete and callable.
{
  "spec_id": "flamegraph-basic",
  "language": "python",
  "library": "pygal",
  "page": "https://anyplot.ai/flamegraph-basic/python/pygal",
  "hub": "https://anyplot.ai/flamegraph-basic",
  "code_json": "https://api.anyplot.ai/specs/flamegraph-basic/pygal/code",
  "spec_json": "https://api.anyplot.ai/specs/flamegraph-basic",
  "render_light_png": "https://storage.googleapis.com/anyplot-images/plots/flamegraph-basic/python/pygal/plot-light.png",
  "render_dark_png": "https://storage.googleapis.com/anyplot-images/plots/flamegraph-basic/python/pygal/plot-dark.png",
  "interactive_light_html": "https://storage.googleapis.com/anyplot-images/plots/flamegraph-basic/python/pygal/plot-light.html",
  "interactive_dark_html": "https://storage.googleapis.com/anyplot-images/plots/flamegraph-basic/python/pygal/plot-dark.html",
  "quality_score": 91.0,
  "license": "MIT",
  "guide": "https://anyplot.ai/llms.txt"
}
Part of Flame Graph for Performance Profiling on anyplot.ai.