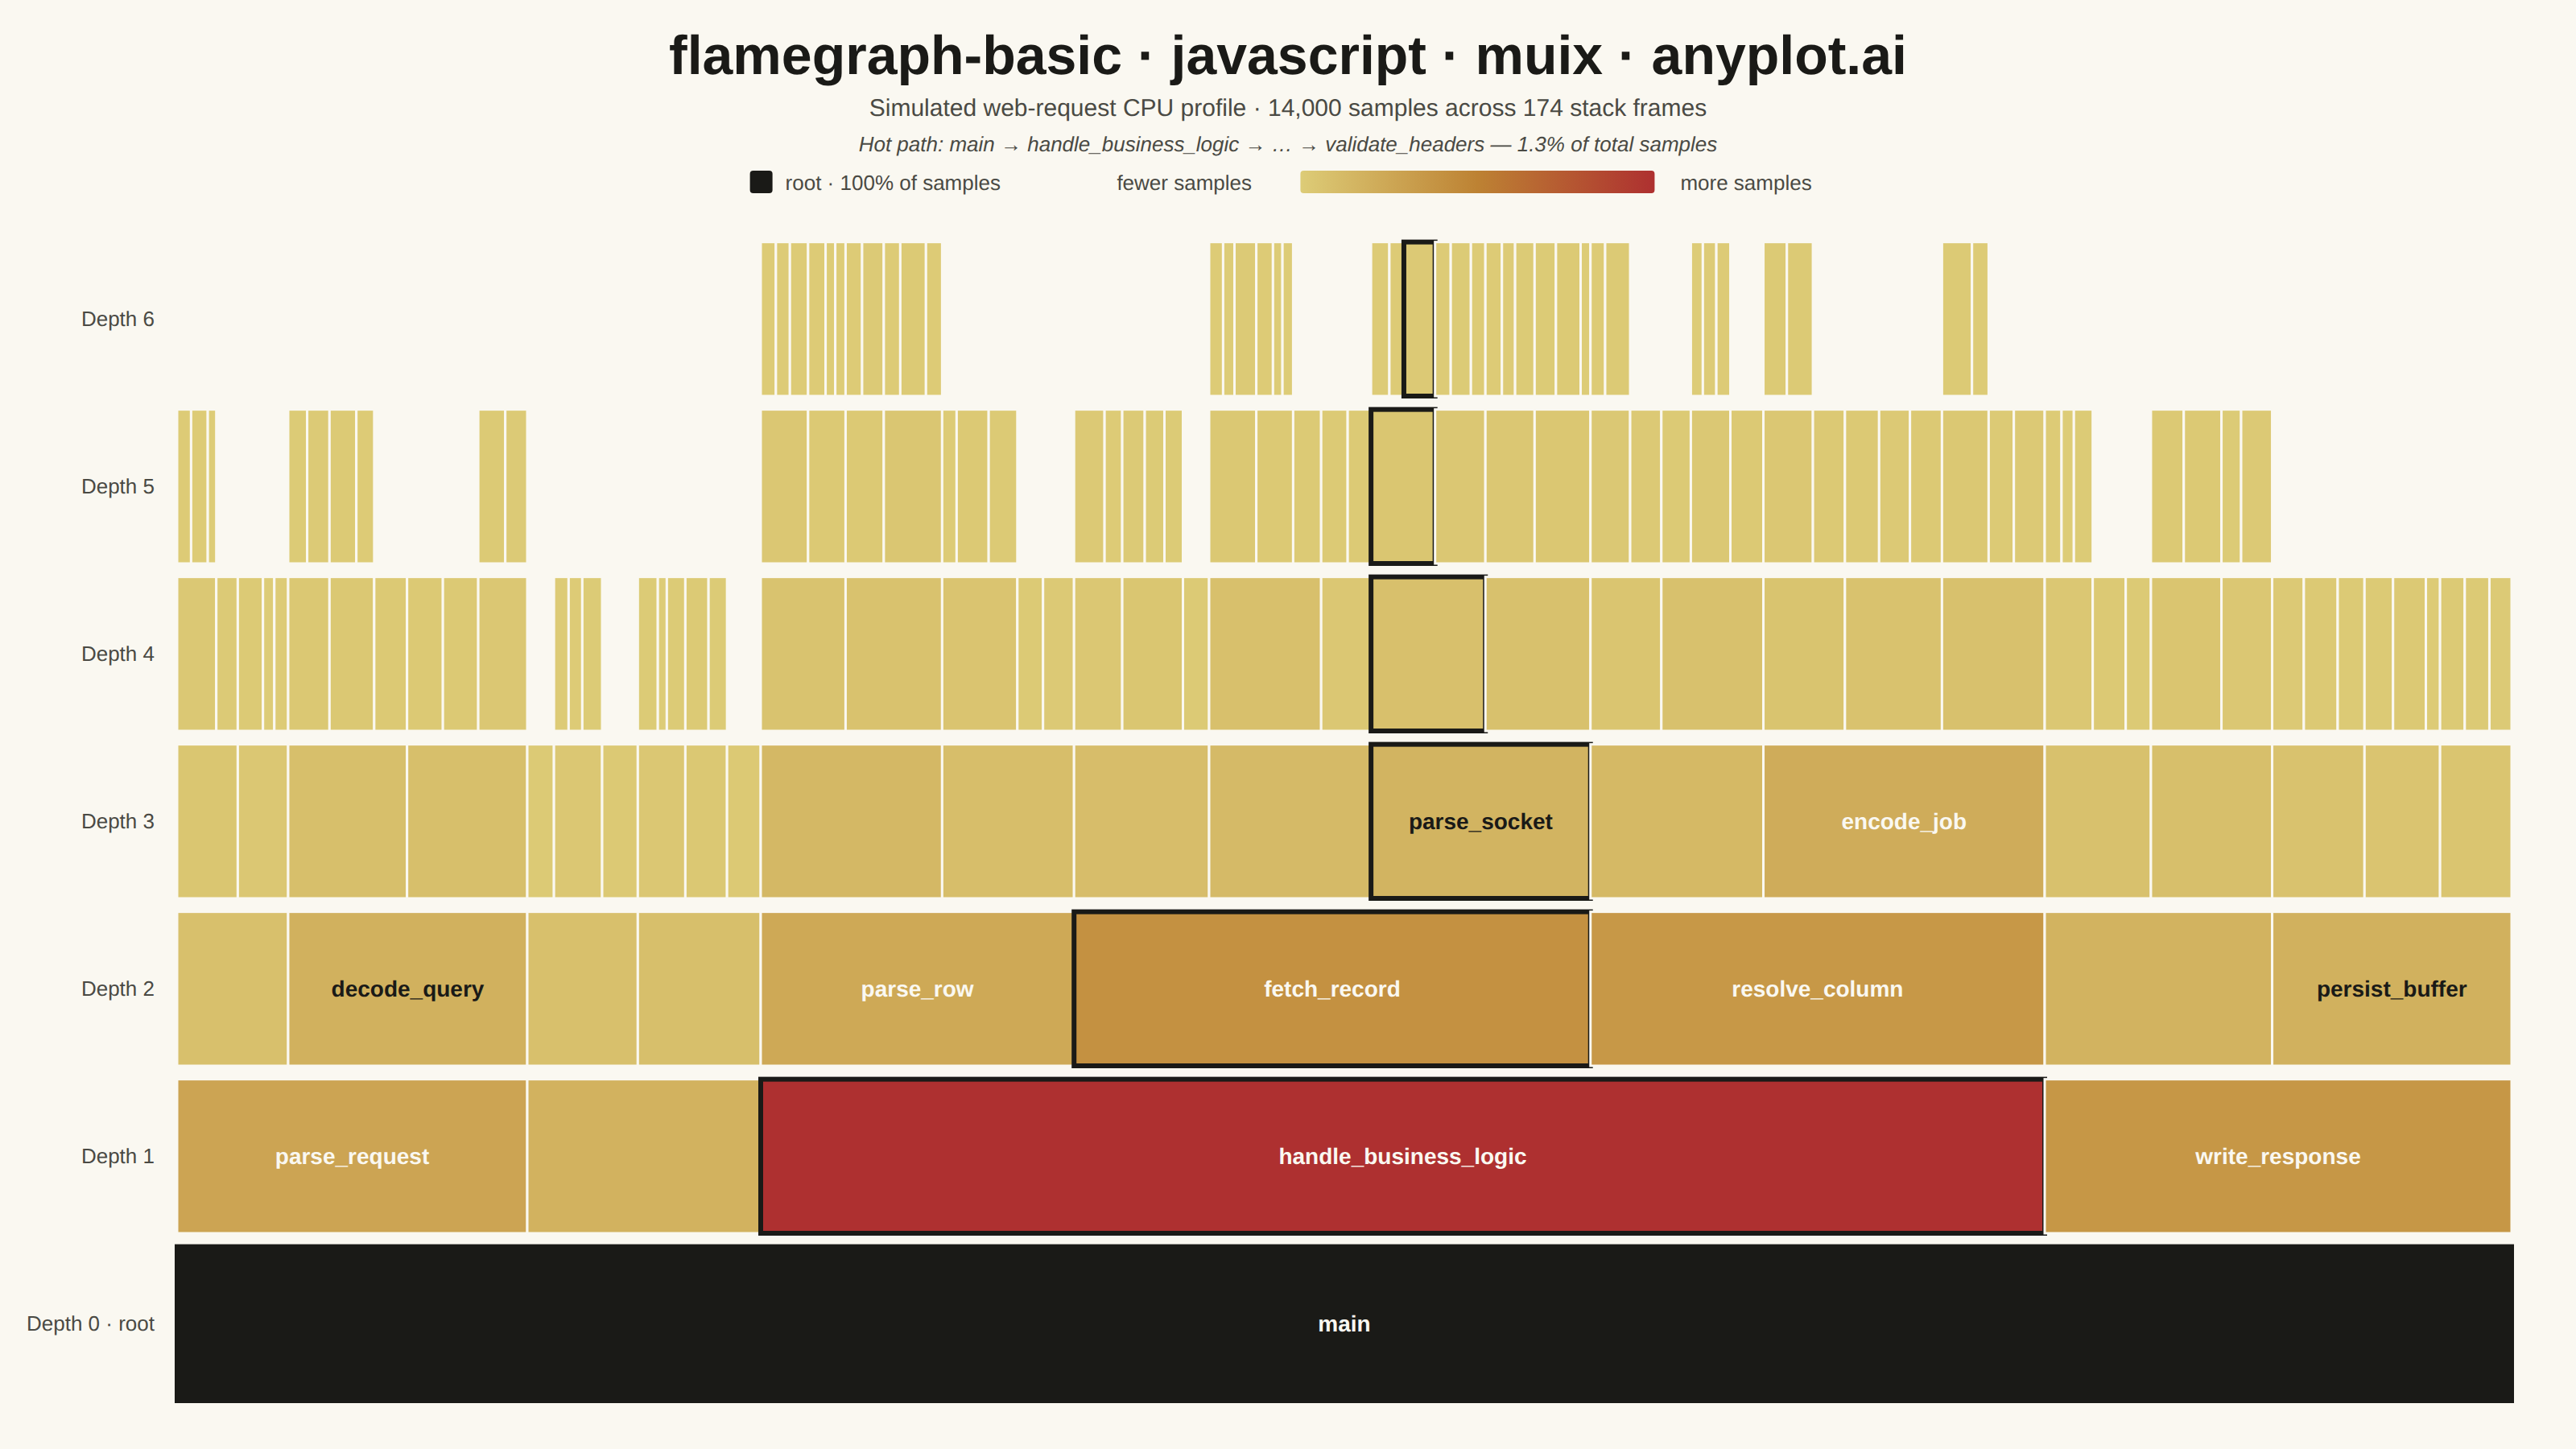
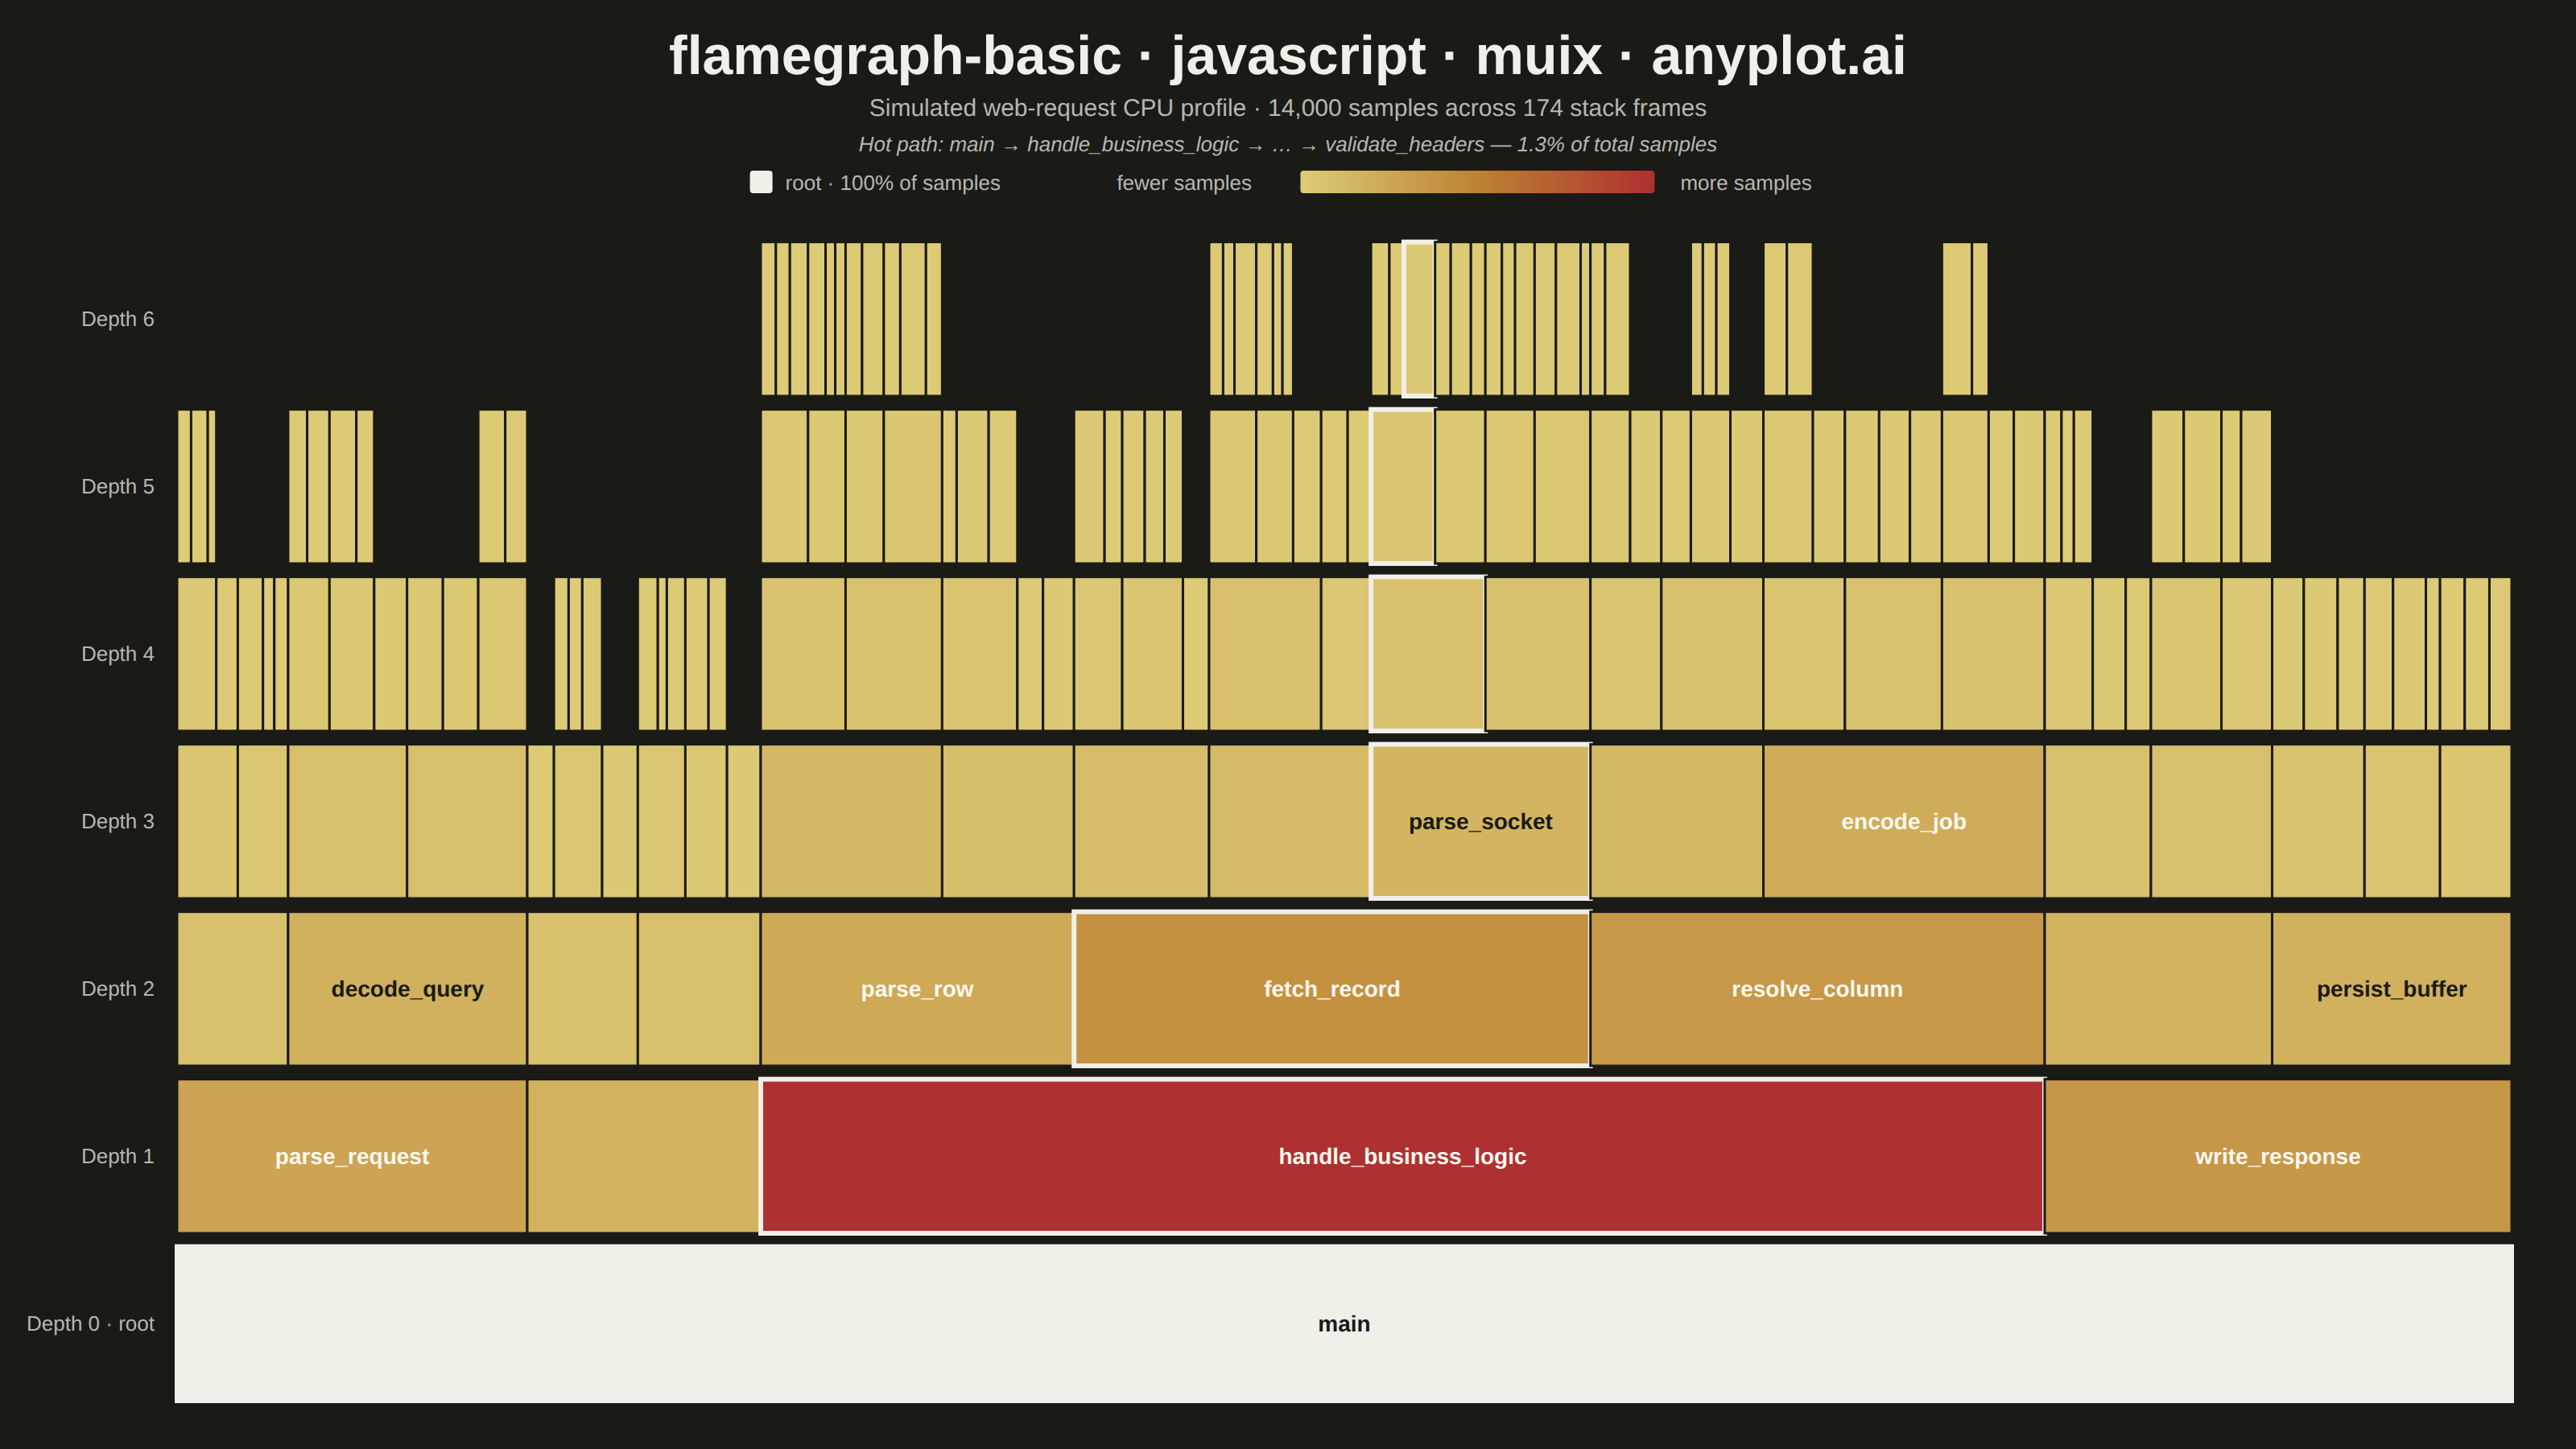
The same plot in 14 other libraries — JavaScript: Chart.js, D3.js, Apache ECharts, Highcharts; Python: Altair, Bokeh, lets-plot, Matplotlib, Plotly, plotnine, Pygal, Seaborn; R: ggplot2; Julia: Makie.jl. Compare all 15 side by side: Flame Graph for Performance Profiling in Python, R, Julia and JavaScript.
A flame graph visualizes hierarchical call stack data from performance profiling, where each horizontal bar represents a function in the call stack and its width is proportional to the time (or samples) spent in that function. Stacks are layered bottom-to-top showing caller-to-callee relationships. Invented by Brendan Gregg, flame graphs are the standard visualization for identifying CPU bottlenecks and hot code paths across all major programming languages and profiling tools.
// anyplot.ai
// flamegraph-basic: Flame Graph for Performance Profiling
// Library: muix 7.29.1 | JavaScript 22.23.2
// Quality: 96/100 | Created: 2026-08-20
import { ChartContainer } from "@mui/x-charts/ChartContainer";
import { useXScale, useYScale } from "@mui/x-charts/hooks";

const t = window.ANYPLOT_TOKENS;

const title = "flamegraph-basic · javascript · muix · anyplot.ai";
const titleFontSize = Math.max(16, Math.round(34 * Math.min(1, 67 / title.length)));

// --- Data: a simulated CPU profile of a web-request handler, expressed as a
// call tree (function -> children) and fanned out via a fixed-seed LCG into
// dozens of realistic-looking stack traces -- comfortably inside the spec's
// 50-500 unique stack traces -- rather than a small illustrative example.
// Each node's samples equal the sum of its children's, exactly as a real
// profiler reports it. -------------------------------------------------------
let seed = 20260820;
function rand() {
  seed = (seed * 48271) % 2147483647;
  return seed / 2147483647;
}

const VERB = ["parse", "validate", "compute", "fetch", "serialize", "cache", "dispatch", "format", "aggregate", "filter", "normalize", "encode", "decode", "resolve", "persist", "merge"];
const NOUN = ["headers", "payload", "record", "query", "response", "token", "schema", "row", "buffer", "session", "event", "job", "metric", "column", "batch", "socket"];

const usedNames = new Set(["main", "parse_request", "authenticate_user", "handle_business_logic", "write_response"]);
function makeName() {
  let name;
  do {
    name = `${VERB[Math.floor(rand() * VERB.length)]}_${NOUN[Math.floor(rand() * NOUN.length)]}`;
  } while (usedNames.has(name));
  usedNames.add(name);
  return name;
}

// Recursively split `samples` into 2-3 unevenly-weighted children until
// `depth` runs out or a subtree is too small to split further, so the
// resulting traces read as an uneven, realistic profile rather than a
// perfectly balanced synthetic tree.
function expand(node, depth) {
  if (depth <= 0 || node.samples < 220) return node;
  const childCount = 2 + Math.floor(rand() * 2); // 2-3 children
  const weights = Array.from({ length: childCount }, () => 0.5 + rand());
  const weightSum = weights.reduce((a, b) => a + b, 0);
  let remaining = node.samples;
  node.children = weights.map((w, i) => {
    const samples = i === childCount - 1 ? remaining : Math.round((w / weightSum) * node.samples);
    remaining -= samples;
    return expand({ name: makeName(), samples }, depth - 1);
  });
  return node;
}

const callTree = {
  name: "main",
  children: [
    expand({ name: "parse_request", samples: 2100 }, 4),
    expand({ name: "authenticate_user", samples: 1400 }, 4),
    expand({ name: "handle_business_logic", samples: 7700 }, 5),
    expand({ name: "write_response", samples: 2800 }, 4),
  ],
};
callTree.samples = callTree.children.reduce((sum, c) => sum + c.samples, 0);
const TOTAL_SAMPLES = callTree.samples;

// Flatten the tree into positioned frames: x0/width in sample units (so bar
// width is proportional to samples, per the spec), depth = stack row.
// Siblings are laid out contiguously left-to-right with no gaps, standard
// flame-graph (icicle) layout.
function layoutFrames(node, depth, x0, out) {
  out.push({ name: node.name, depth, x0, width: node.samples, samples: node.samples });
  let cursor = x0;
  (node.children ?? []).forEach((child) => {
    layoutFrames(child, depth + 1, cursor, out);
    cursor += child.samples;
  });
  return out;
}
const frames = layoutFrames(callTree, 0, 0, []);
const maxDepth = Math.max(...frames.map((f) => f.depth));

// The dominant caller->callee chain (always descending into the heaviest
// child) -- the "hot path" a profiler reader would chase first.
function dominantChain(node, path) {
  path.push(node.name);
  if (!node.children || node.children.length === 0) return path;
  const hottestChild = node.children.reduce((a, b) => (b.samples > a.samples ? b : a));
  return dominantChain(hottestChild, path);
}
const HOT_CHAIN = dominantChain(callTree, []);
const HOT_PATH_NAMES = new Set(HOT_CHAIN);
const hotLeafSamples = (() => {
  let node = callTree;
  for (let i = 1; i < HOT_CHAIN.length; i++) node = node.children.find((c) => c.name === HOT_CHAIN[i]);
  return node.samples;
})();
const hotLeafPct = ((hotLeafSamples / TOTAL_SAMPLES) * 100).toFixed(1);
const hotPathCaption =
  HOT_CHAIN.length <= 4
    ? `Hot path: ${HOT_CHAIN.join(" → ")} — ${hotLeafPct}% of total samples`
    : `Hot path: ${HOT_CHAIN[0]} → ${HOT_CHAIN[1]} → … → ${HOT_CHAIN[HOT_CHAIN.length - 1]} — ${hotLeafPct}% of total samples`;

// --- Color: the spec's Notes call for "a warm color palette (yellows,
// oranges, reds) following the conventional flame graph aesthetic" -- built
// purely from Imprint anchors (amber/ochre/matte-red), keyed to each frame's
// share of total samples so hotter (more-sampled) frames read redder. The
// root is the 100%-baseline and keeps the theme-adaptive neutral treatment
// instead of joining the gradient. ------------------------------------------
const WARM_STOPS = [
  [221, 204, 119], // #DDCC77 amber
  [189, 130, 51], // #BD8233 ochre
  [174, 48, 48], // #AE3030 matte red
];
function warmColorRgb(u) {
  const clamped = Math.min(1, Math.max(0, u));
  const scaled = clamped * (WARM_STOPS.length - 1);
  const i = Math.min(WARM_STOPS.length - 2, Math.floor(scaled));
  const frac = scaled - i;
  return [0, 1, 2].map((c) => Math.round(WARM_STOPS[i][c] + (WARM_STOPS[i + 1][c] - WARM_STOPS[i][c]) * frac));
}
function relLuminance([r, g, b]) {
  const srgb = [r, g, b].map((v) => v / 255).map((v) => (v <= 0.03928 ? v / 12.92 : Math.pow((v + 0.055) / 1.055, 2.4)));
  return 0.2126 * srgb[0] + 0.7152 * srgb[1] + 0.0722 * srgb[2];
}
const nonRootPcts = frames.filter((f) => f.depth > 0).map((f) => f.samples / TOTAL_SAMPLES);
const MIN_PCT = Math.min(...nonRootPcts);
const MAX_PCT = Math.max(...nonRootPcts);

const ROW_H = 0.92; // fraction of each depth row's band actually drawn (rest = gap)
const LABEL_FONT_SIZE = 14;
const CHAR_WIDTH_RATIO = 0.58; // rough average glyph width, in units of font size
const MARGIN = { top: 142, right: 40, bottom: 30, left: 110 };

// Each stack frame as a rect, sized/positioned from the layout above. The
// function name is drawn inside the bar only when it actually fits -- no
// rotated or truncated text, per the spec's "wide enough to fit" rule. A
// native <title> gives every frame a real (non-fake) hover tooltip. Frames
// on the dominant hot path get a bolder outline so the reader's eye is
// drawn straight to it instead of having to compare bar widths by hand.
function FlameFrames() {
  const xs = useXScale();
  const ys = useYScale();
  return (
    <g>
      {frames.map((f) => {
        const xLeft = xs(f.x0);
        const xRight = xs(f.x0 + f.width);
        const yTop = ys(f.depth + ROW_H);
        const yBottom = ys(f.depth);
        const w = xRight - xLeft;
        const h = yBottom - yTop;
        const pct = (f.samples / TOTAL_SAMPLES) * 100;
        const isRoot = f.depth === 0;
        const isHot = HOT_PATH_NAMES.has(f.name);
        const rgb = isRoot ? null : warmColorRgb((pct / 100 - MIN_PCT) / (MAX_PCT - MIN_PCT || 1));
        const fill = isRoot ? t.ink : `rgb(${rgb[0]}, ${rgb[1]}, ${rgb[2]})`;
        const labelFill = isRoot ? t.pageBg : relLuminance(rgb) > 0.45 ? "#1A1A17" : "#FAF8F1";
        const fits = w - 14 >= f.name.length * LABEL_FONT_SIZE * CHAR_WIDTH_RATIO;
        return (
          <g key={f.name}>
            <rect x={xLeft} y={yTop} width={w} height={h} fill={fill} stroke={isHot ? t.ink : t.pageBg} strokeWidth={isHot ? 3 : 1.5}>
              <title>{`${f.name}: ${f.samples.toLocaleString()} samples (${pct.toFixed(1)}%)`}</title>
            </rect>
            {fits && (
              <text
                x={xLeft + w / 2}
                y={yTop + h / 2}
                textAnchor="middle"
                dominantBaseline="central"
                fontSize={LABEL_FONT_SIZE}
                fontWeight={600}
                fill={labelFill}
                pointerEvents="none"
              >
                {f.name}
              </text>
            )}
          </g>
        );
      })}
    </g>
  );
}

// Row labels on the left -- the chart has no numeric x-axis (bar width is a
// proportion, not a metric to read off a scale; x-position is layout-only,
// not temporal -- see spec), so depth is the only axis worth labeling.
function DepthLabels() {
  const ys = useYScale();
  return (
    <g fontSize={13} fill={t.inkSoft} textAnchor="end">
      {Array.from({ length: maxDepth + 1 }, (_, d) => (
        <text key={d} x={MARGIN.left - 14} y={ys(d + ROW_H / 2)} dominantBaseline="central">
          {d === 0 ? "Depth 0 · root" : `Depth ${d}`}
        </text>
      ))}
    </g>
  );
}

// Color key: the root's neutral swatch plus the warm amber->ochre->red scale
// used for every other frame, keyed to each frame's share of total samples.
function HeatLegend() {
  const FS = 13;
  const CHAR_W = FS * 0.58;
  const { width } = window.ANYPLOT_SIZE;
  const y = 118;
  const barW = 220;
  const barH = 14;
  const rootLabel = "root · 100% of samples";
  const leftLabel = "fewer samples";
  const rightLabel = "more samples";
  const rootSwatchW = 14;
  const rootBlockW = rootSwatchW + 8 + rootLabel.length * CHAR_W;
  const leftLabelW = leftLabel.length * CHAR_W;
  const rightLabelW = rightLabel.length * CHAR_W;
  const GAP = 16;
  const SECTION_GAP = 40;
  const barBlockW = leftLabelW + GAP + barW + GAP + rightLabelW;
  const totalWidth = rootBlockW + SECTION_GAP + barBlockW;

  let x = width / 2 - totalWidth / 2;
  const rootSwatchX = x;
  const rootLabelX = rootSwatchX + rootSwatchW + 8;
  x += rootBlockW + SECTION_GAP;
  const leftLabelX = x;
  x += leftLabelW + GAP;
  const barX = x;
  x += barW + GAP;
  const rightLabelX = x;

  return (
    <g fontSize={FS} fill={t.inkSoft}>
      <defs>
        <linearGradient id="flamegraphHeatGradient" x1="0%" x2="100%" y1="0%" y2="0%">
          <stop offset="0%" stopColor="#DDCC77" />
          <stop offset="50%" stopColor="#BD8233" />
          <stop offset="100%" stopColor="#AE3030" />
        </linearGradient>
      </defs>
      <rect x={rootSwatchX} y={y - rootSwatchW + 2} width={rootSwatchW} height={rootSwatchW} rx={2} fill={t.ink} />
      <text x={rootLabelX} y={y}>
        {rootLabel}
      </text>
      <text x={leftLabelX} y={y}>
        {leftLabel}
      </text>
      <rect x={barX} y={y - barH + 2} width={barW} height={barH} rx={2} fill="url(#flamegraphHeatGradient)" />
      <text x={rightLabelX} y={y}>
        {rightLabel}
      </text>
    </g>
  );
}

// --- Chart (default-exported component -- the harness mounts it) -------------
export default function Chart() {
  const { width, height } = window.ANYPLOT_SIZE;
  const subtitle = `Simulated web-request CPU profile · ${TOTAL_SAMPLES.toLocaleString()} samples across ${frames.length} stack frames`;

  return (
    <ChartContainer
      width={width}
      height={height}
      series={[]}
      margin={MARGIN}
      xAxis={[{ scaleType: "linear", min: 0, max: TOTAL_SAMPLES, disableLine: true, disableTicks: true, valueFormatter: () => "" }]}
      yAxis={[{ scaleType: "linear", min: 0, max: maxDepth + 1, disableLine: true, disableTicks: true, valueFormatter: () => "" }]}
      skipAnimation
    >
      <FlameFrames />
      <DepthLabels />
      <HeatLegend />
      <text x={width / 2} y={46} textAnchor="middle" fontSize={titleFontSize} fontWeight={600} fill={t.ink}>
        {title}
      </text>
      <text x={width / 2} y={72} textAnchor="middle" fontSize={15} fill={t.inkSoft}>
        {subtitle}
      </text>
      <text x={width / 2} y={94} textAnchor="middle" fontSize={13} fontStyle="italic" fill={t.inkSoft}>
        {hotPathCaption}
      </text>
    </ChartContainer>
  );
}
Runnable source as JSON, for any HTTP client: https://api.anyplot.ai/specs/flamegraph-basic/muix/code. Any spec id and library id listed in llms-full.txt fit the same URL shape; every URL below is complete and callable.
{
  "spec_id": "flamegraph-basic",
  "language": "javascript",
  "library": "muix",
  "page": "https://anyplot.ai/flamegraph-basic/javascript/muix",
  "hub": "https://anyplot.ai/flamegraph-basic",
  "code_json": "https://api.anyplot.ai/specs/flamegraph-basic/muix/code",
  "spec_json": "https://api.anyplot.ai/specs/flamegraph-basic",
  "render_light_png": "https://storage.googleapis.com/anyplot-images/plots/flamegraph-basic/javascript/muix/plot-light.png",
  "render_dark_png": "https://storage.googleapis.com/anyplot-images/plots/flamegraph-basic/javascript/muix/plot-dark.png",
  "interactive_light_html": "https://storage.googleapis.com/anyplot-images/plots/flamegraph-basic/javascript/muix/plot-light.html",
  "interactive_dark_html": "https://storage.googleapis.com/anyplot-images/plots/flamegraph-basic/javascript/muix/plot-dark.html",
  "quality_score": 96.0,
  "license": "MIT",
  "guide": "https://anyplot.ai/llms.txt"
}
Part of Flame Graph for Performance Profiling on anyplot.ai.