The same plot in 14 other libraries — Python: Altair, Bokeh, lets-plot, Matplotlib, Plotly, plotnine, Pygal, Seaborn; R: ggplot2; JavaScript: Chart.js, D3.js, Apache ECharts, Highcharts, MUI X Charts. Compare all 15 side by side: Flame Graph for Performance Profiling in Python, R, Julia and JavaScript.
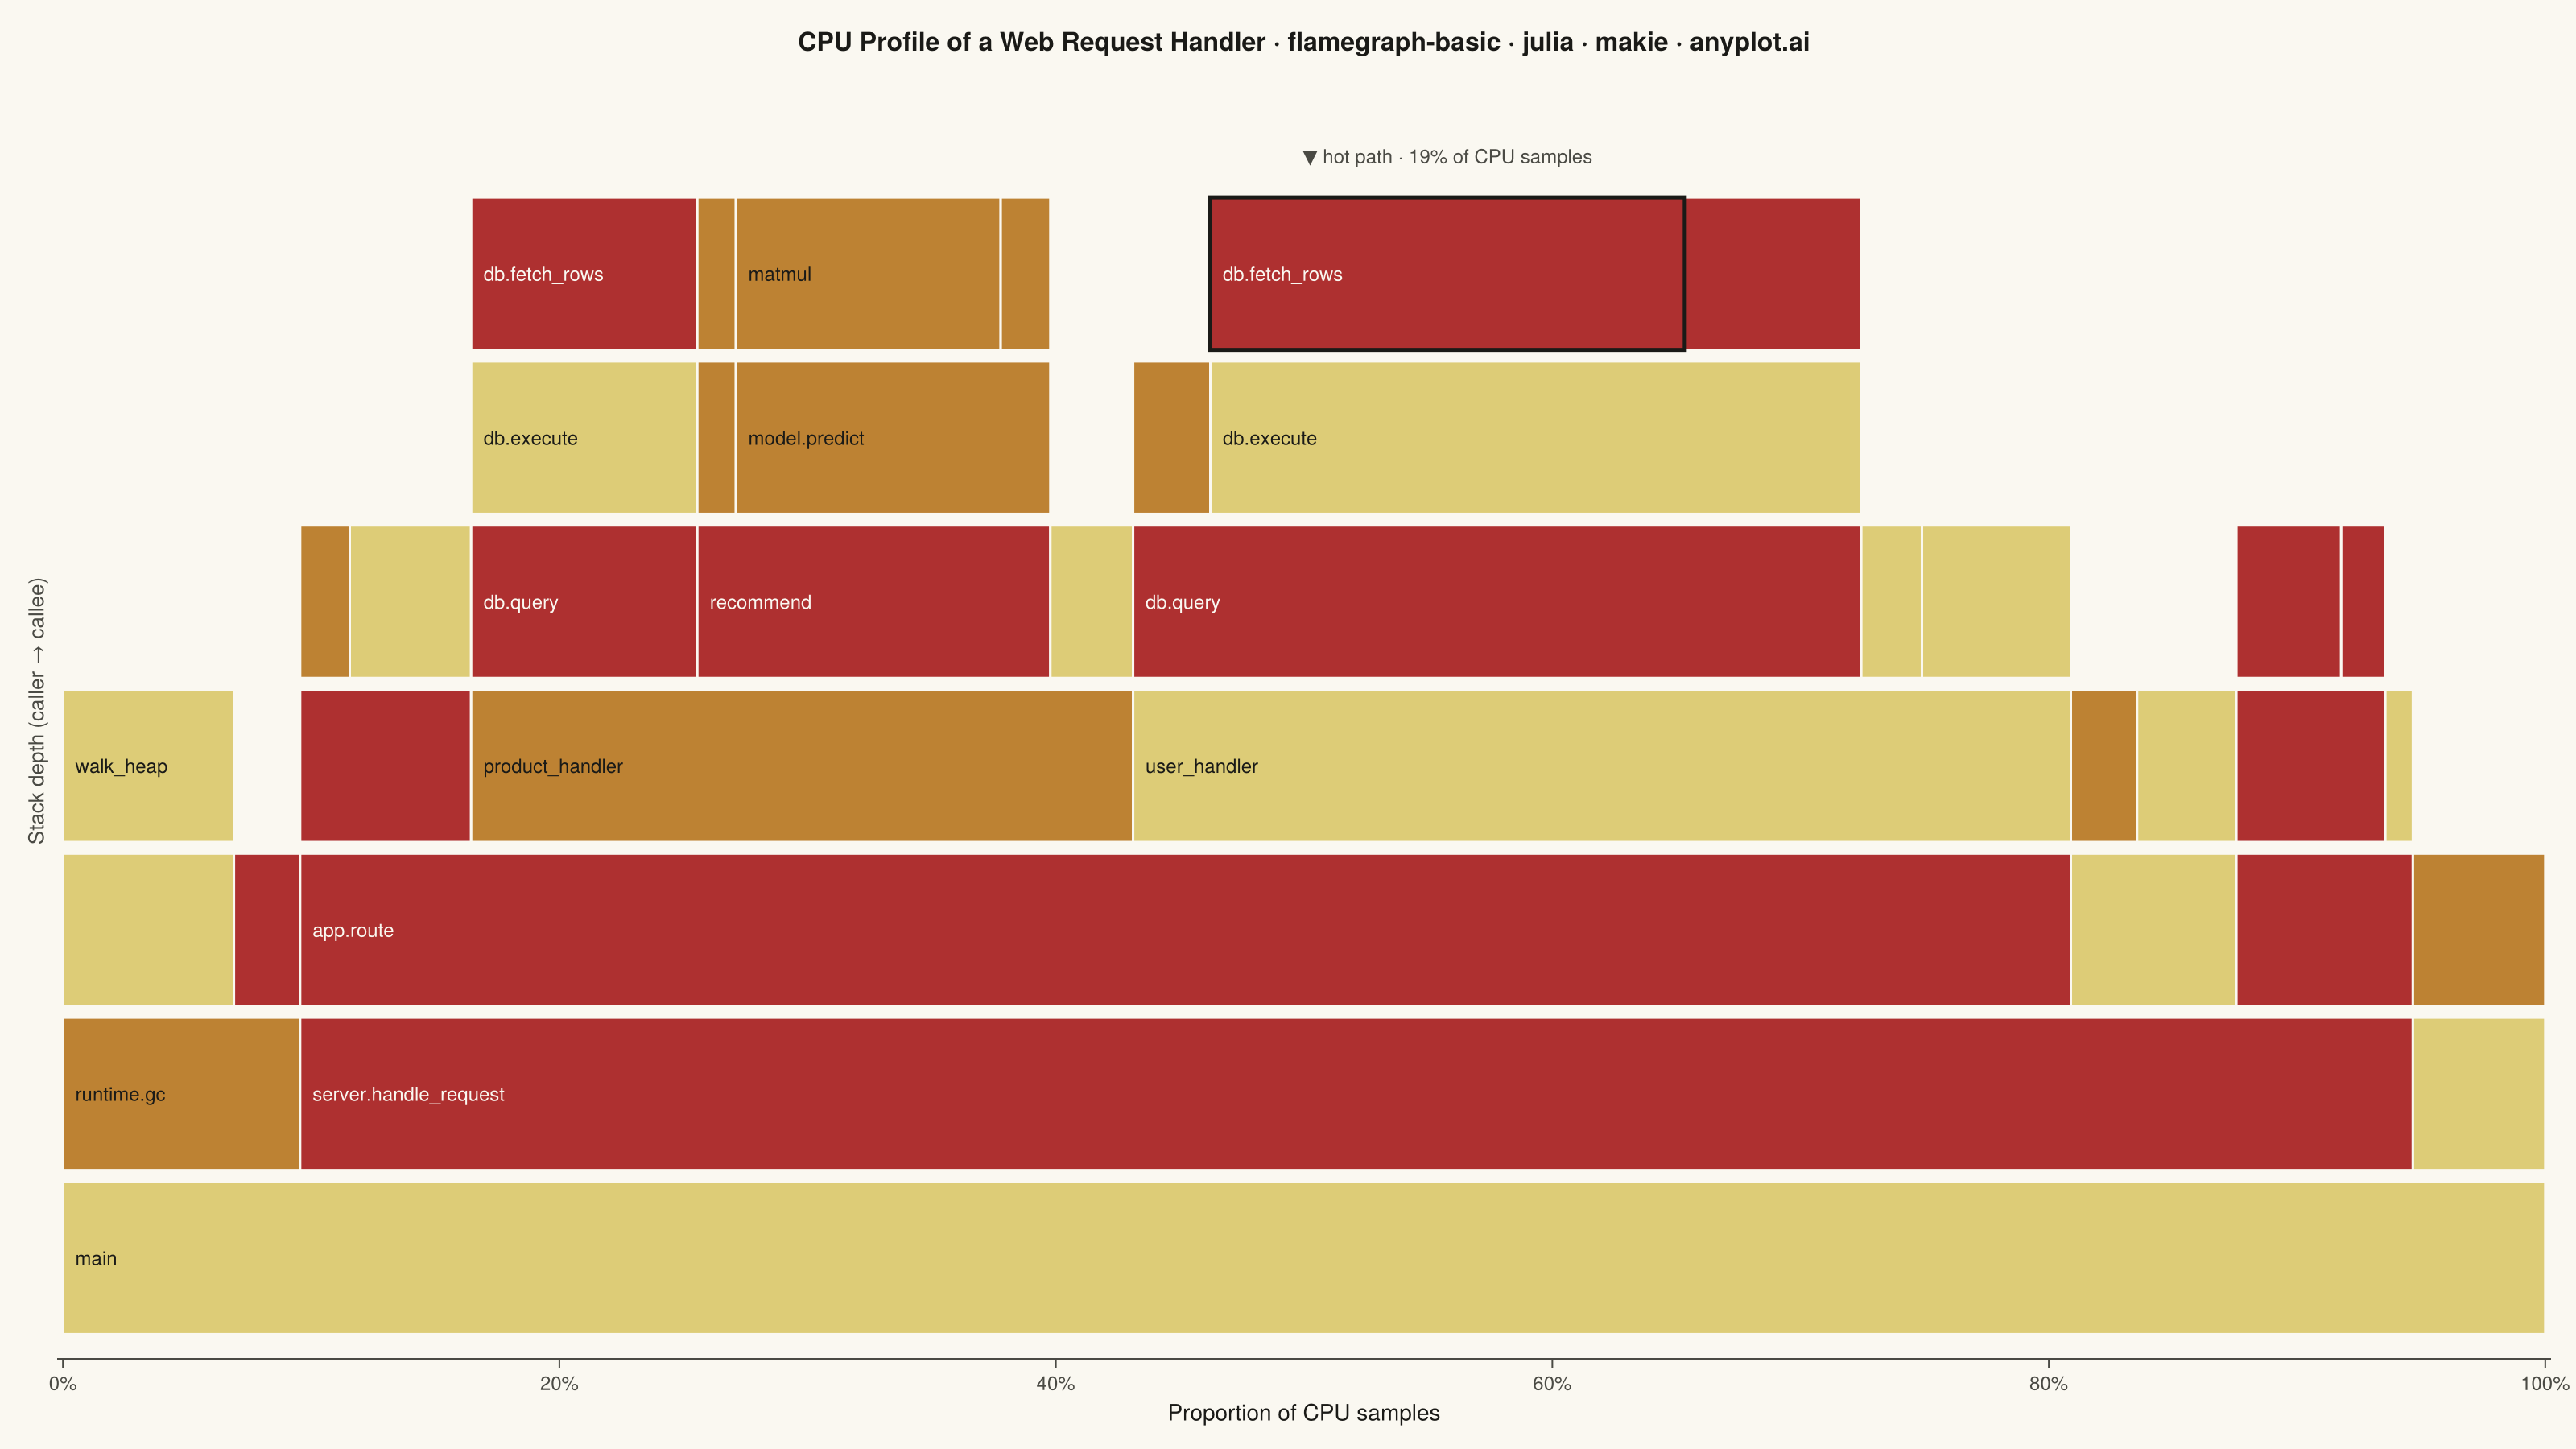
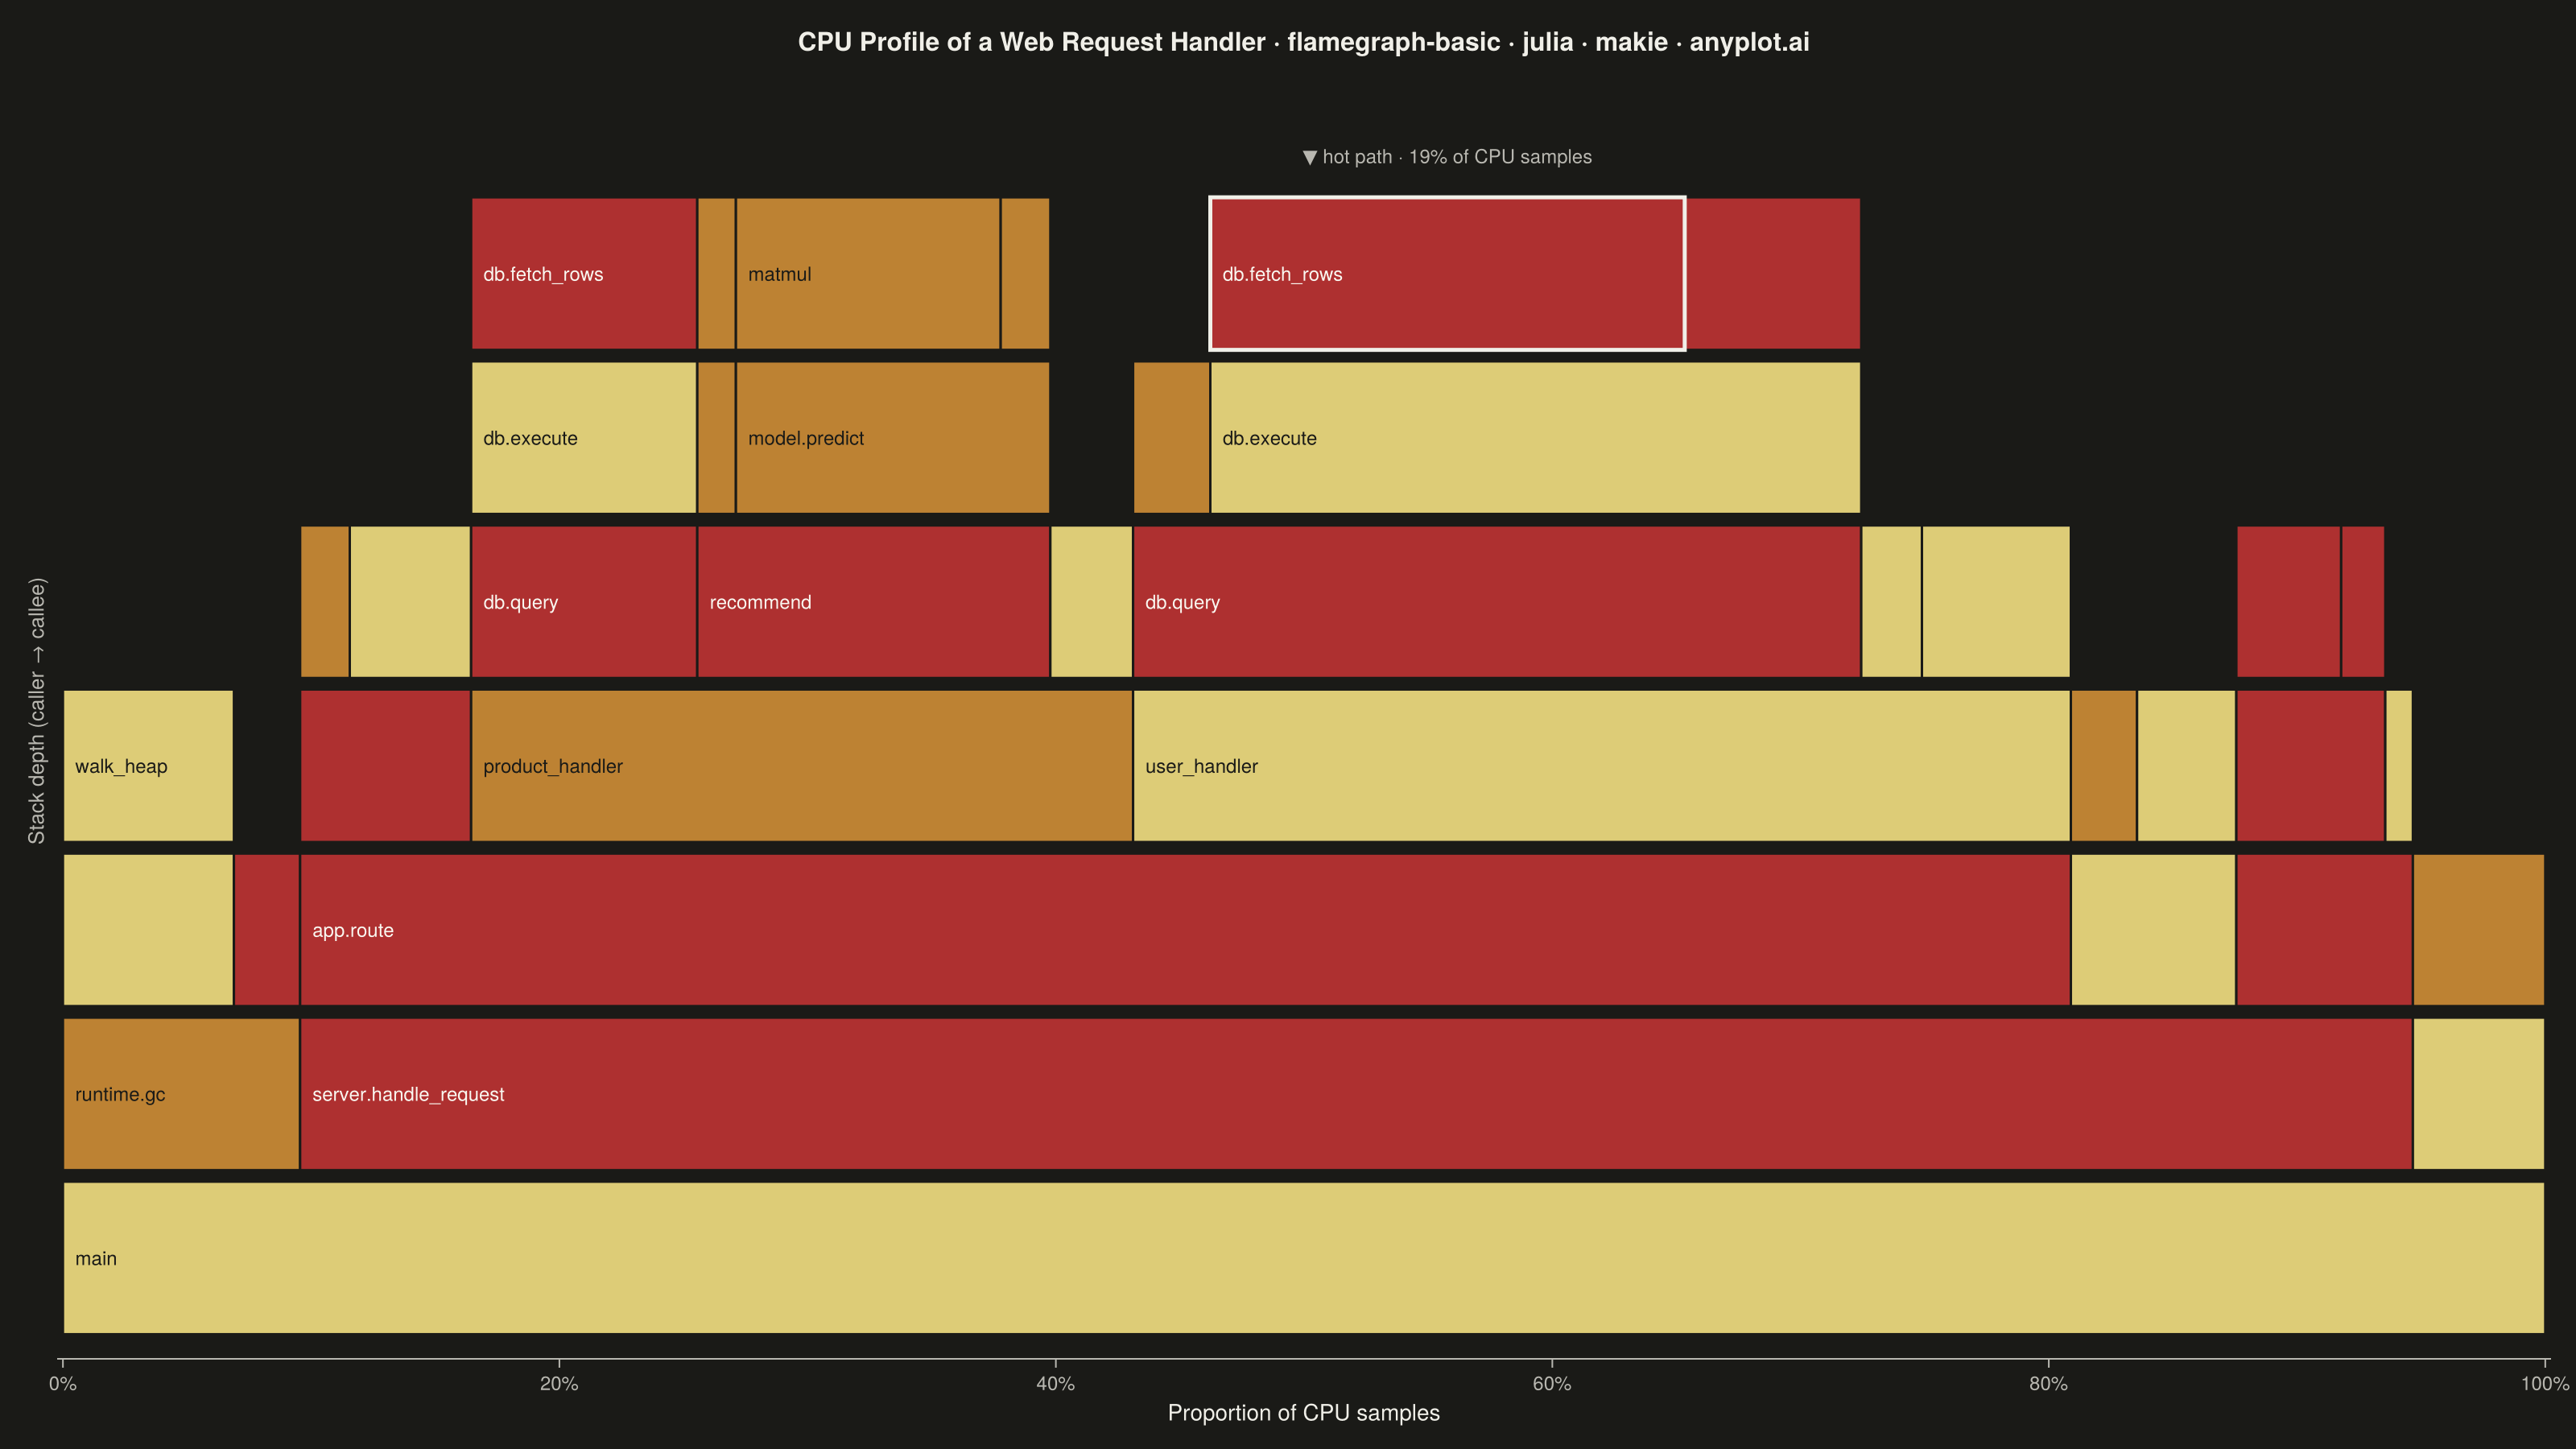
A flame graph visualizes hierarchical call stack data from performance profiling, where each horizontal bar represents a function in the call stack and its width is proportional to the time (or samples) spent in that function. Stacks are layered bottom-to-top showing caller-to-callee relationships. Invented by Brendan Gregg, flame graphs are the standard visualization for identifying CPU bottlenecks and hot code paths across all major programming languages and profiling tools.
# anyplot.ai
# flamegraph-basic: Flame Graph for Performance Profiling
# Library: makie 0.22.10 | Julia 1.11.9
# Quality: 88/100 | Created: 2026-06-08

using CairoMakie
using Colors
using Random

Random.seed!(42)

# Theme tokens ----------------------------------------------------------------
const THEME    = get(ENV, "ANYPLOT_THEME", "light")
const PAGE_BG  = THEME == "light" ? colorant"#FAF8F1" : colorant"#1A1A17"
const INK      = THEME == "light" ? colorant"#1A1A17" : colorant"#F0EFE8"
const INK_SOFT = THEME == "light" ? colorant"#4A4A44" : colorant"#B8B7B0"

# Imprint warm subset — semantic exception (the conventional flame-graph
# aesthetic is yellow → orange → red, so brand green sits out for this spec).
const FLAME_COLORS = [
    colorant"#DDCC77",  # amber (Imprint anchor — warning / heat)
    colorant"#BD8233",  # ochre (Imprint #4)
    colorant"#AE3030",  # matte red (Imprint #5)
]

# In-bar label ink chosen per fill by relative luminance — dark ink on the
# light amber / ochre bars, light ink on the matte-red bars where dark text
# would lose contrast.
function contrast_ink(c)
    r, g, b = red(c), green(c), blue(c)
    0.2126 * r + 0.7152 * g + 0.0722 * b > 0.5 ?
        colorant"#1A1A17" : colorant"#FAF8F1"
end
const FLAME_LABEL_INK = [contrast_ink(c) for c in FLAME_COLORS]

# Theme() hoists chrome tokens into a single declarative block — the per-Axis
# kwargs below only need to override plot-specific knobs (title, limits, etc).
set_theme!(Theme(
    fontsize        = 14,
    backgroundcolor = PAGE_BG,
    Axis = (
        backgroundcolor    = PAGE_BG,
        titlecolor         = INK,
        xlabelcolor        = INK,
        ylabelcolor        = INK_SOFT,
        xticklabelcolor    = INK_SOFT,
        bottomspinecolor   = INK_SOFT,
        xtickcolor         = INK_SOFT,
        topspinevisible    = false,
        rightspinevisible  = false,
        leftspinevisible   = false,
        yticksvisible      = false,
        yticklabelsvisible = false,
        xgridvisible       = false,
        ygridvisible       = false,
    ),
))

# Simulated CPU profile of a web request handler.
# Each entry: (semicolon-delimited stack from root to leaf, sample count).
profile = [
    ("main;server.handle_request;parse_request;read_headers", 18),
    ("main;server.handle_request;parse_request;parse_body", 12),
    ("main;server.handle_request;app.route;auth.verify;jwt.decode", 22),
    ("main;server.handle_request;app.route;auth.verify;cache.get", 9),
    ("main;server.handle_request;app.route;user_handler;db.query;db.connect", 14),
    ("main;server.handle_request;app.route;user_handler;db.query;db.execute;db.fetch_rows", 86),
    ("main;server.handle_request;app.route;user_handler;db.query;db.execute;db.parse_result", 32),
    ("main;server.handle_request;app.route;user_handler;serializer.to_json", 27),
    ("main;server.handle_request;app.route;user_handler;serializer.escape_html", 11),
    ("main;server.handle_request;app.route;product_handler;db.query;db.execute;db.fetch_rows", 41),
    ("main;server.handle_request;app.route;product_handler;serializer.to_json", 15),
    ("main;server.handle_request;app.route;product_handler;recommend;model.predict;matmul", 48),
    ("main;server.handle_request;app.route;product_handler;recommend;model.predict;softmax", 9),
    ("main;server.handle_request;app.route;product_handler;recommend;feature_lookup;cache.get", 7),
    ("main;server.handle_request;send_response;write_headers", 5),
    ("main;server.handle_request;send_response;write_body;gzip.compress", 19),
    ("main;server.handle_request;send_response;write_body;tcp.send", 8),
    ("main;server.poll_events;epoll_wait", 24),
    ("main;runtime.gc;mark_phase;walk_heap", 31),
    ("main;runtime.gc;sweep_phase", 12),
]

total_samples = sum(samples for (_, samples) in profile)

# Aggregate each (depth, prefix) into total samples; record children sets.
counts = Dict{Tuple{Int,String},Int}()
children = Dict{Tuple{Int,String},Set{String}}()
for (stack, samples) in profile
    parts = String.(split(stack, ';'))
    for i in 1:length(parts)
        prefix = join(parts[1:i], ';')
        key = (i - 1, prefix)
        counts[key] = get(counts, key, 0) + samples
        if i > 1
            pkey = (i - 2, join(parts[1:i-1], ';'))
            push!(get!(children, pkey, Set{String}()), prefix)
        end
    end
end

# Lay out rectangles top-down from the root, children sorted alphabetically.
# Iterative DFS keeps the implementation top-level — no recursive function.
NodeT = NamedTuple{
    (:depth, :x0, :w, :name, :prefix),
    Tuple{Int,Float64,Float64,String,String},
}
nodes = NodeT[]
queue = [("main", 0, 0.0)]
while !isempty(queue)
    prefix, depth, x0 = pop!(queue)
    width = counts[(depth, prefix)] / total_samples
    name = String(split(prefix, ';')[end])
    push!(nodes, (depth = depth, x0 = x0, w = width, name = name, prefix = prefix))

    kids = sort!(collect(get(children, (depth, prefix), Set{String}())))
    child_starts = Float64[]
    cursor = x0
    for c in kids
        push!(child_starts, cursor)
        cursor += counts[(depth + 1, c)] / total_samples
    end
    for i in length(kids):-1:1
        push!(queue, (kids[i], depth + 1, child_starts[i]))
    end
end

max_depth = maximum(n.depth for n in nodes)

# Widest leaf = dominant CPU hot path; gets a focal-point accent below.
leaves = filter(n -> !haskey(children, (n.depth, n.prefix)), nodes)
hot = leaves[argmax([l.w for l in leaves])]

# Title scaled to fit when prefixed with a descriptive subtitle.
title_text = "CPU Profile of a Web Request Handler · flamegraph-basic · julia · makie · anyplot.ai"
title_default = 20
title_size = length(title_text) > 67 ?
    max(round(Int, title_default * 67 / length(title_text)), 13) :
    title_default

fig = Figure(resolution = (1600, 900))

ax = Axis(
    fig[1, 1];
    title          = title_text,
    titlesize      = title_size,
    xlabel         = "Proportion of CPU samples",
    ylabel         = "Stack depth (caller → callee)",
    xlabelsize     = 14,
    ylabelsize     = 13,
    xticklabelsize = 12,
    limits         = ((-0.002, 1.002), (-0.15, max_depth + 1.75)),
    xticks         = (0:0.2:1.0, ["0%", "20%", "40%", "60%", "80%", "100%"]),
)

# Draw flame bars: one rectangle per node, hairline page-bg stroke between
# adjacent siblings keeps same-color neighbours visually distinct.
bar_height = 0.93
rects = [Rect2f(n.x0, n.depth, n.w, bar_height) for n in nodes]
flame_idx = [(abs(hash(n.name)) % length(FLAME_COLORS)) + 1 for n in nodes]
fill_colors = [FLAME_COLORS[i] for i in flame_idx]
poly!(ax, rects;
    color       = fill_colors,
    strokecolor = PAGE_BG,
    strokewidth = 1.5,
)

# Focal-point cue: a thicker INK outline on the dominant hot-path leaf, plus
# a short label above it stating the share of CPU samples. Subtle enough to
# preserve the flame aesthetic, explicit enough to direct the eye.
poly!(ax, Rect2f(hot.x0, hot.depth, hot.w, bar_height);
    color       = (:white, 0.0),
    strokecolor = INK,
    strokewidth = 2.5,
)
hot_pct = round(Int, hot.w * 100)
text!(ax, hot.x0 + hot.w / 2, hot.depth + bar_height + 0.18;
    text     = "▼ hot path · $(hot_pct)% of CPU samples",
    align    = (:center, :bottom),
    color    = INK_SOFT,
    fontsize = 12,
)

# Function-name labels, only where the bar is wide enough to fit the text.
# Label ink is chosen per fill color: dark on amber/ochre, light on red.
label_fontsize = 12
for (n, fc_idx) in zip(nodes, flame_idx)
    needed = length(n.name) * 0.0058 + 0.012
    if n.w >= needed
        text!(ax, n.x0 + 0.005, n.depth + bar_height / 2;
            text     = n.name,
            align    = (:left, :center),
            color    = FLAME_LABEL_INK[fc_idx],
            fontsize = label_fontsize,
        )
    end
end

save("plot-$(THEME).png", fig; px_per_unit = 2)
Runnable source as JSON, for any HTTP client: https://api.anyplot.ai/specs/flamegraph-basic/makie/code. Any spec id and library id listed in llms-full.txt fit the same URL shape; every URL below is complete and callable.
{
  "spec_id": "flamegraph-basic",
  "language": "julia",
  "library": "makie",
  "page": "https://anyplot.ai/flamegraph-basic/julia/makie",
  "hub": "https://anyplot.ai/flamegraph-basic",
  "code_json": "https://api.anyplot.ai/specs/flamegraph-basic/makie/code",
  "spec_json": "https://api.anyplot.ai/specs/flamegraph-basic",
  "render_light_png": "https://storage.googleapis.com/anyplot-images/plots/flamegraph-basic/julia/makie/plot-light.png",
  "render_dark_png": "https://storage.googleapis.com/anyplot-images/plots/flamegraph-basic/julia/makie/plot-dark.png",
  "quality_score": 88.0,
  "license": "MIT",
  "guide": "https://anyplot.ai/llms.txt"
}
Part of Flame Graph for Performance Profiling on anyplot.ai.